ChartWatchers July 27, 2018 at 06:29 PM

Hello Fellow ChartWatchers! In case you missed it, we just released a special behind-the-scenes video that I want to make sure you see. I can hardly believe that ChartCon 2018 is now only TWO WEEKS AWAY, but watching this video really made it feel even more real... Read More
ChartWatchers July 21, 2018 at 02:24 PM
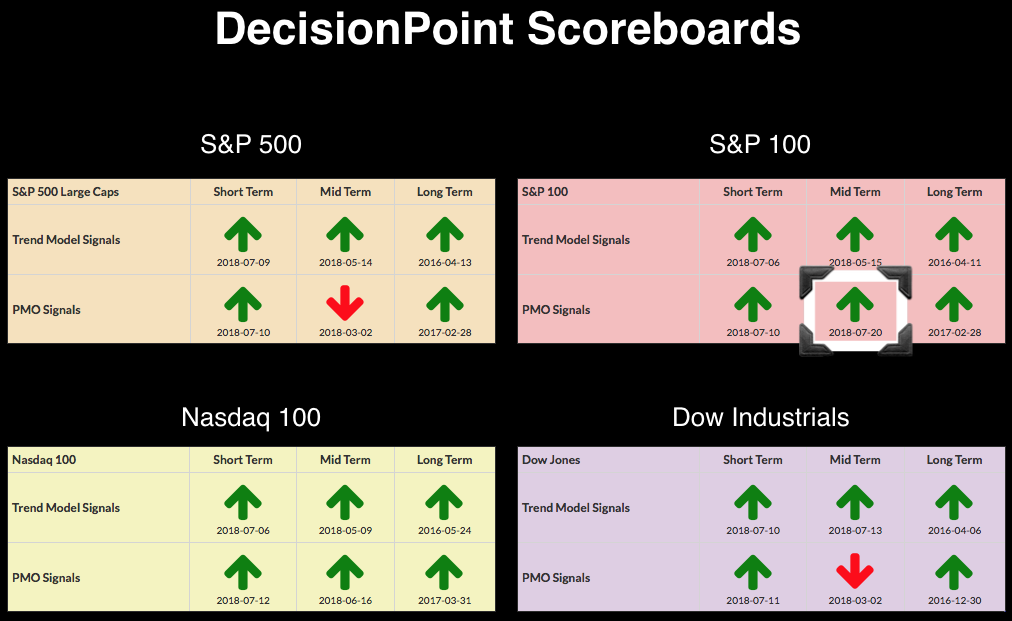
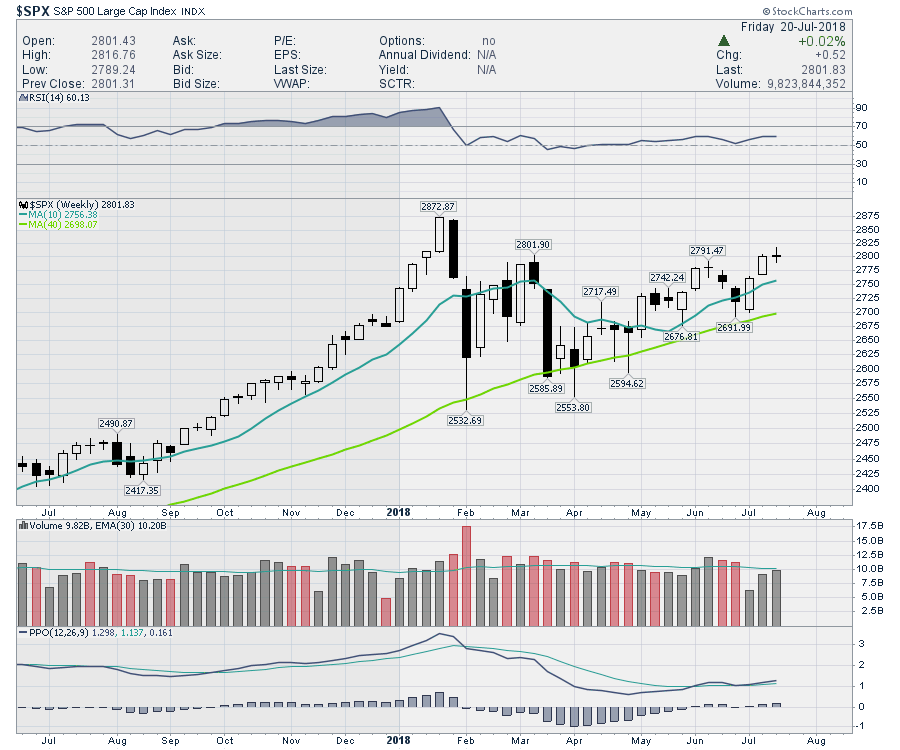
My expectation for week end was two new weekly PMO BUY signals. Instead we got only one. The SPX missed its weekly PMO BUY signal by hair or technically, by two one-hundredths of a point... Read More
ChartWatchers July 21, 2018 at 10:39 AM
The US earnings season is in full bloom with major corporate earnings announcements flowing. The earnings have come out just fine, but it seems investors had already figured that out. This week the market is flat with a doji candle... Read More
ChartWatchers July 20, 2018 at 06:42 PM
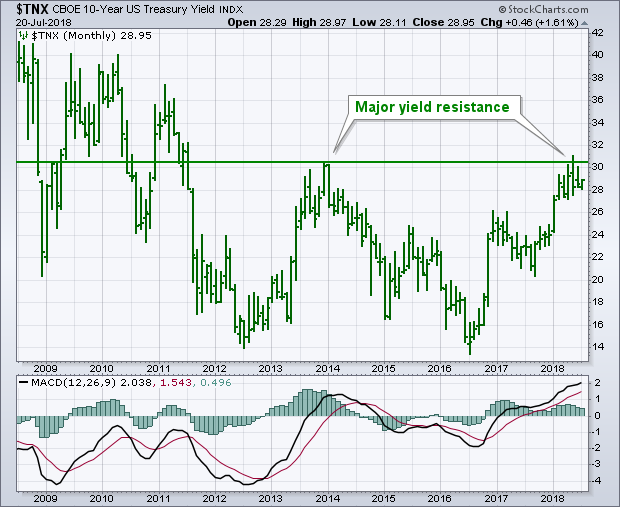
Editors Note: This article was originally published in John Murphy's Market Message on Thursday, July 19th at 1:46pm ET. The monthly bars in Chart 1 shows the 10-Year Treasury Yield ($TNX) forming a major bottoming pattern that started six years ago (2012)... Read More
ChartWatchers July 20, 2018 at 06:37 PM
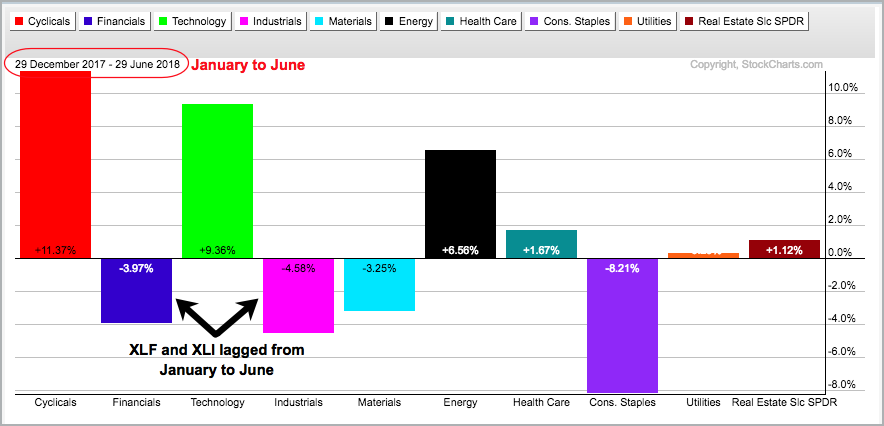
The Financials SPDR (XLF) and Industrials SPDR (XLI) weighed on the broader market the first six months of the year, but perked up in July and started to show some upside leadership... Read More
ChartWatchers July 20, 2018 at 06:35 PM
Traders have been waiting patiently for Q2 earnings season to begin and now they need to wait no longer... Read More
ChartWatchers July 07, 2018 at 01:08 PM
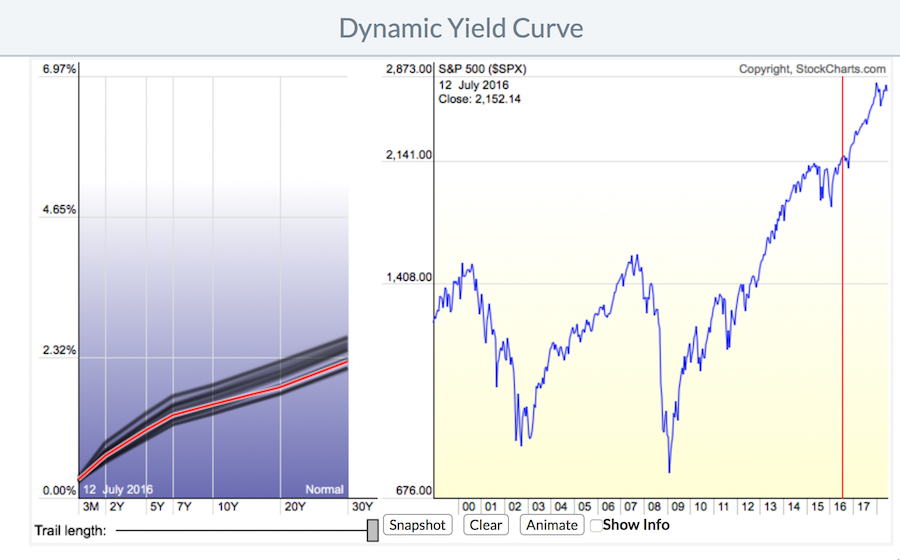
StockCharts.com has a nice Dynamic Yield Curve tool that anyone can use. It's extremely friendly. As we roll through the pictures in this article, notice the date in the upper left corner of the yellow box... Read More
ChartWatchers July 07, 2018 at 08:55 AM
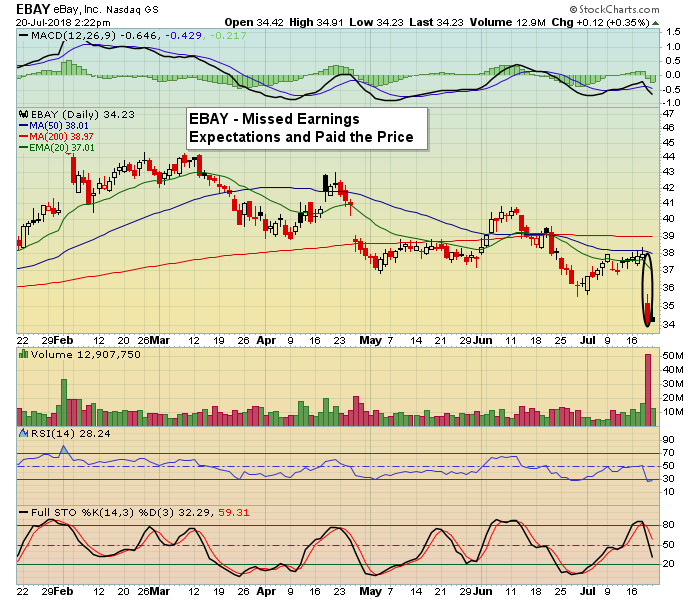
Let's first talk about a trading strategy that doesn't work. I steer clear of companies that struggle to meet Wall Street expectations and there's a very simple reason why. Management helps Wall Street set their expectations... Read More
ChartWatchers July 07, 2018 at 08:00 AM
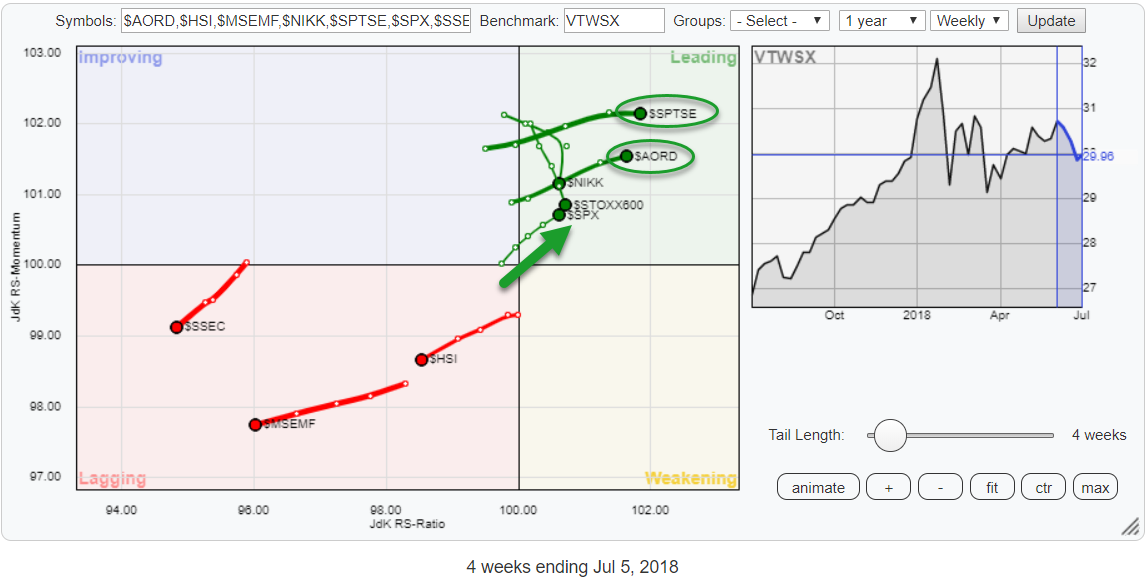
On the Relative Rotation Graph above I have grouped a selection of world equity market indices, mainly some big regions, and put them against the Vanguard Total World Stock Index (VTWSX) as the benchmark... Read More
ChartWatchers July 07, 2018 at 12:21 AM
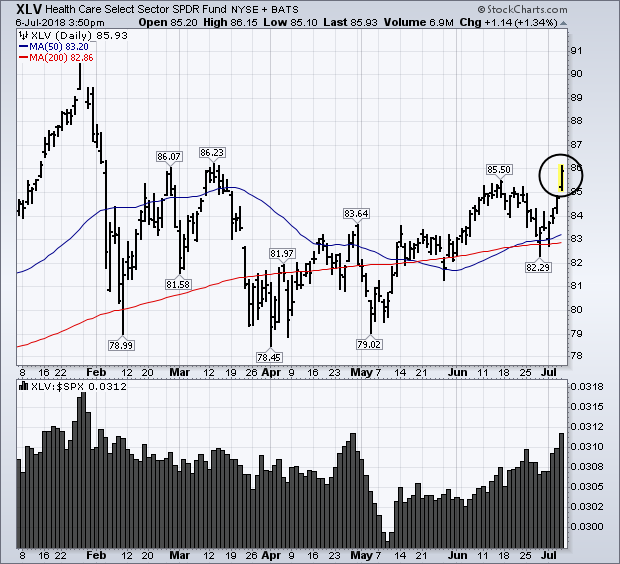
On a day when stocks are rising, and all eleven market sectors are in the black, healthcare is the standout performer. This chart shows the Health Care SPDR (XLV) rising to the highest level since the middle of March... Read More
ChartWatchers July 07, 2018 at 12:18 AM
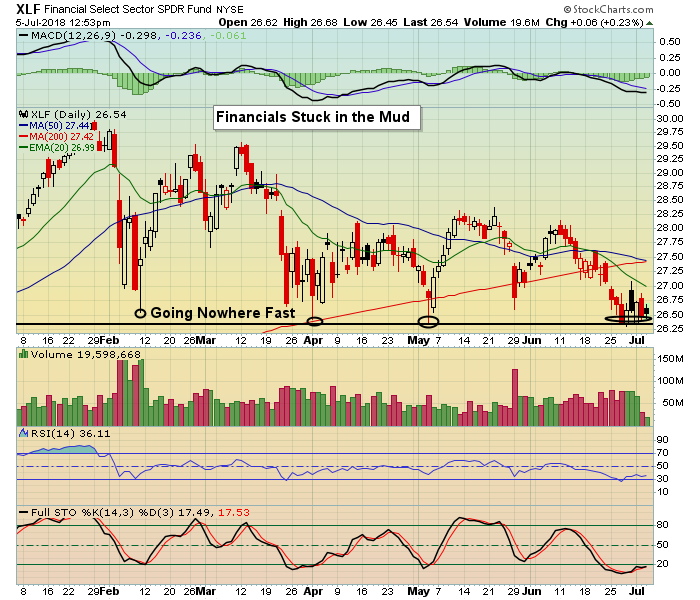
The market has been in stall mode for quite some time now. Even though the S&P perked up some on Friday it's still hanging out near levels seen in early January, going nowhere fast... Read More
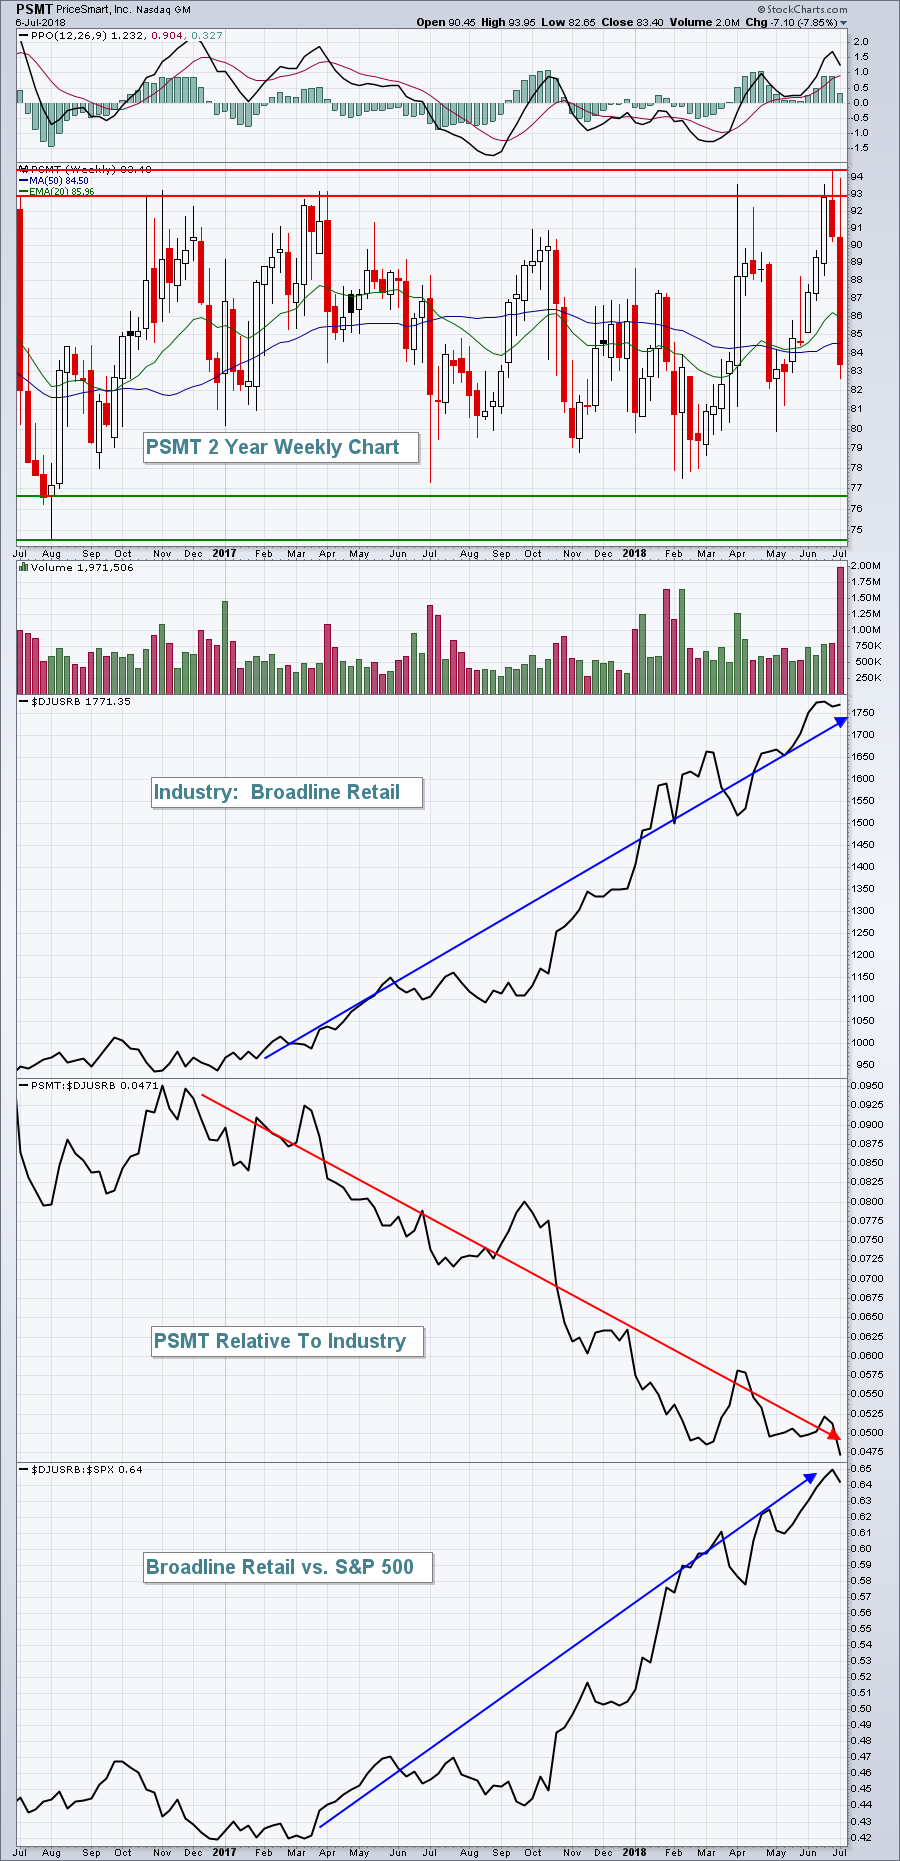
ChartWatchers July 06, 2018 at 06:53 PM
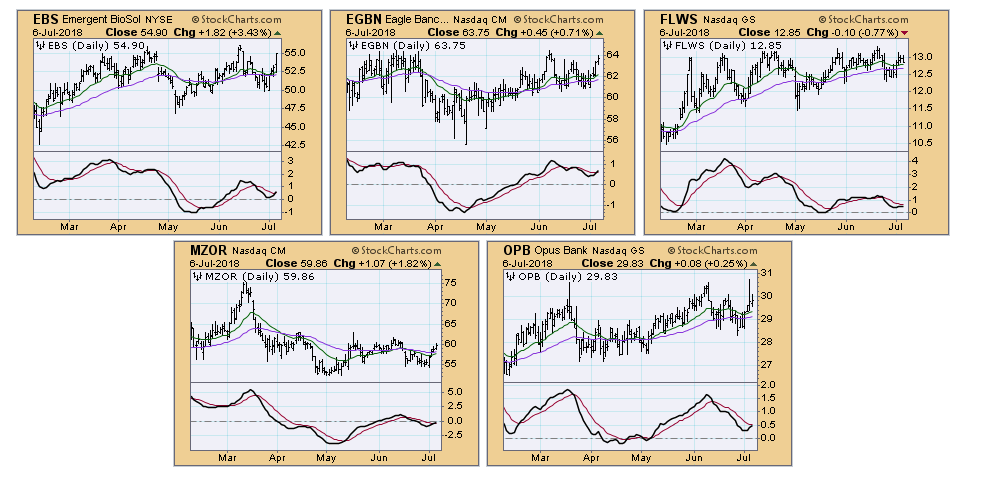
I've presented my favorite PMO scan numerous times during the MarketWatchers LIVE show, but also in articles. Here's a link to my article on that scan. However today I wanted to present my "Chart Breakouts" scan... Read More