ChartWatchers August 31, 2018 at 06:14 PM
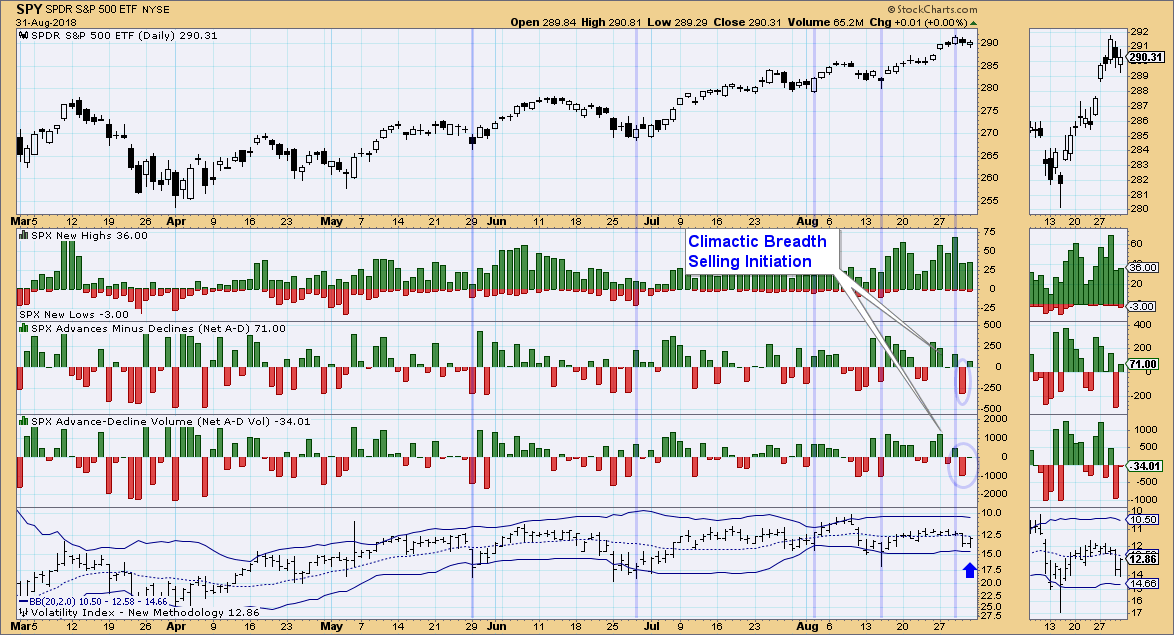
The market made new all-time highs this week, but with the upcoming holiday and short trading week, look for consolidation or continued sell-off. The indicators in the very short term and short term are suggesting a selling initiation... Read More
ChartWatchers August 31, 2018 at 03:28 PM
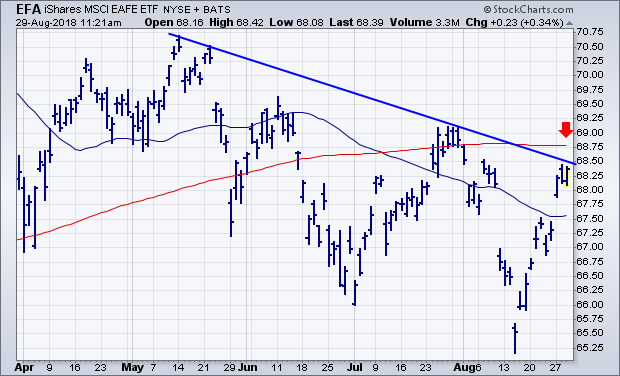
Editor's Note: This article was originally published in John Murphy's Market Message on Wednesday, August 29th at 12:33pm ET. Before leaving on vacation on August 15, I expressed concern about the fact that foreign stock ETFs were lagging too far behind the U.S... Read More
ChartWatchers August 31, 2018 at 03:18 PM
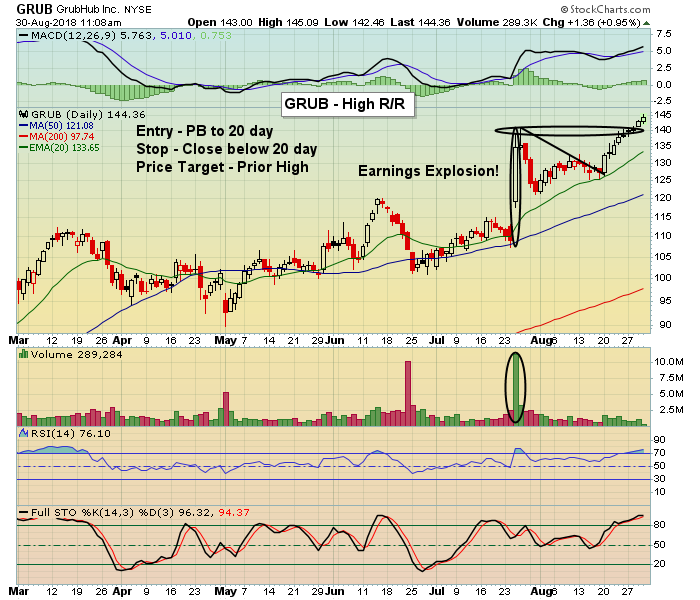
Here's a fact: Traders gravitate towards companies that beat earnings expectations. Why? Because they know they are putting their money to work in companies that outperform. Here's another fact... Read More
ChartWatchers August 18, 2018 at 05:26 PM
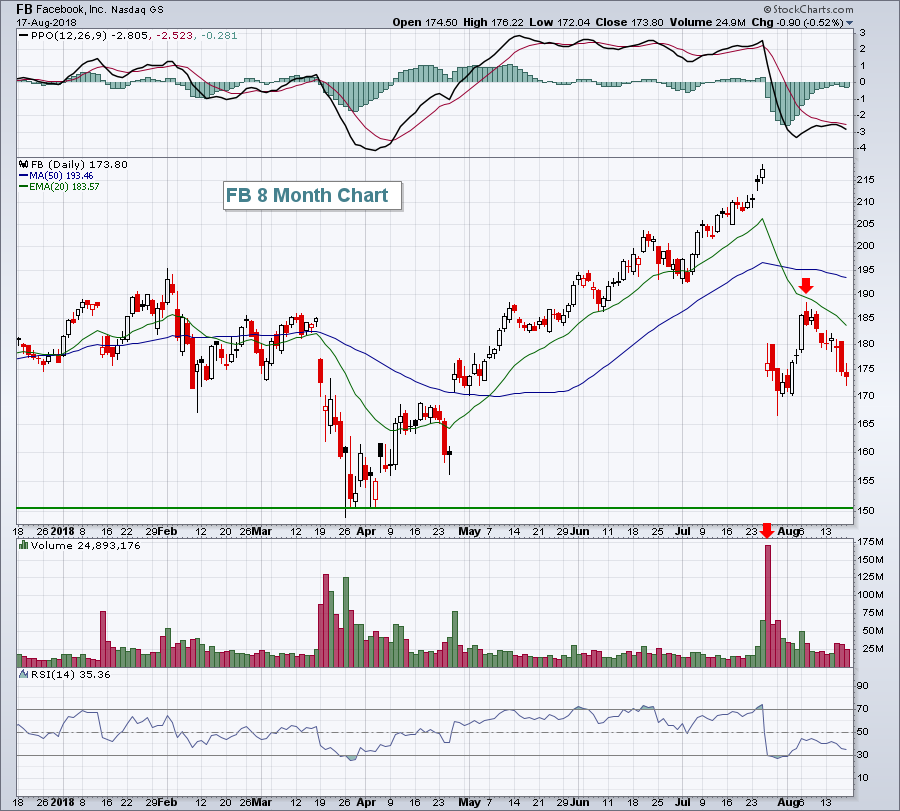
Facebook (FB) has been an internet and stock market leader for the last five years, but I believe the run is over... Read More
ChartWatchers August 18, 2018 at 03:28 PM
This week the market was rocking and rolling with large price swings... Read More
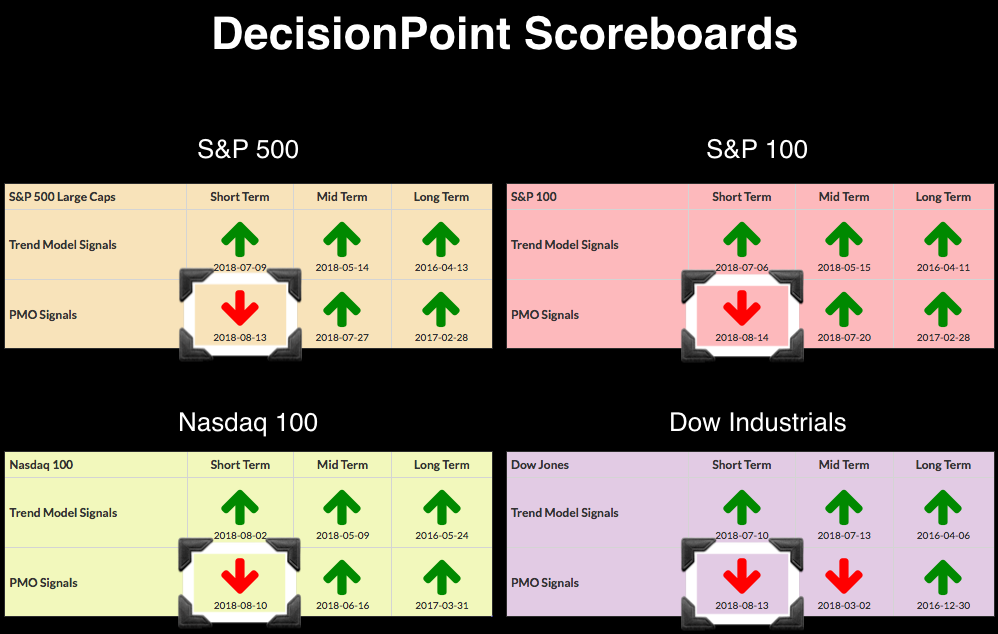
ChartWatchers August 17, 2018 at 08:50 PM

The first rule of trading is to stay on the right side of the broad market trend. There are different indexes and indicators we can use to determine the broad market trend, but few are as efficient as the S&P 500 and its 12-month EMA... Read More
ChartWatchers August 17, 2018 at 08:29 PM
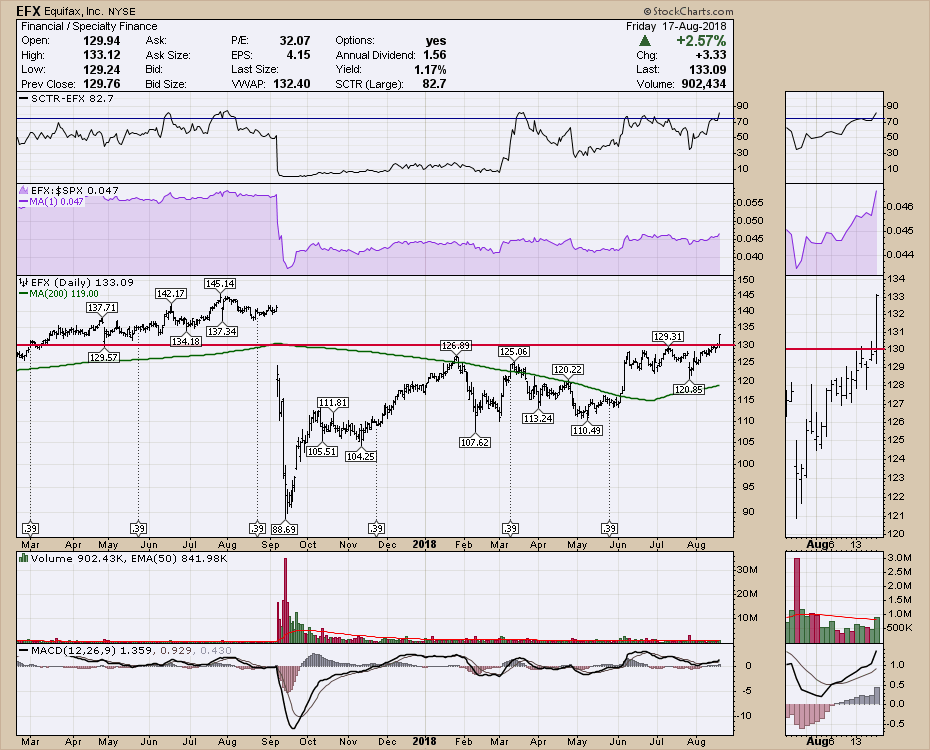
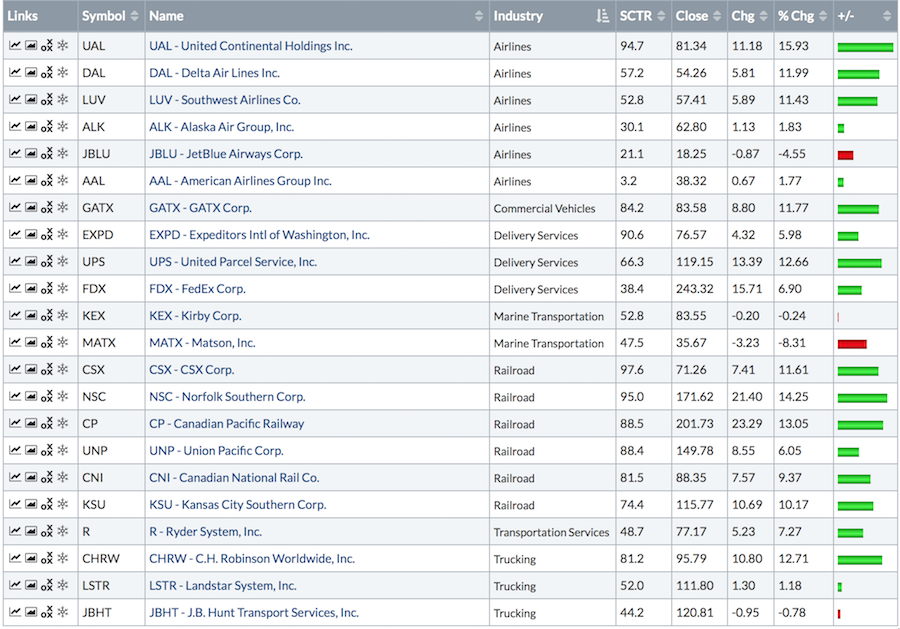
Investors in growth stocks had another troublesome week. The bifurcation continued as the NASDAQ 100 $NDX breadth data had a tough week while the $SPX breadth improved. Three stocks of interest showed up on the most active list for the $SPX to highlight the trend... Read More
ChartWatchers August 17, 2018 at 07:59 PM
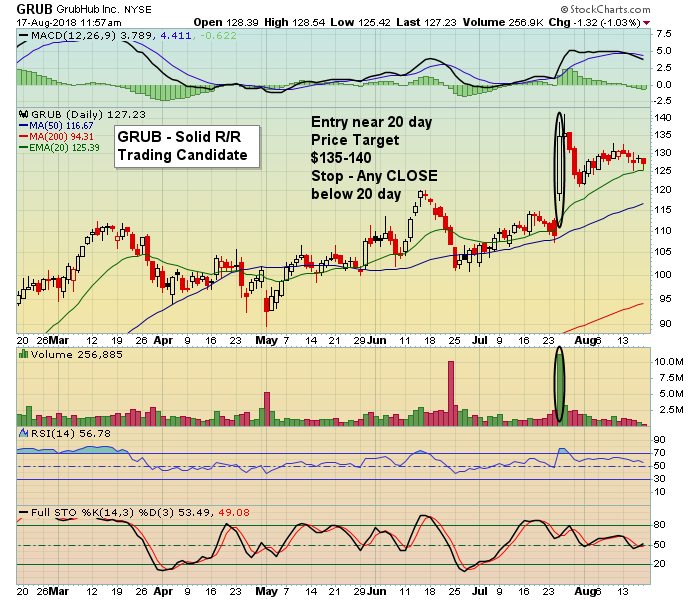
Q2 Earnings season has come and gone with the overall market response being mostly positive. And the good news for traders is there are plenty of companies that beat expectations, made nice moves higher and could become high reward to risk trading candidates on pullbacks... Read More
ChartWatchers August 17, 2018 at 07:53 PM
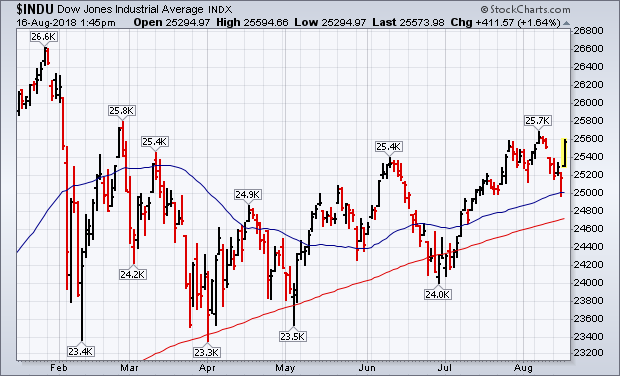
Editor's Note: This article was originally published in John Murphy's Market Message on Thursday, August 16th at 2:12pm ET. U.S. stock indexes are having an unusually strong day. Chart 1 shows the Dow Jones Industrial Average climbing more than 400 points (1... Read More
ChartWatchers August 16, 2018 at 06:54 PM
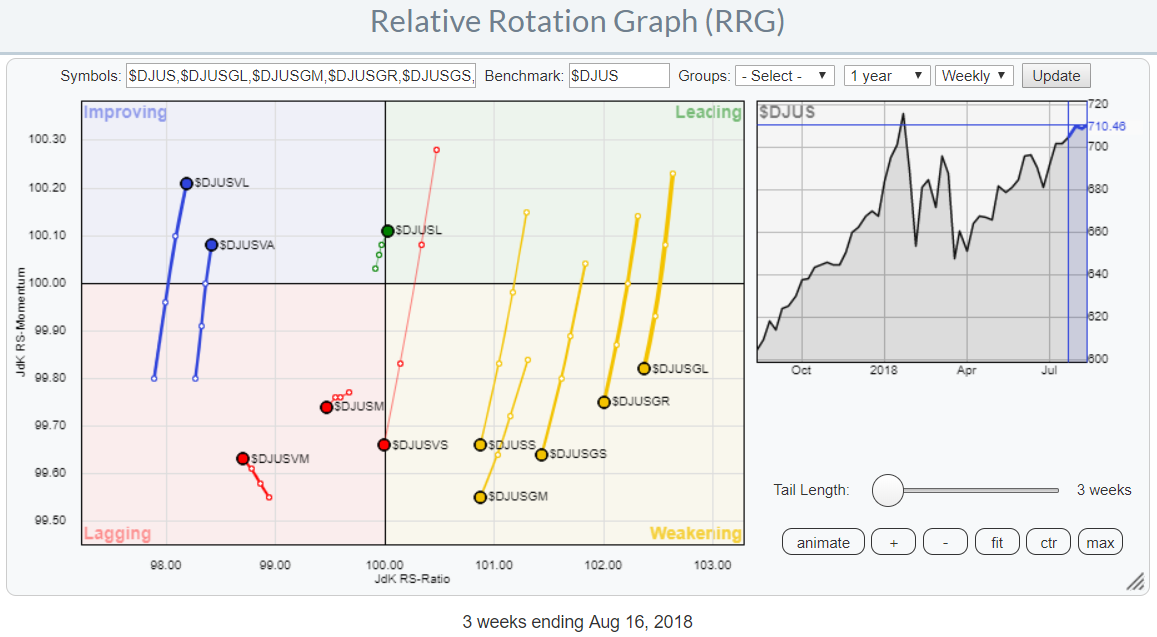
Instead of showing asset class rotation or sector rotation, Relative Rotation Graphs can also be used to show rotation among various market segments. You have all seen or heard about a breakdown of the market in large-, mid-, and small-cap stocks... Read More
ChartWatchers August 04, 2018 at 11:59 AM
Just a reminder, I am the opening speaker kicking off Chartcon 2018 on Friday morning, August 10th! DON'T BE LATE! I hope to be one of the strongest presentations to kick this off... Read More
ChartWatchers August 04, 2018 at 10:17 AM
Buying is so easy. When you pull that trigger to buy, optimism abounds. Maybe it was a recommendation from a friend. Perhaps there was water cooler talk of the next Apple (AAPL). You might even have uncovered it from a time-tested scan. The reason doesn't really matter... Read More
ChartWatchers August 04, 2018 at 09:56 AM
Relative Rotation Graphs are a great tool to visualize equity sector rotation and they are probably most used for that purpose... Read More
ChartWatchers August 04, 2018 at 04:40 AM
Trend following strategies are built on the premise that trends persist and we can make money by simply following the trend until it ends. There will be losers along the way, but a few strong trends will more than make up for the losses... Read More
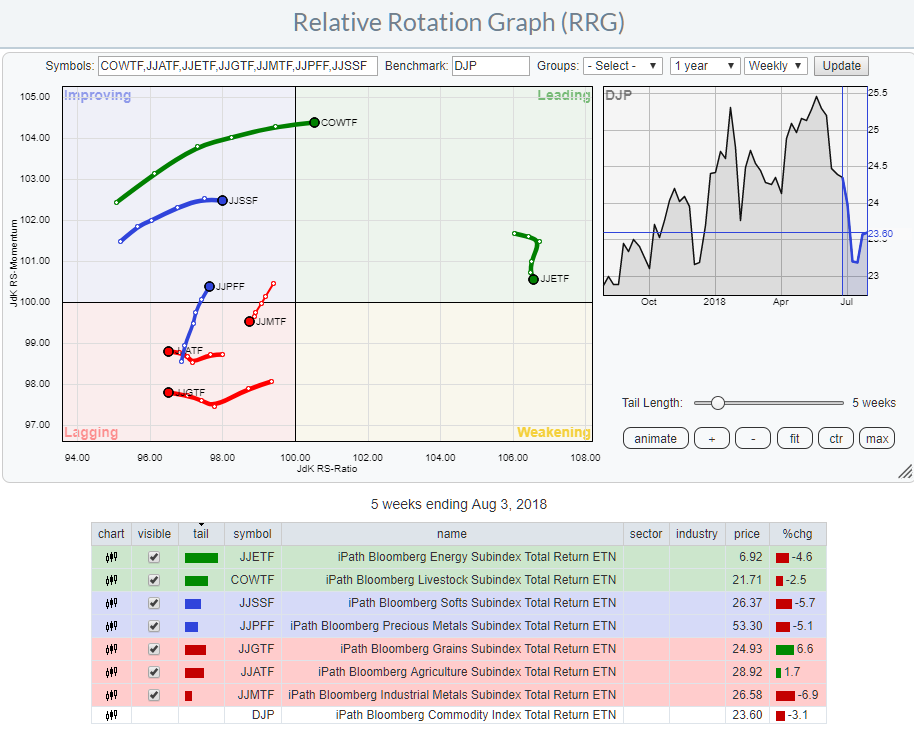
ChartWatchers August 03, 2018 at 06:05 PM
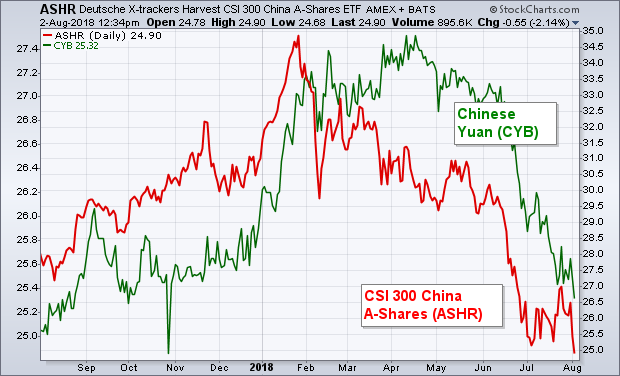
Editors Note: This article was originally published in John Murphy's Market Message on Thursday, August 2nd at 1:43pm ET. TARIFF THREATS PUSH CHINESE MARKETS LOWER ..... Read More
ChartWatchers August 03, 2018 at 01:20 PM
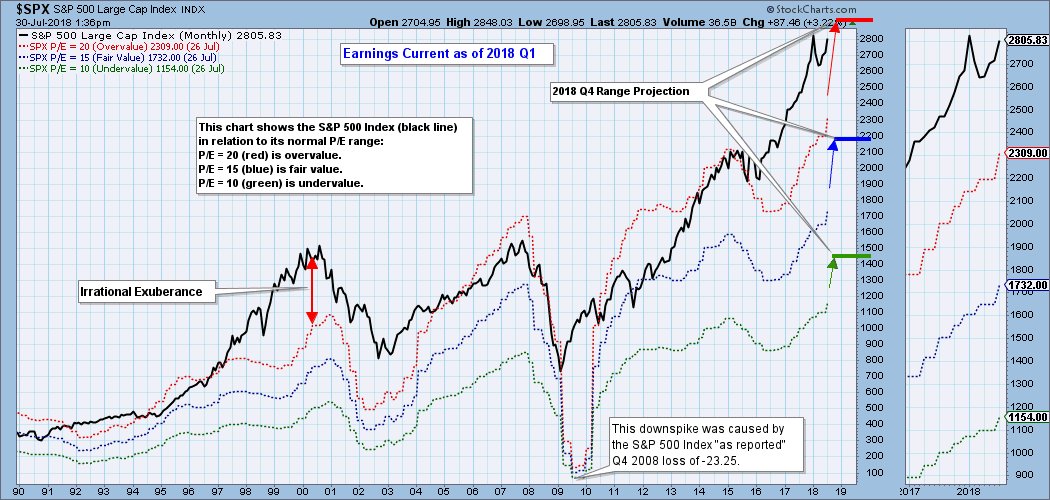
What's a technical guy doing talking about fundamentals? Well, I believe that charts of fundamental data are as useful as price charts in helping us visualize fundamental context and trends... Read More
ChartWatchers August 02, 2018 at 04:21 PM

Hello Fellow ChartWatchers! Can you believe that we’re just ONE WEEK AWAY from ChartCon 2018? Our 5th online investing conference goes LIVE on the morning of August 1oth at 10:00am ET, and I can hardly contain my excitement... Read More