Don't Ignore This Chart! March 30, 2015 at 01:19 PM
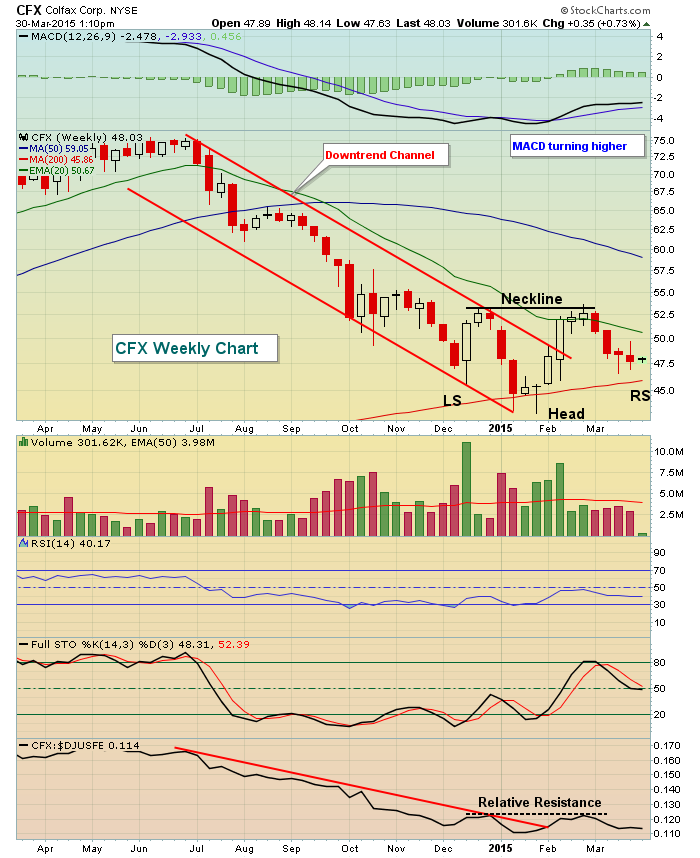
Industrial machinery ($DJUSFE) stocks have been consolidating in what some technicians might argue is a bullish inverse head & shoulders pattern. If the group does eventually see money rotate back into it, Colfax Corp (CFX) could be a direct beneficiary... Read More
Don't Ignore This Chart! March 25, 2015 at 02:48 PM
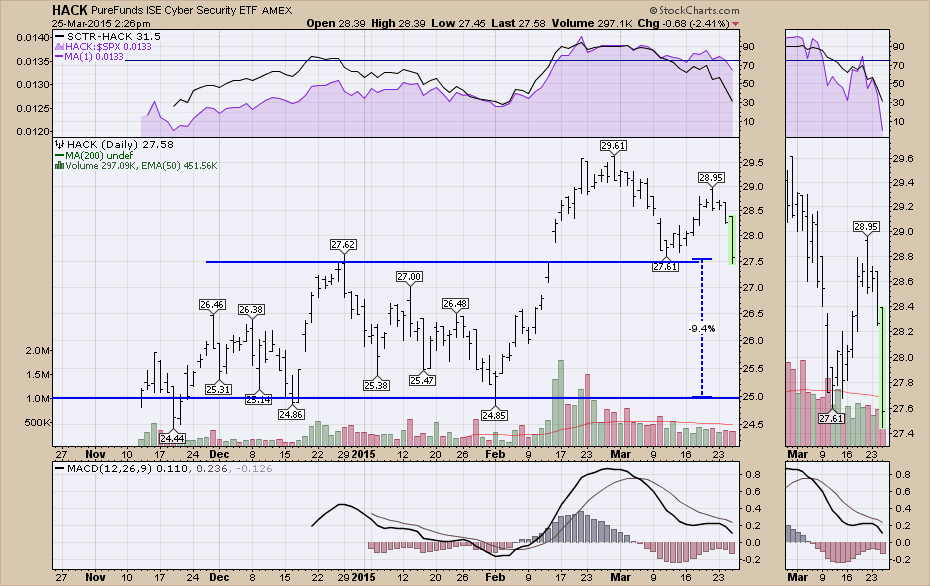
Cyber security is one of the fastest growing segments within the IT community. Recently, an ETF launched to help investors invest in a broad array of cyber security technologies. The cyber security ETF ticker symbol is HACK... Read More
Don't Ignore This Chart! March 25, 2015 at 10:33 AM

Lexmark (LXK) announced after the closing bell on Tuesday that it was acquiring enterprise software company Kofax (KFX) for $1 billion, its largest acquisition in its history... Read More
Don't Ignore This Chart! March 23, 2015 at 10:54 AM
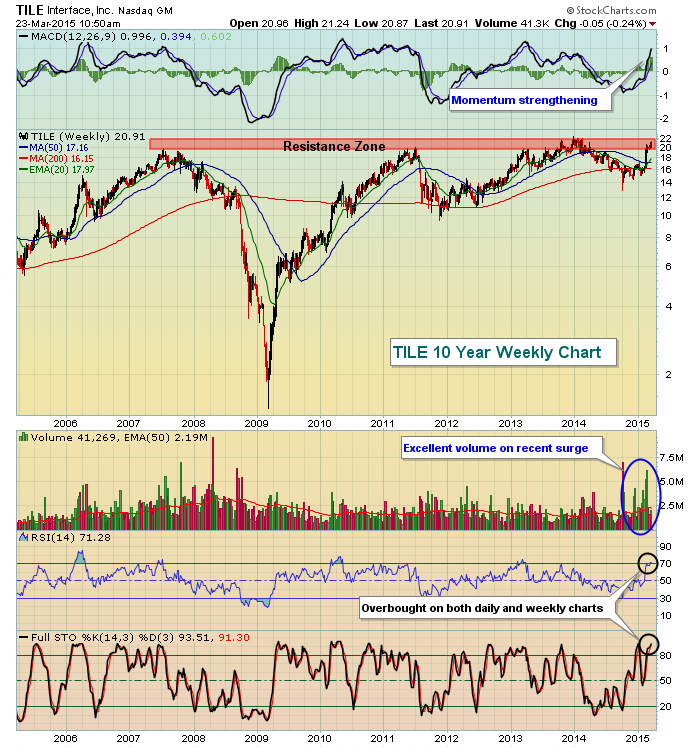
TILE is an industrial goods company that designs, produces and sells modular carpet products internationally. Strong quarterly results reported in February, exceeding Wall Street estimates, has sent TILE's shares surging 27% higher in just the past month... Read More
Don't Ignore This Chart! March 20, 2015 at 07:33 AM
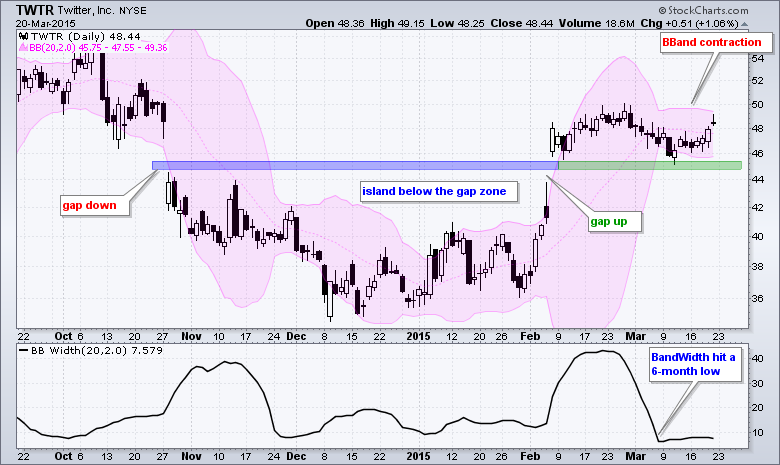
Even though the pattern is a bit big, the gaps fit and it looks like Twitter (TWTR) traced out a large island reversal from late October to early February. The stock gapped below 45, traded below this gap for a few months and then gapped above 45... Read More
Don't Ignore This Chart! March 19, 2015 at 12:33 PM
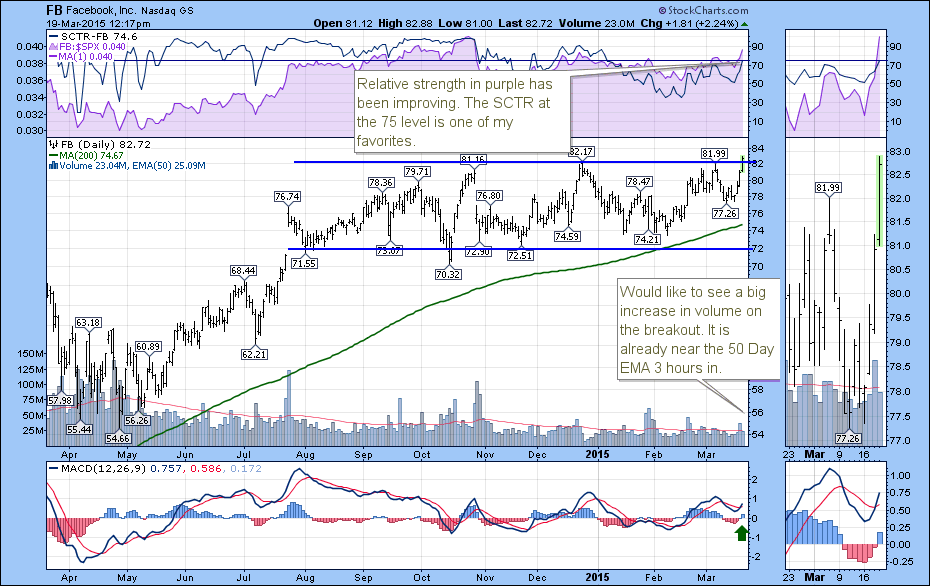
Facebook (FB) has been holding growth investors at bay for nine months. In a world where patience is added or removed, it's been part of the Facebook story for 3 seasons. As we roll into spring this weekend, Facebook is popping up like crocuses in the Netherlands... Read More
Don't Ignore This Chart! March 18, 2015 at 10:31 AM
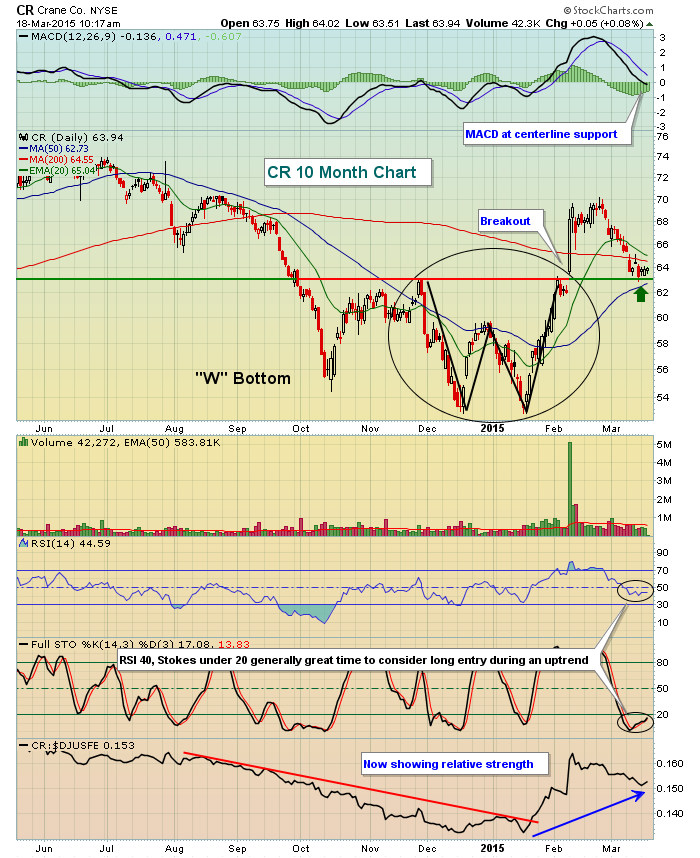
Crane (CR) is a part of the Industrial Machinery ($DJUSFE) space, which has been consolidating since last summer and is poised to break out once again... Read More
Don't Ignore This Chart! March 18, 2015 at 07:04 AM
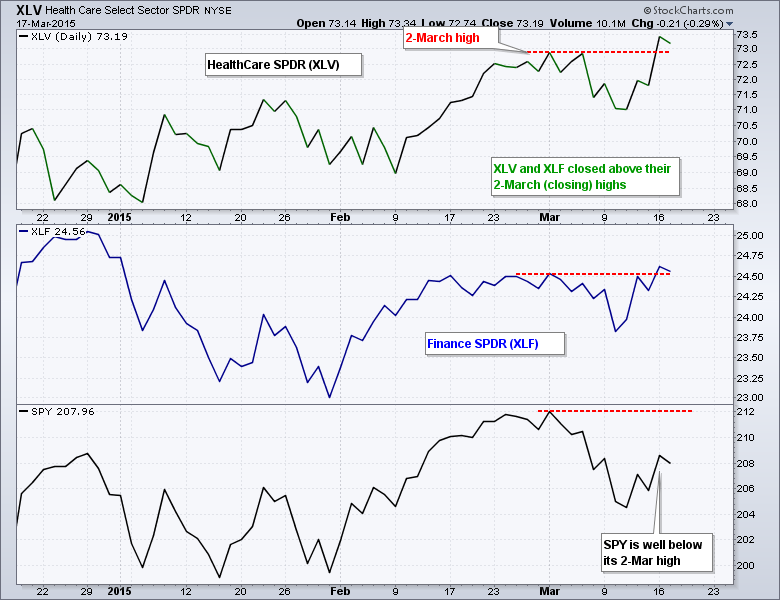
There are several ways to measure relative performance here at StockCharts. Chartists can use ratio charts (XLF:SPY), the StockCharts Technical Rank (SCTR) or Relative Rotation Graphs (RRGs). Chartists can also compare the respective price charts... Read More
Don't Ignore This Chart! March 17, 2015 at 10:42 AM
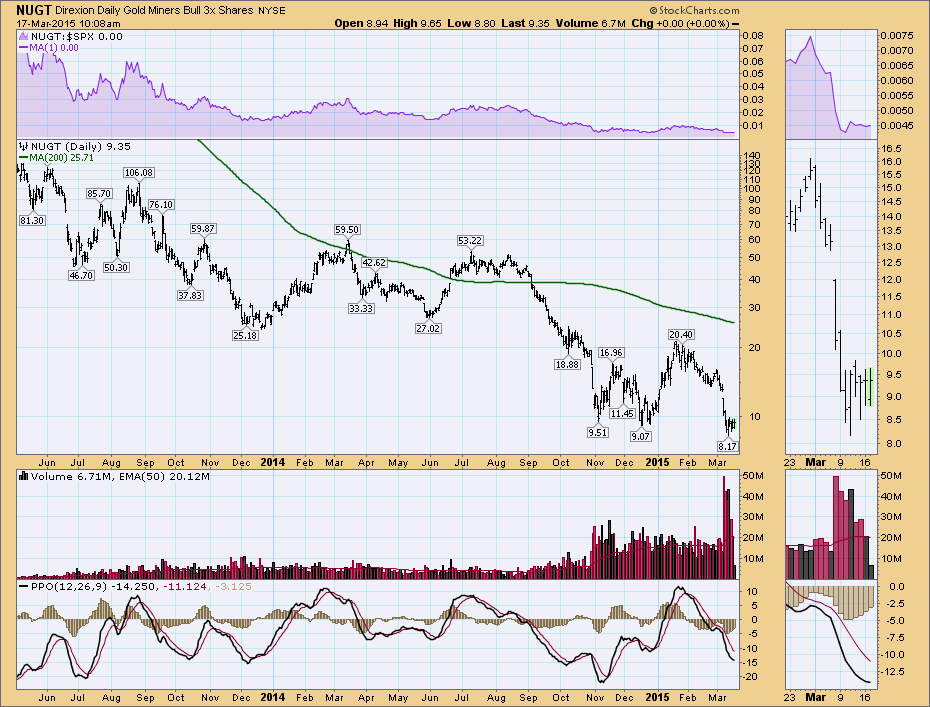
While we don't usually use triple ETF's for the 'Don't Ignore This Chart' blog, the clues on this NUGT chart are applicable to all gold traders. There are a certain group of traders that trade the 3x ETF's... Read More
Don't Ignore This Chart! March 16, 2015 at 12:06 PM
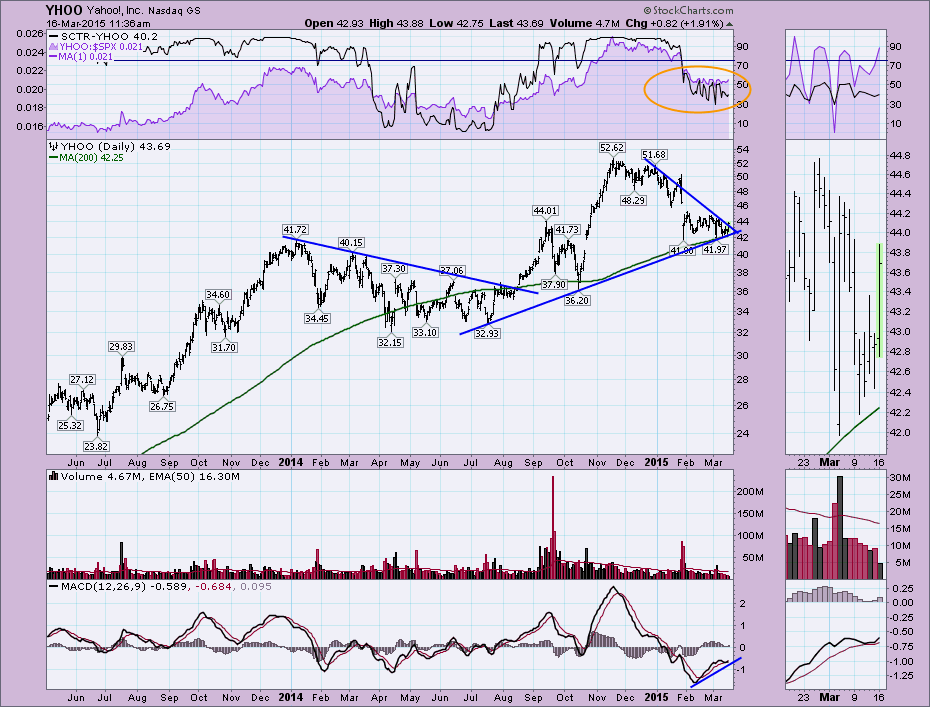
In Calgary, we use the word Yahoo way more often than the rest of the world. Our primary usage is during Stampede Week or The Greatest Outdoor Show On Earth... Read More
Don't Ignore This Chart! March 16, 2015 at 08:49 AM
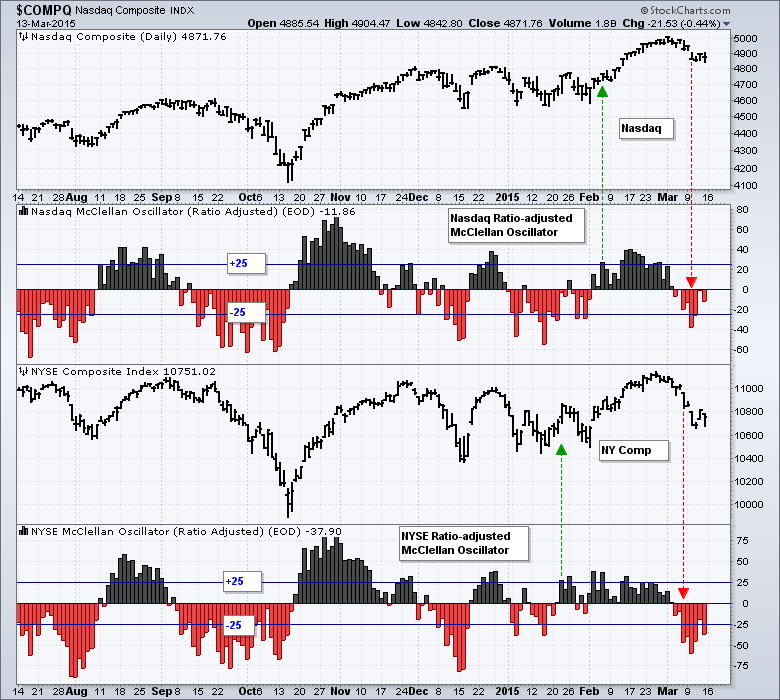
The NYSE McClellan Oscillator ($NYMO) turned negative on March 4th and moved below -25 on March 6th, while the Nasdaq McClellan Oscillator ($NAMO) also turned negative on March 4th, but did not move below -25 until March 10th (red arrows)... Read More
Don't Ignore This Chart! March 12, 2015 at 11:03 AM
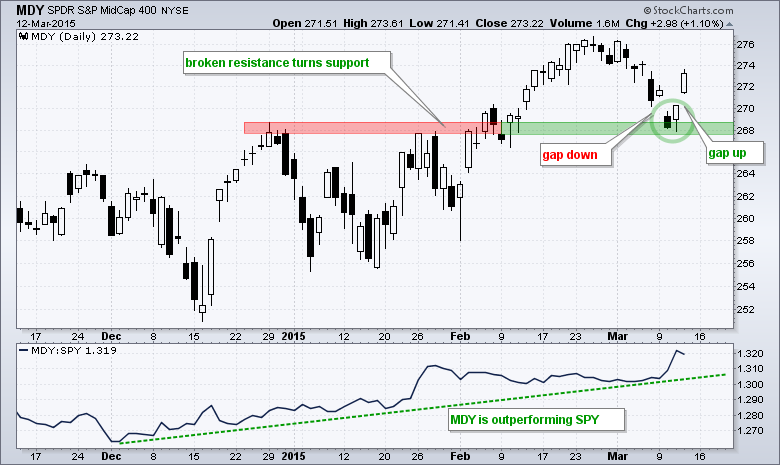
The S&P MidCap SPDR (MDY) fell to broken resistance with a gap down on Tuesday, firmed on Wednesday and gapped up on Thursday morning. The two gaps created a price "island" on Tuesday-Wednesday and an island reversal over the last four days... Read More
Don't Ignore This Chart! March 11, 2015 at 12:16 PM
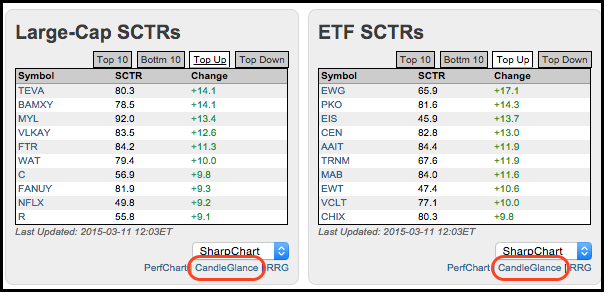
Chartists looking for movers and shakers can turn to the home page and check out the SCTR tables. Click the Top Up tab to see the big gainers (relative strength) and the Top Down tab to see the big losers (relative weakness)... Read More
Don't Ignore This Chart! March 10, 2015 at 10:41 AM
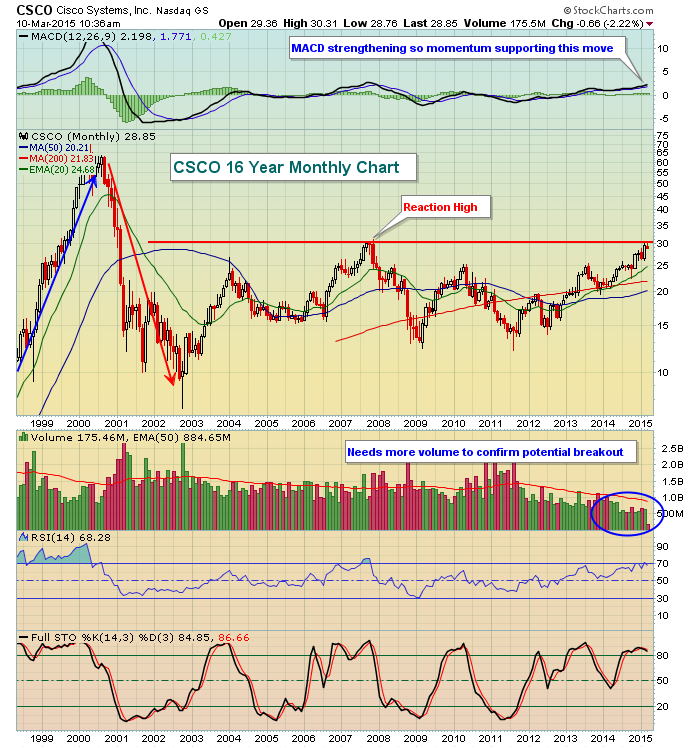
Since the tech bubble popped in the early 2000s, CSCO has slowly risen from the ashes. It fell a remarkable 90% from its high in 2000 to its low in late 2002. Keep in mind, however, that it made a parabolic move higher prior to this drop... Read More
Don't Ignore This Chart! March 09, 2015 at 02:14 PM
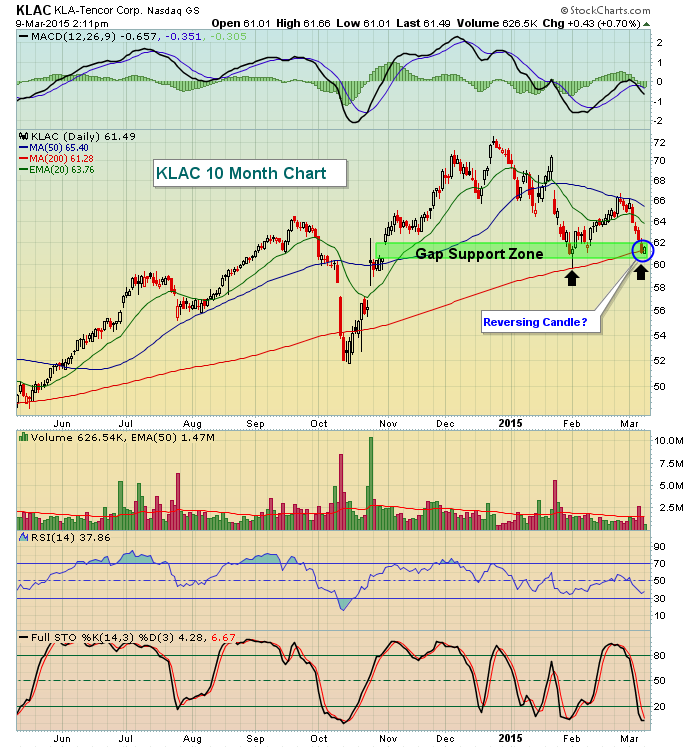
Semiconductors ($DJUSSC) are one of the worst areas of the market today and have been one of the worst areas of technology over the past week. KLA-Tencor (KLAC) has hit a key area of support, however, and certainly presents a much better reward to risk opportunity. 60... Read More
Don't Ignore This Chart! March 06, 2015 at 02:58 PM
Yesterday on the webinar, I suggested we were at the make or break point for the change in interest rates. Today, the SCTR rankings for ETF's related to interest rates rising were all up big in a big down market... Read More
Don't Ignore This Chart! March 06, 2015 at 11:57 AM
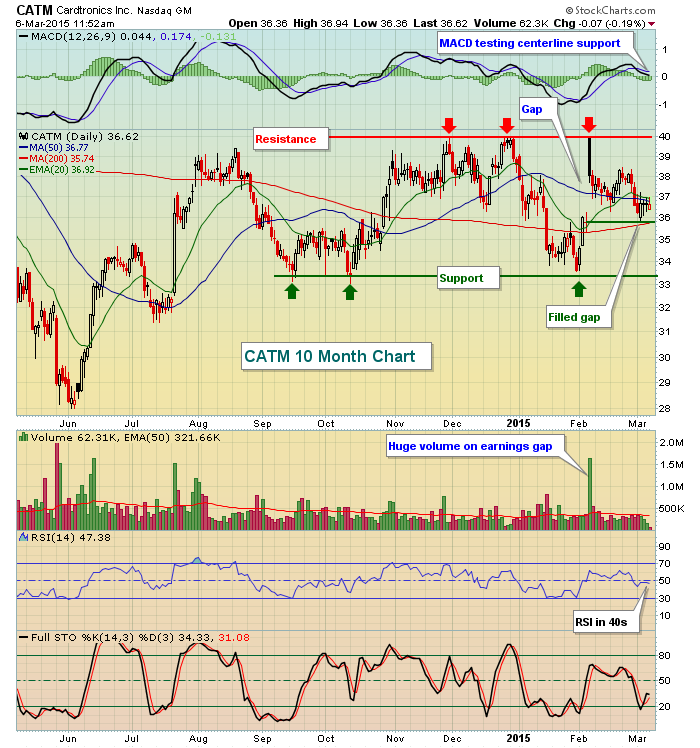
Cardtronics (CATM) reported stellar quarterly results on February 4th after the close, beating Wall Street estimates with respect to both revenues ($283.9 million actual vs. $270.6 million estimate) and EPS ($.64 actual vs. $.57 estimate)... Read More
Don't Ignore This Chart! March 05, 2015 at 04:10 PM
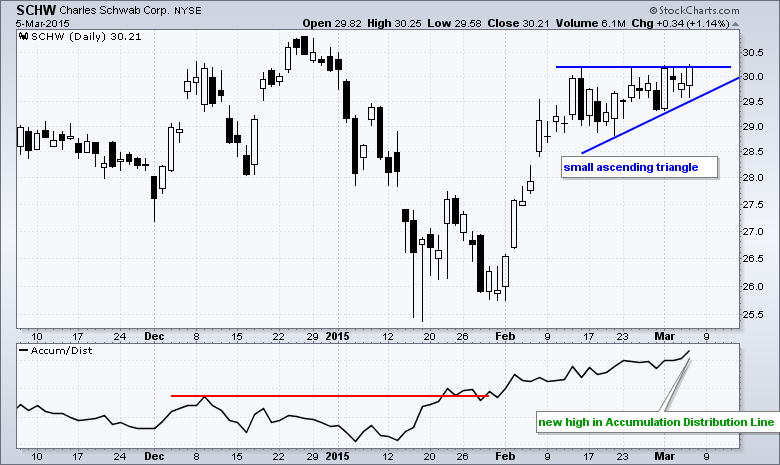
Charles Schwab (SCHW) surged in February and then consolidated the last few weeks with an ascending triangle, which is a bullish continuation pattern. A breakout would signal a continuation of the prior advance and target a move to new highs... Read More
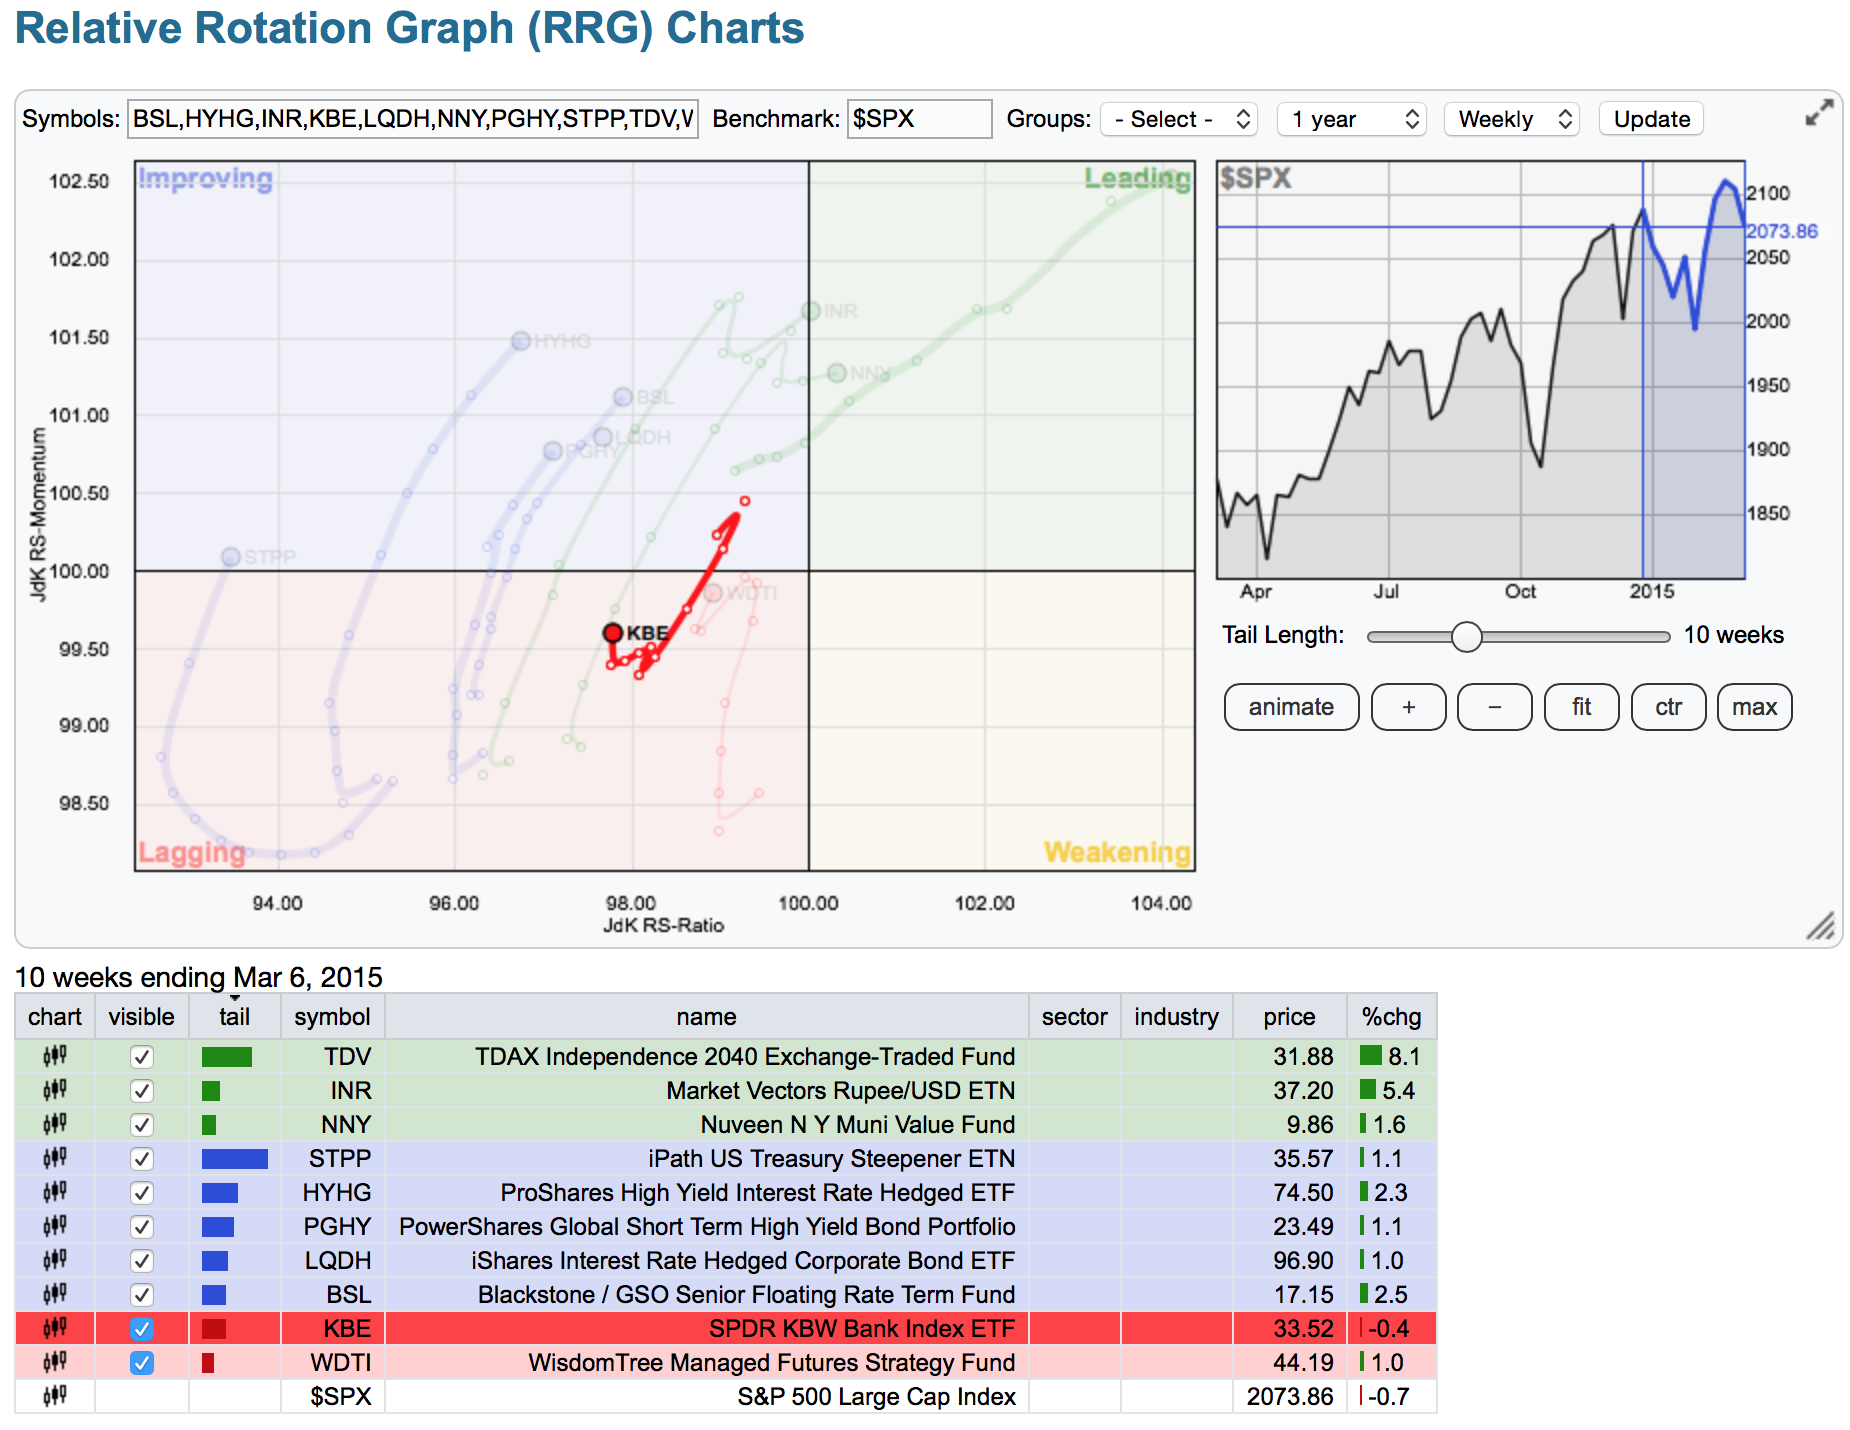
Don't Ignore This Chart! March 04, 2015 at 09:26 AM
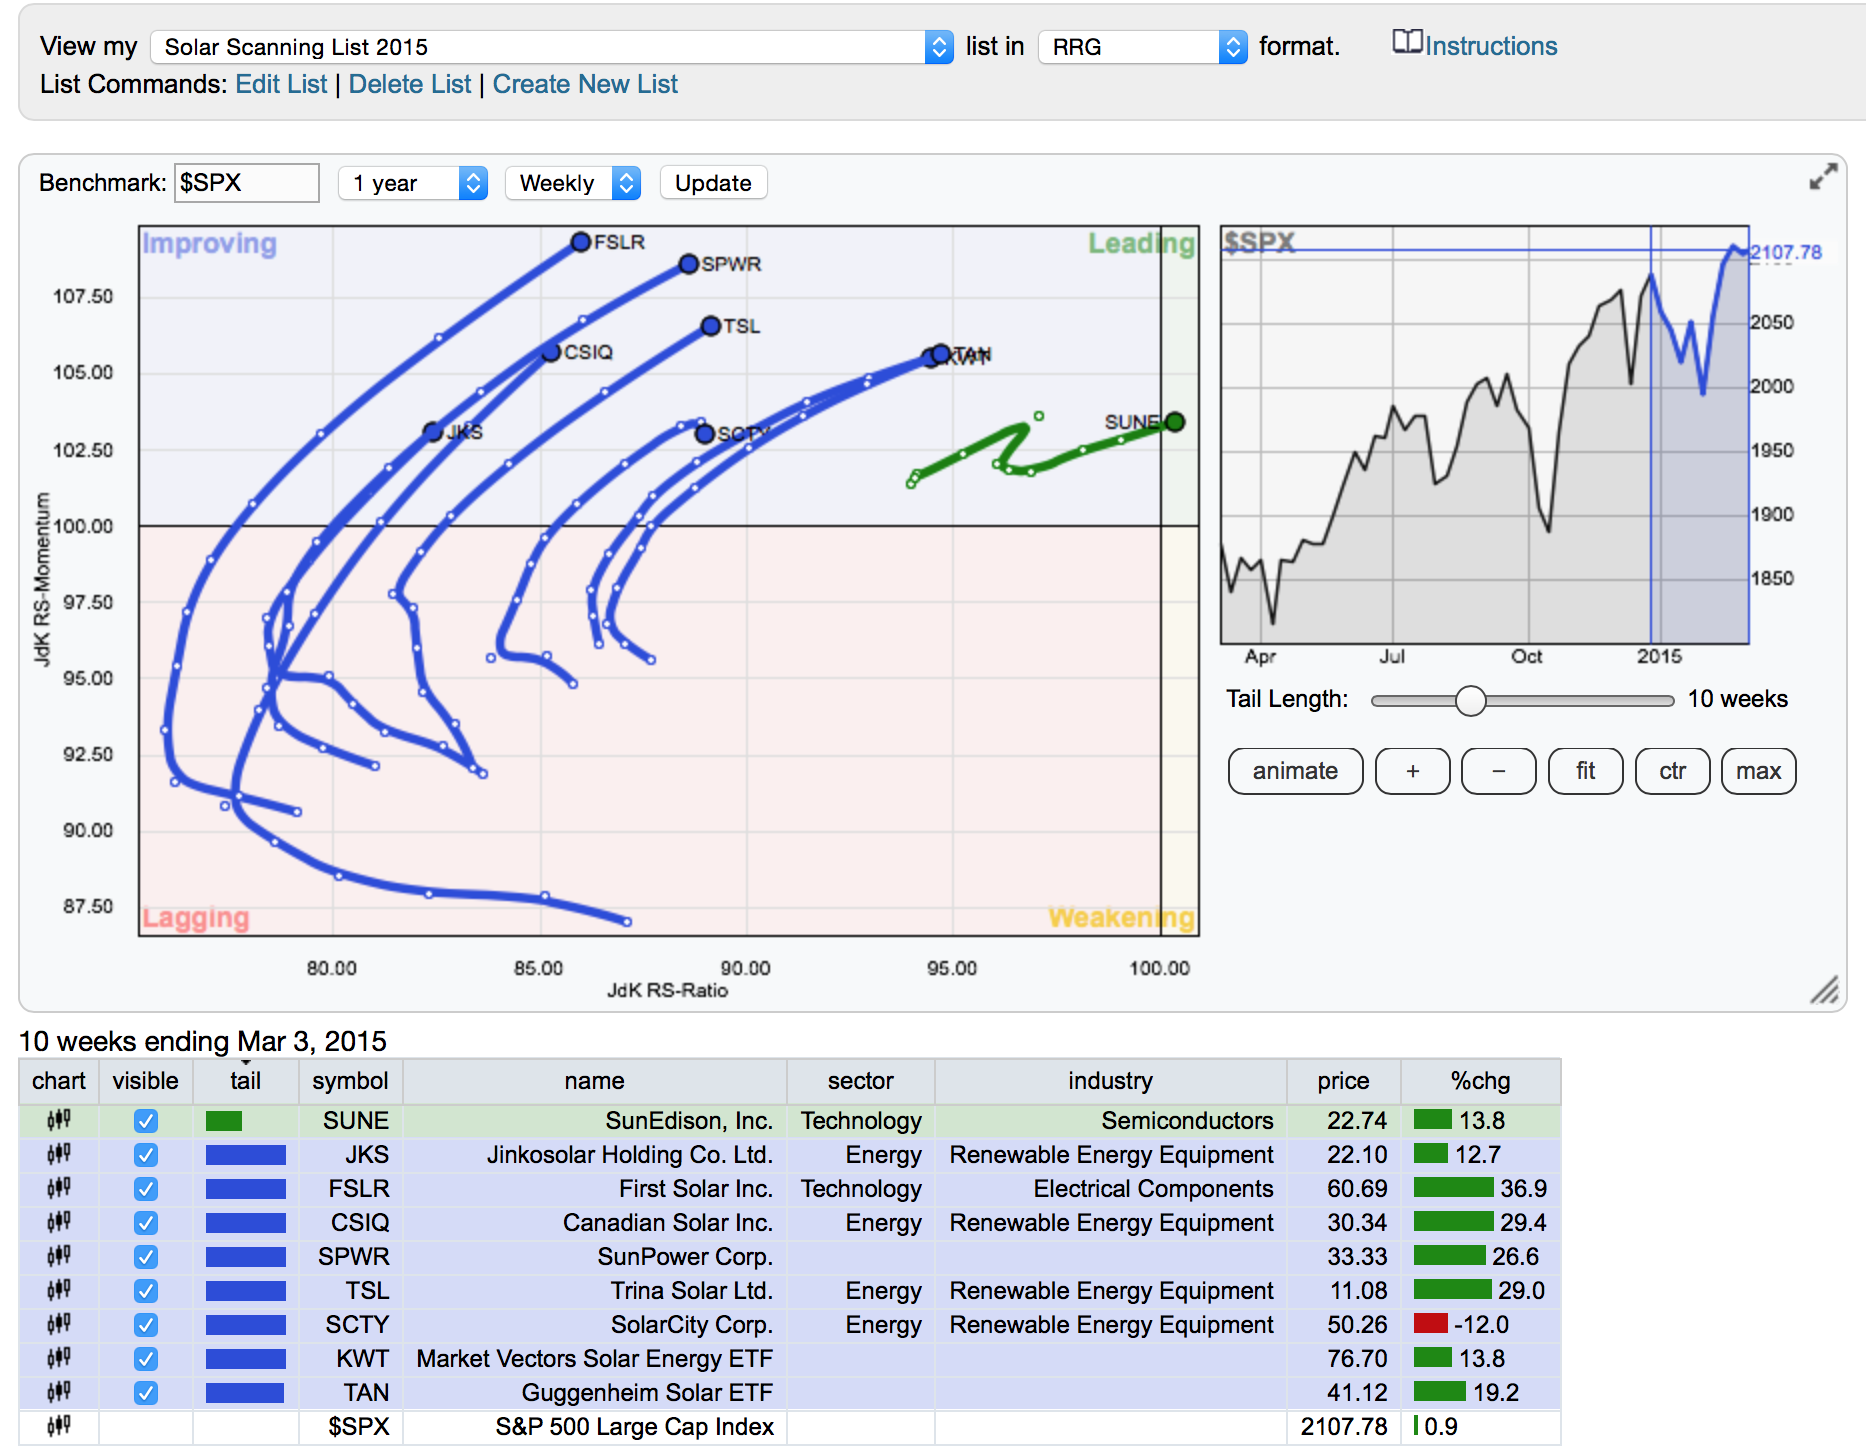
The RRG charts were introduced to StockCharts.com last year. They create such an interesting view of the markets. In December, we talked about the solar stocks being pulled back on the back of lower crude prices... Read More
Don't Ignore This Chart! March 03, 2015 at 11:03 AM
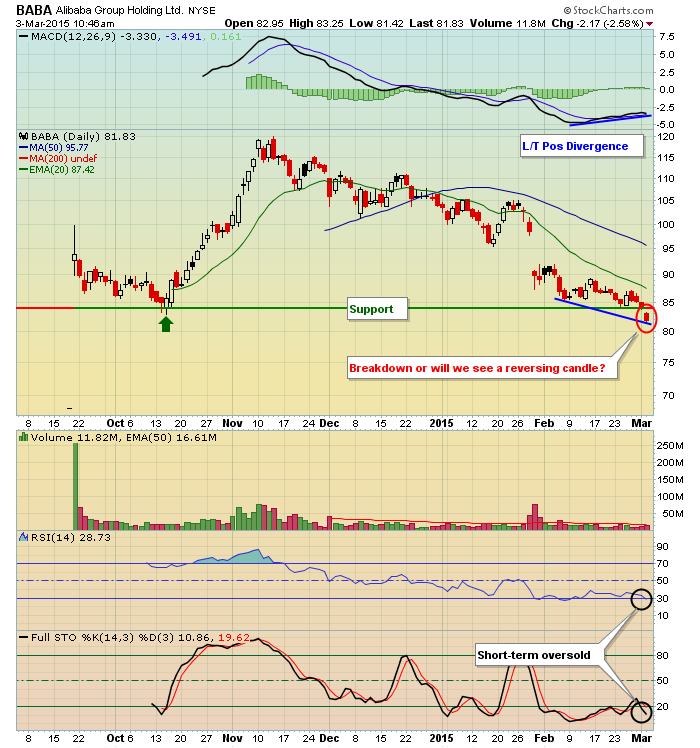
On Monday, BABA closed at 84.00, its lowest close since its IPO in September. However, that close was very close to support and BABA is currently oversold with its RSI below 30 and its stochastic reading at 11... Read More
Don't Ignore This Chart! March 02, 2015 at 03:02 PM
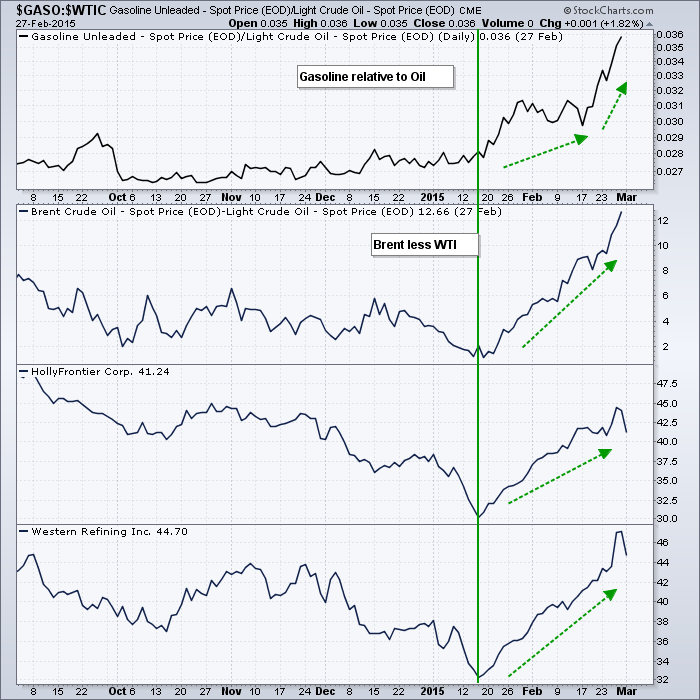
WTI Crude ($WTIC) remains relatively subdued, but Brent ($BRENT) and Gasoline ($GASO) have been moving higher the last several weeks. The top chart shows gasoline relative to crude using a ratio plot ($GASO:$WTIC), and the second chart shows the BRENT-WTI spread ($BRENT-$WTIC)... Read More