Don't Ignore This Chart! May 31, 2015 at 06:18 PM
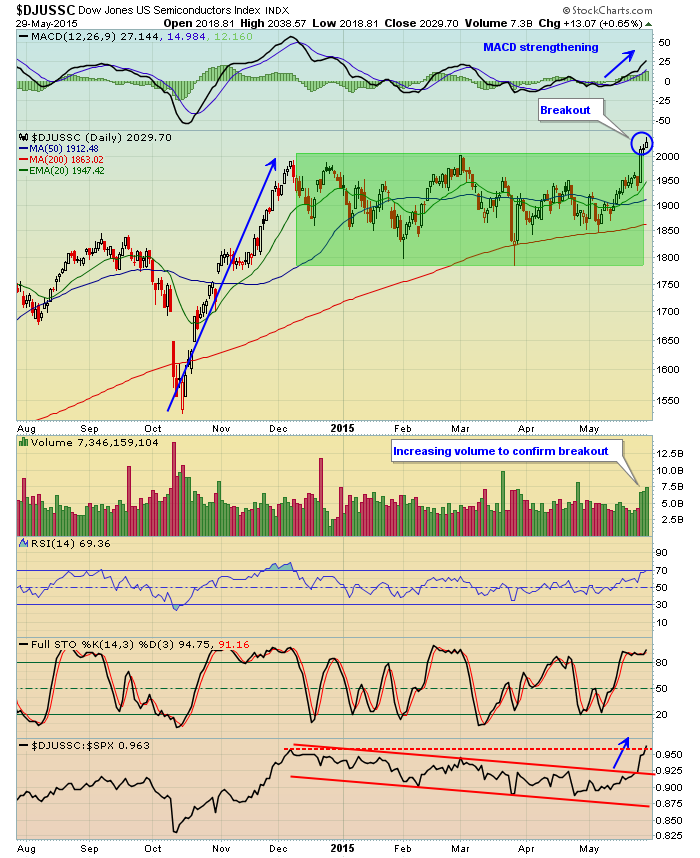
Just a couple days after finally clearing two month resistance at 1950, the Dow Jones U.S. Semiconductor Index closed above 2000 for the first time in 14 years late last week... Read More
Don't Ignore This Chart! May 29, 2015 at 10:46 AM
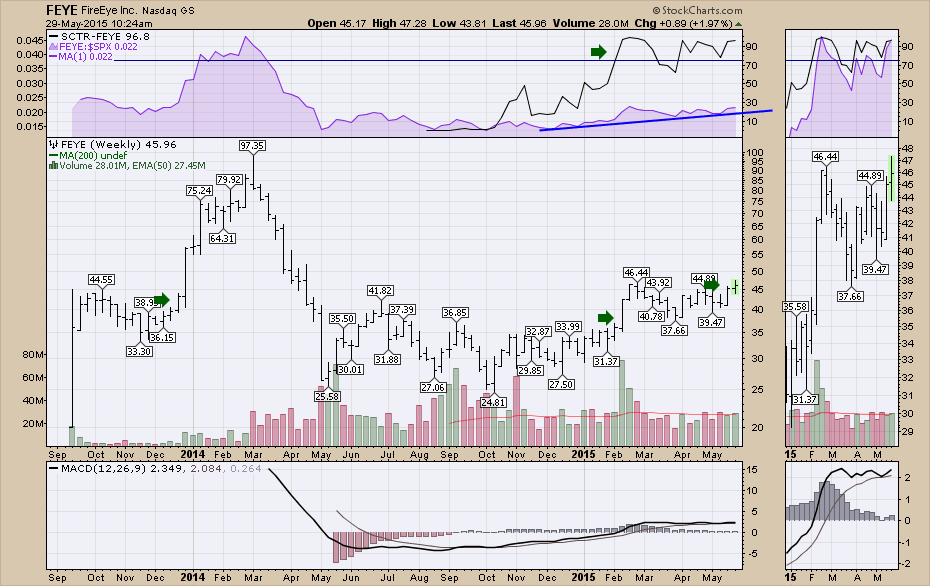
FireEye (FEYE) has been a stormy stock. It launched onto the exchange with an IPO price of $20, but the opening week doubled. After a massive first week, the stock tried to find a level between $33 and $44. The next three months built a consolidation pattern in that range... Read More
Don't Ignore This Chart! May 28, 2015 at 09:24 AM
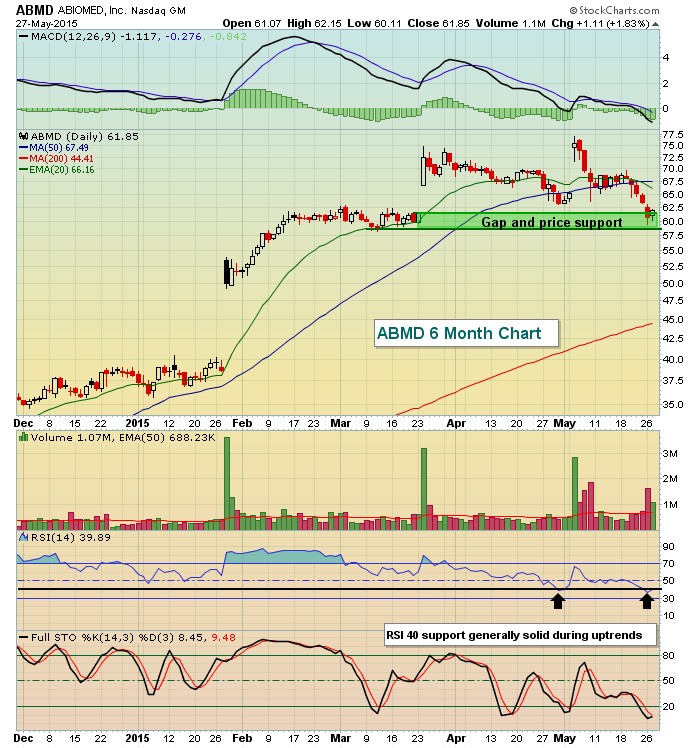
ABIOMED (ABMD) has fallen much of the past three weeks after surging on better-than-expected quarterly earnings results on May 5th. ABMD posted revenues of 67.56 million in its latest quarter, easily surpassing Wall Street forecasts of 62.33 million... Read More
Don't Ignore This Chart! May 27, 2015 at 10:27 AM
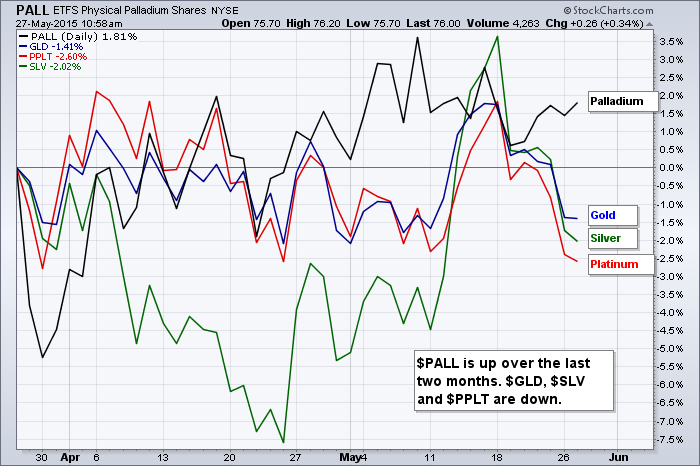
The Palladium ETF (PALL) caught my eye on Tuesday because it held up quite well when other metals were getting hit hard. Gold was down around 1.5%, while platinum and silver fell around 2%. PALL was down just .26% and the ETF is edging higher in early trading on Wednesday... Read More
Don't Ignore This Chart! May 26, 2015 at 07:59 PM
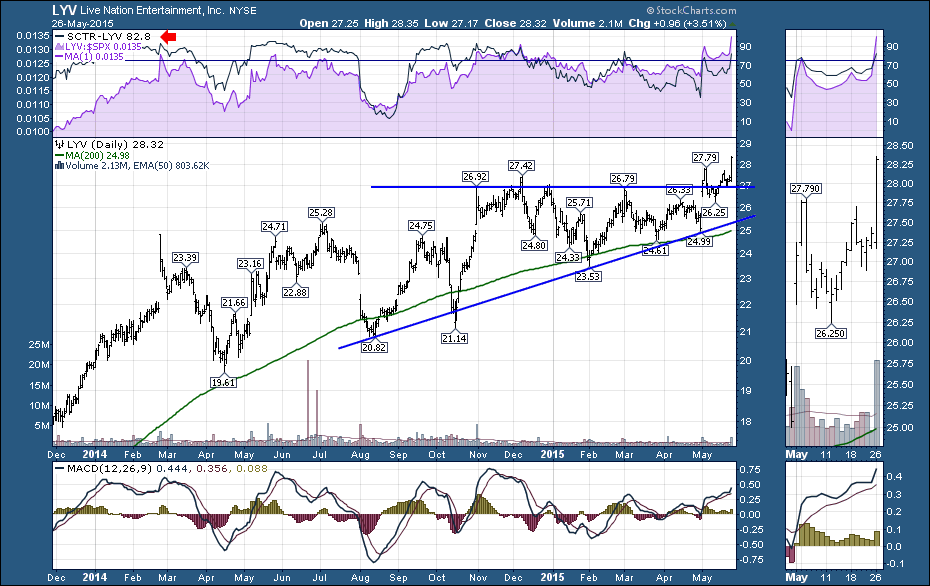
Live Nation (LYV) is the premier ticket booking system for concerts with website properties like Ticketmaster. Today, Live Nation broke to new all time highs. This chart looks bullish making new highs while the overall market was down 1%. That's a nice show of strength... Read More
Don't Ignore This Chart! May 22, 2015 at 10:10 AM
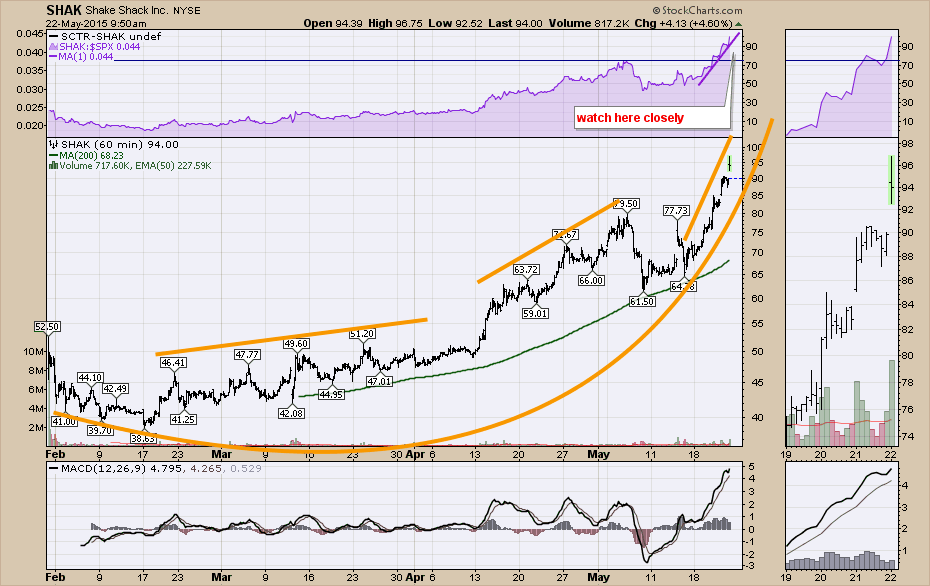
Every now and then a new stock comes into the market that appeals to a wider audience that just regular investors. Recently Shake Shack (SHAK) went public as a burger joint with some seriously good management behind it... Read More
Don't Ignore This Chart! May 21, 2015 at 02:12 PM
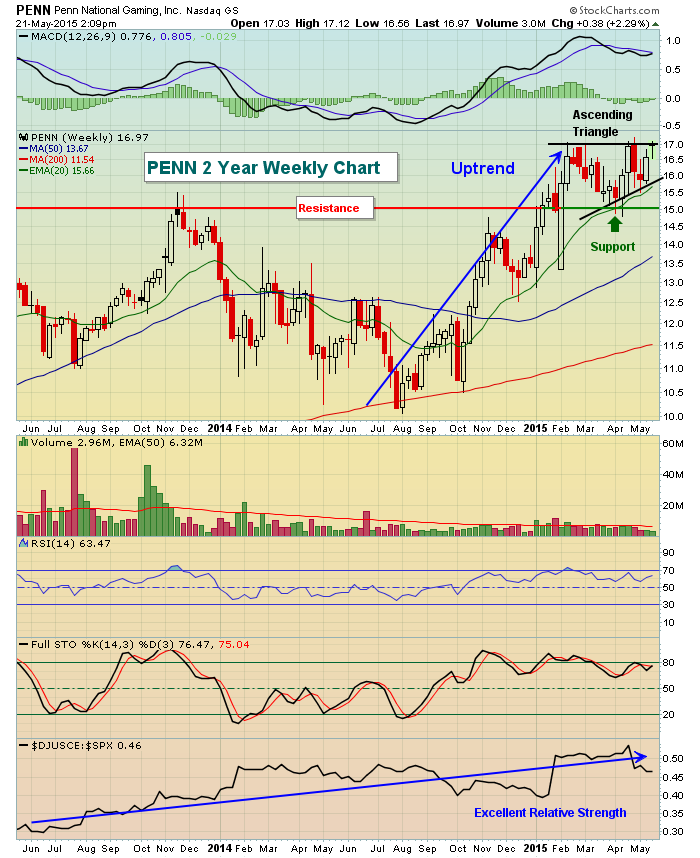
The Dow Jones U.S. Gambling Index ($DJUSCA) has been under pressure for quite some time with many gambling stocks under pressure as well... Read More
Don't Ignore This Chart! May 20, 2015 at 05:54 AM
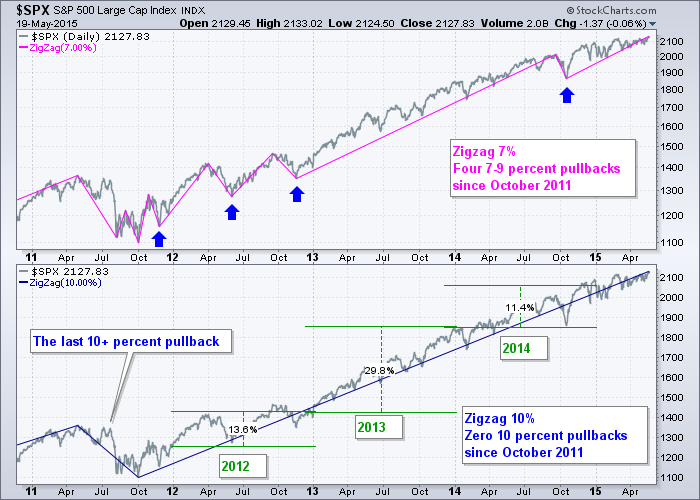
The S&P 500 is in the midst of one of the strongest and most consistent trends ever. The chart below shows the S&P 500 twice. The top window shows the index with a 7% Zigzag indicator in pink and the bottom window shows a 10% Zigzag... Read More
Don't Ignore This Chart! May 19, 2015 at 09:58 AM
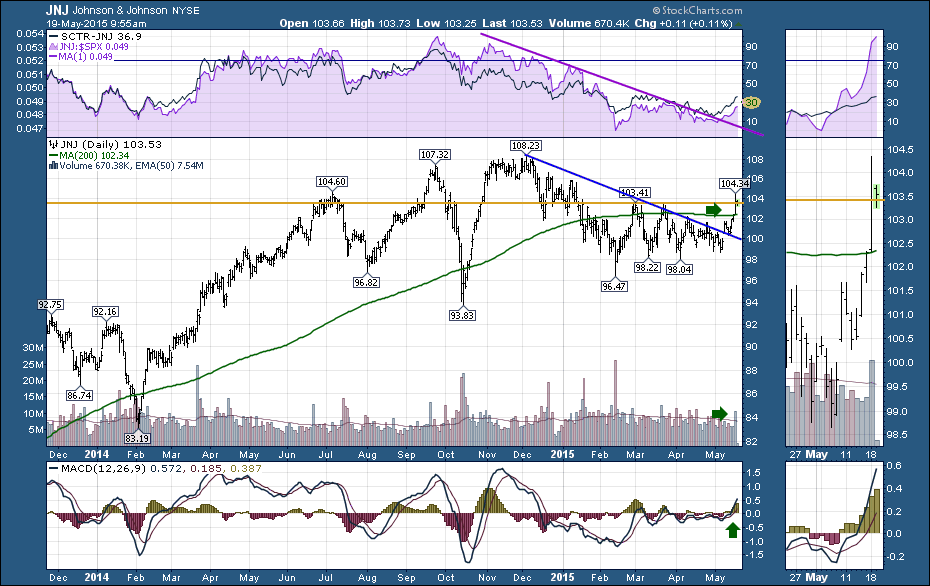
Johnson & Johnson (JNJ) had a great day on Monday. However, on the chart, JNJ had some meaningful technical signals. Starting at the top in purple, The relative strength is turning to the upside after being in a downward trend. It is at 1 month highs and the ... Read More
Don't Ignore This Chart! May 18, 2015 at 03:19 PM
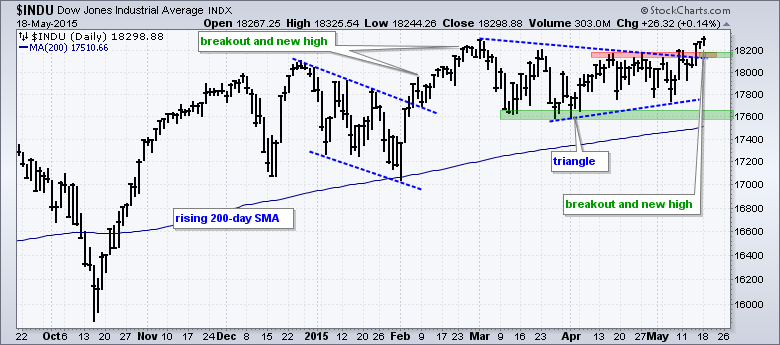
The S&P 500 hit a new high last week and the Dow Industrials followed suit with a new high this week. Overall, the Dow broke triangle resistance with a surge on Thursday and this breakout signals a continuation of the current uptrend... Read More
Don't Ignore This Chart! May 15, 2015 at 11:07 AM

On Thursday, Deere and Co. (DE) pushed to new highs. But the equipment could not hold the breakout and rolled over swiftly falling hard today. Deere is sitting at a critical point on the chart... Read More
Don't Ignore This Chart! May 13, 2015 at 02:34 PM
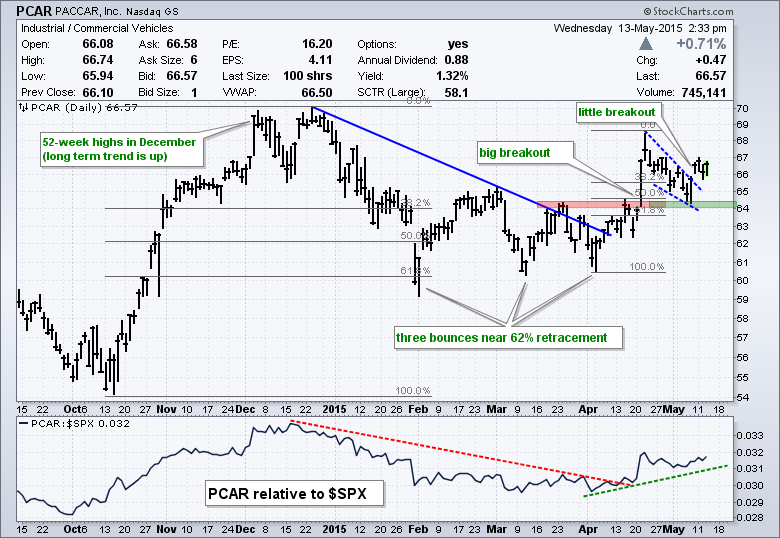
Paccar (PCAR) sports a bullish looking chart with two breakouts in as many months. The stock surged from October to December and then corrected with a decline that retraced 62%. After three bounces off the 62% retracement area, the stock broke out with a surge in mid-April... Read More
Don't Ignore This Chart! May 12, 2015 at 11:27 AM
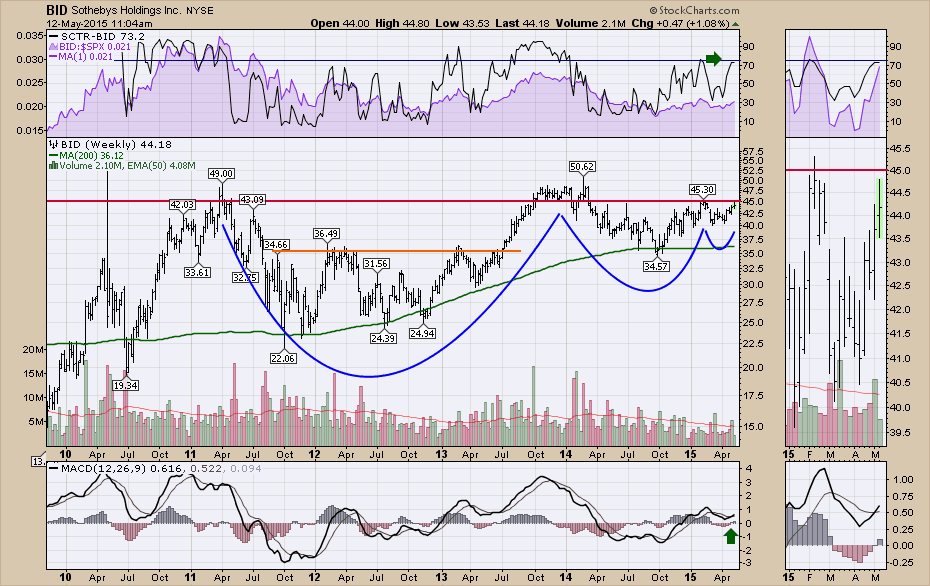
The art world is abuzz with Picasso's Women of Algiers selling for $179.3 Million where the commissions to Christie's were 12% or $19.3 Million! That all wraps up as a selling price of $160 Million... Read More
Don't Ignore This Chart! May 11, 2015 at 05:28 PM
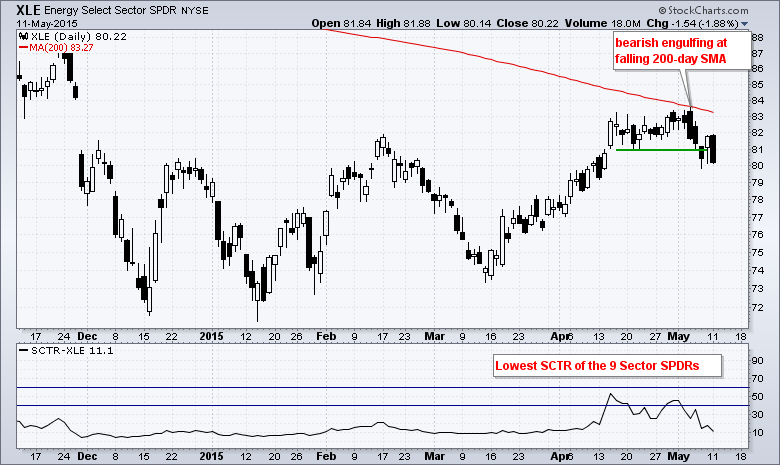
The Energy SPDR (XLE) is in a long-term downtrend and it looks like the short-term uptrend reversed over the last few days. The chart below shows XLE failing at the falling 200-day moving average with a bearish engulfing last week and breaking below short-term support at 81... Read More
Don't Ignore This Chart! May 08, 2015 at 11:47 AM
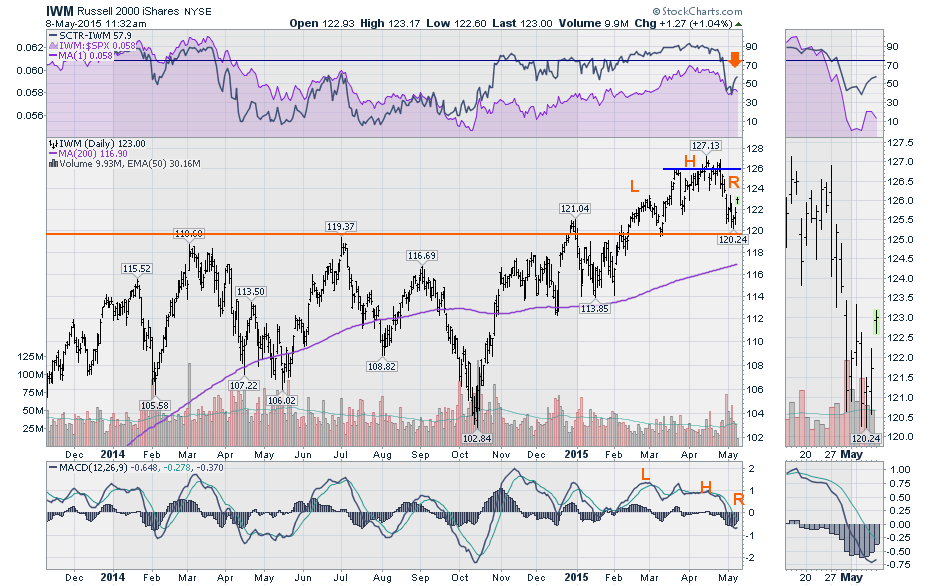
Recently the Russell 2000 was outperforming the $SPX. Early in April, it stopped out-performing as you can see on the purple ratio. As the Russell Tracking ETF (IWM) hit new highs, it was underperforming the $SPX as the purple area drifted lower... Read More
Don't Ignore This Chart! May 07, 2015 at 11:50 AM
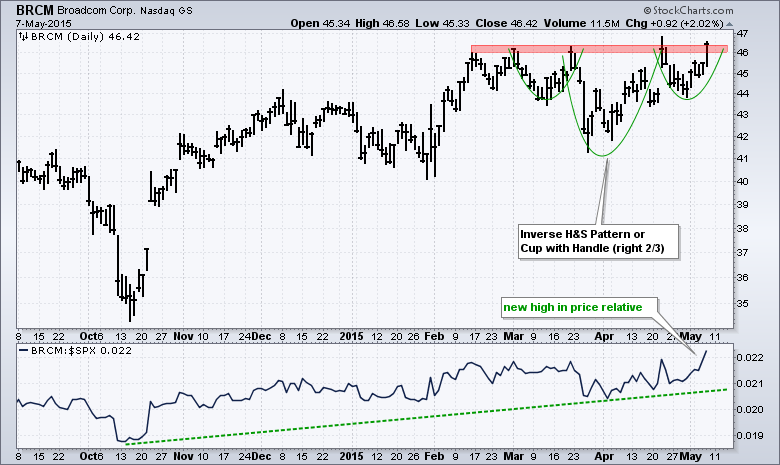
It has been a rough month for stocks overall, but Broadcom (BRCM) is bucking the selling pressure and challenging resistance. There are two bullish continuation patterns possible on this chart. First, an inverse head-and-shoulders pattern extends back to early March... Read More
Don't Ignore This Chart! May 06, 2015 at 03:58 PM
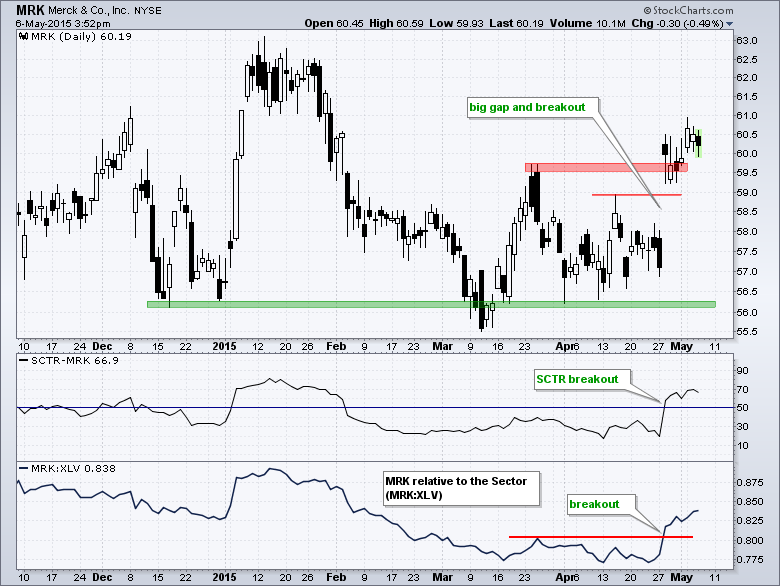
Stocks have been under pressure the last eight days with the S&P 500 SPDR (SPY) down around 2% from its late April high and the HealthCare SPDR (XLV) down around 4% from this high... Read More
Don't Ignore This Chart! May 05, 2015 at 05:14 PM
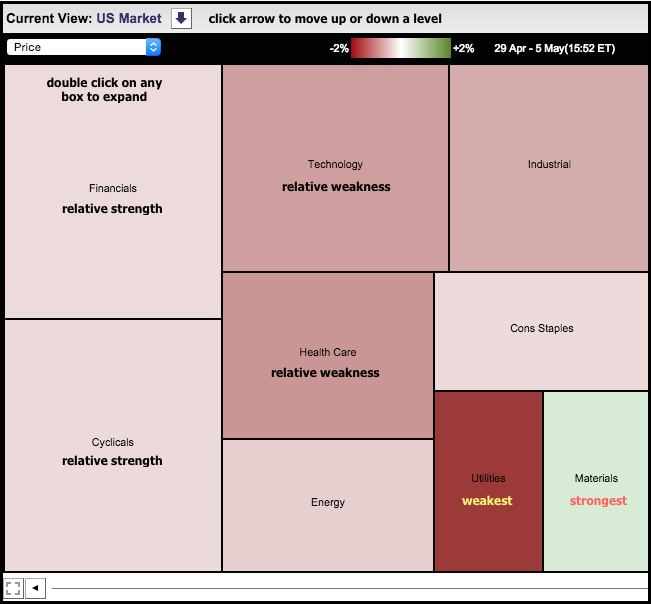
The chart below shows the Sector MarketCarpet over the last five days (29-Apr to 5-May) and utility stocks are the weakest. The average stock in the sector is down over 2% during this timeframe, which is why the box is dark red... Read More