Don't Ignore This Chart! June 30, 2017 at 10:20 AM
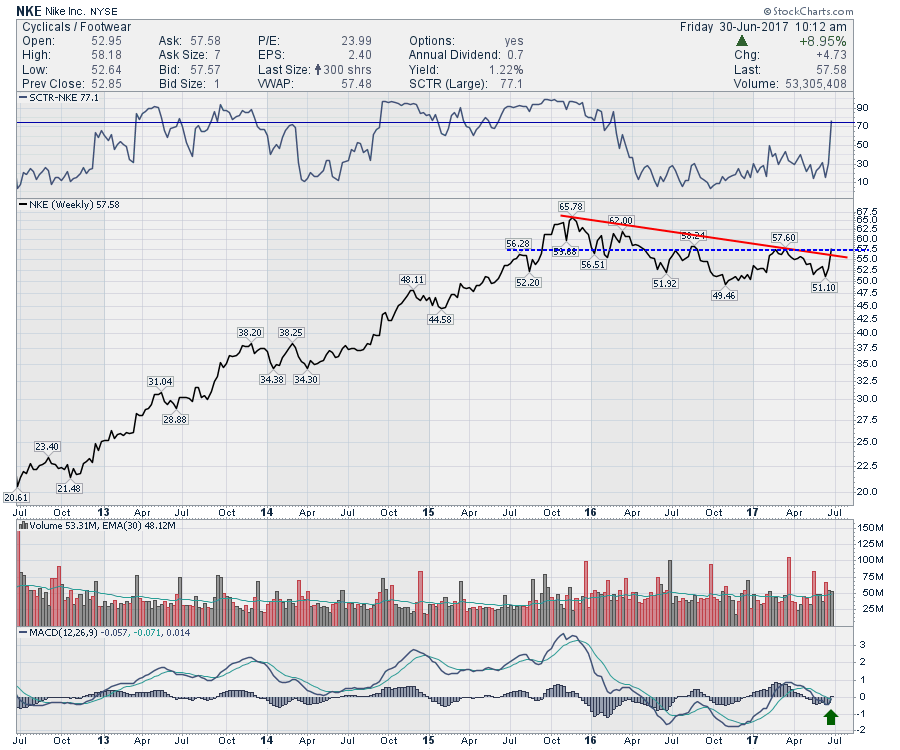
Nike (NKE) popped up 8% this morning on earnings right at the mid point of the year. Nike accelerated straight up for 3 years before topping in 2015. After retracing 20%, the stock tried to climb and it looks like its working to take the lead... Read More
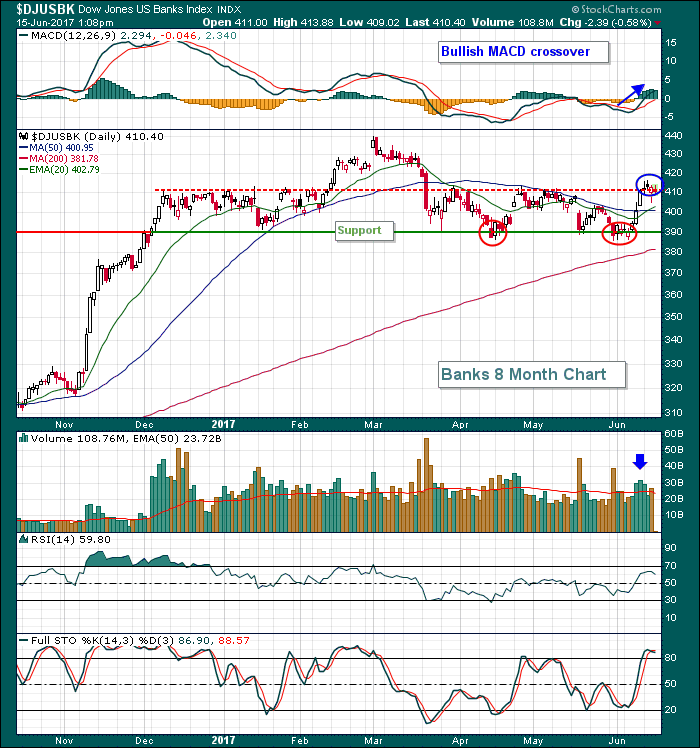
Don't Ignore This Chart! June 29, 2017 at 09:45 AM
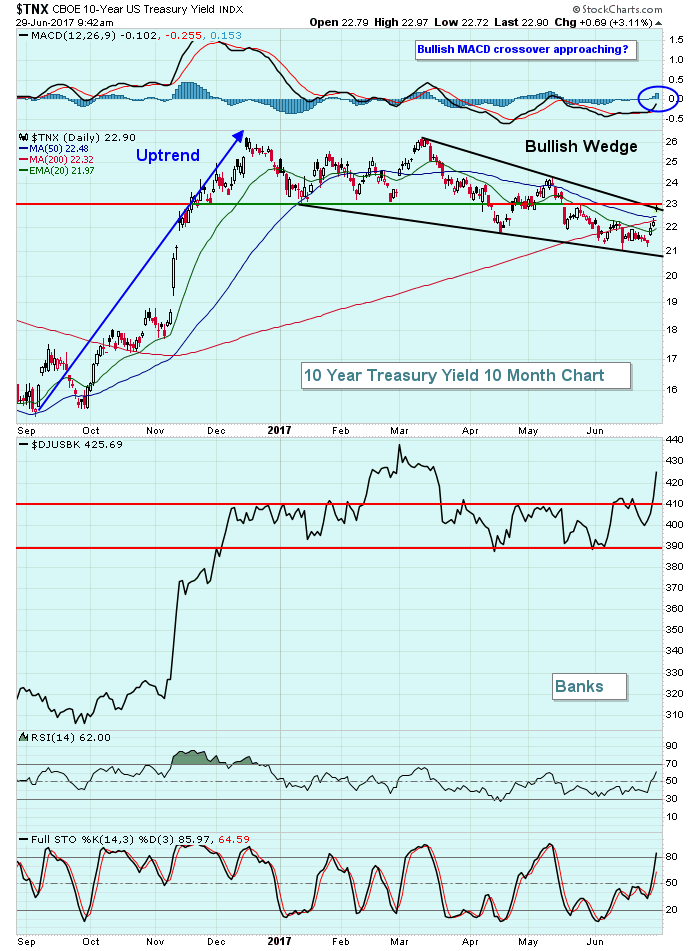
The stubbornness of treasury buyers has kept a lid on treasury yields and, as a result, banks ($DJUSBK) have struggled to determine which direction they should move. Well.....this morning's reaction to an upwardly-revised GDP number (TNX up 7 basis points to 2... Read More
Don't Ignore This Chart! June 28, 2017 at 12:09 PM
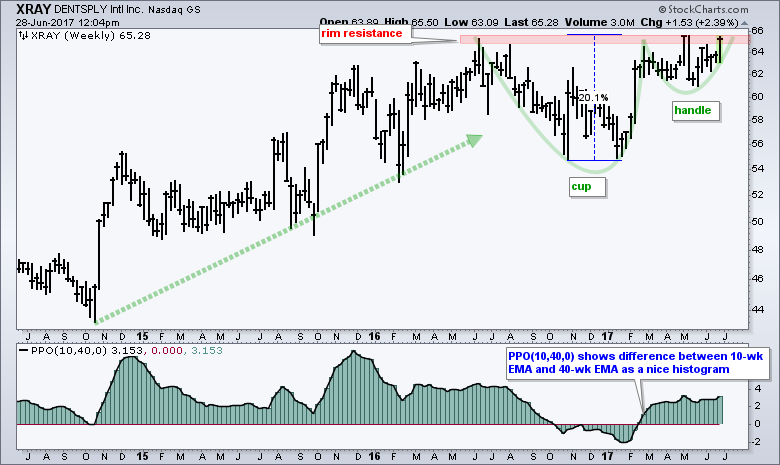
Dentsply International (XRAY) has a large cup-with-handle pattern forming over the last twelve months and the stock is on the verge of breaking rim resistance. Popularized by William O'Neil of Investors Business Daily, the cup-with-handle is a bullish continuation pattern... Read More
Don't Ignore This Chart! June 28, 2017 at 12:16 AM
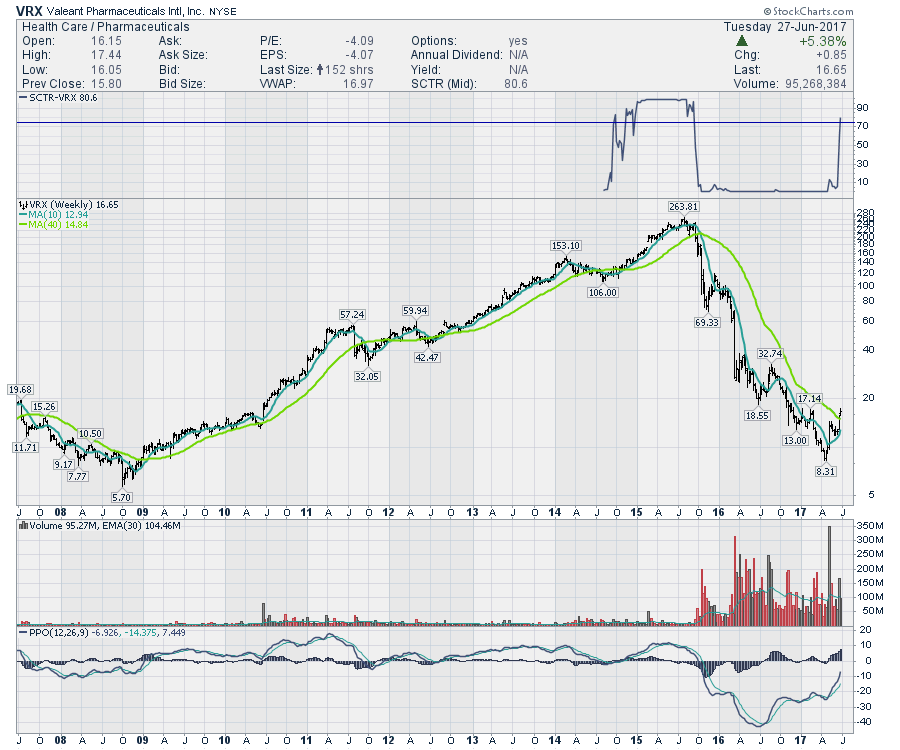
Valeant (VRX) investors watched their stock top out 2 years. Anyone still holding the stock from back then needs a return of 100's of % to get back to where they once were. Frustrated investors sold VRX to claim their capital losses... Read More
Don't Ignore This Chart! June 26, 2017 at 11:14 AM
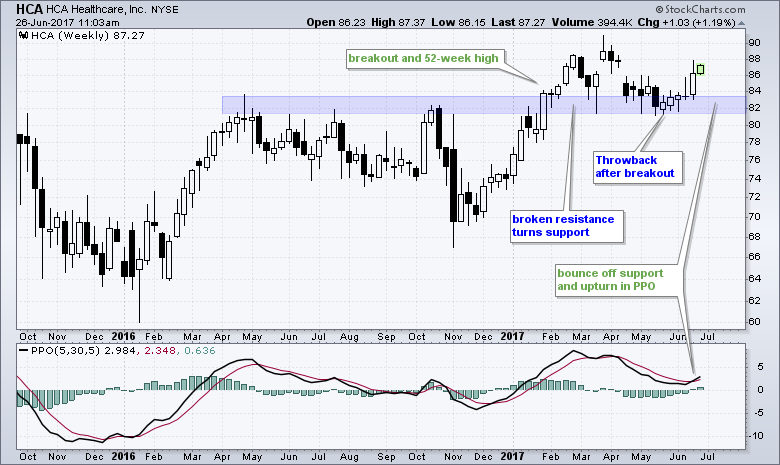
HCA Healthcare (HCA) is turning up at a key level and showing signs that the long-term uptrend is resuming. HCA is in a long-term uptrend because it broke out in January and recorded a 52-week high... Read More
Don't Ignore This Chart! June 25, 2017 at 01:37 PM
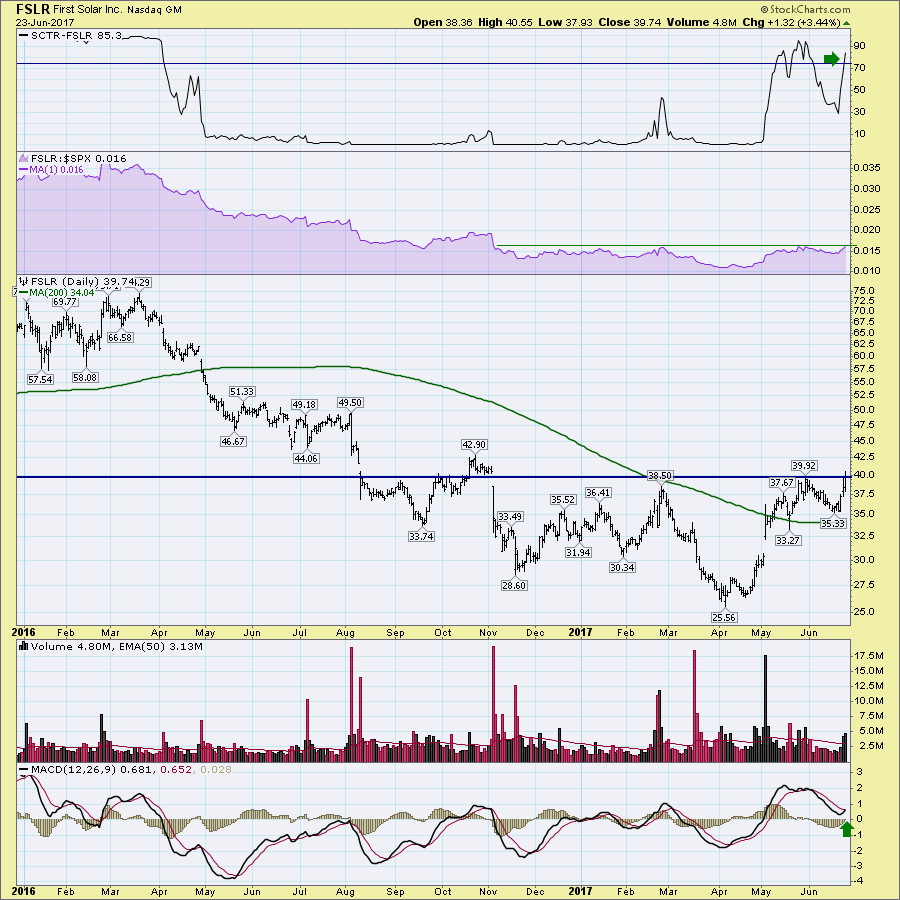
First Solar (FSLR) has been down and out for a while. The SCTR ranking has been below 10 for a long time. The SCTR started to surge in early May but fell back. This week it kicked back up to 85. With Friday's high close, FSLR is starting to generate some price power... Read More
Don't Ignore This Chart! June 24, 2017 at 03:21 PM
Biotechnology stocks ($DJUSBT) were the second best performing industry group last week, trailing on renewable energy ($DWCREE). Both groups appear poised to continue their rally based on their longer-term weekly technical outlook... Read More
Don't Ignore This Chart! June 22, 2017 at 04:36 PM
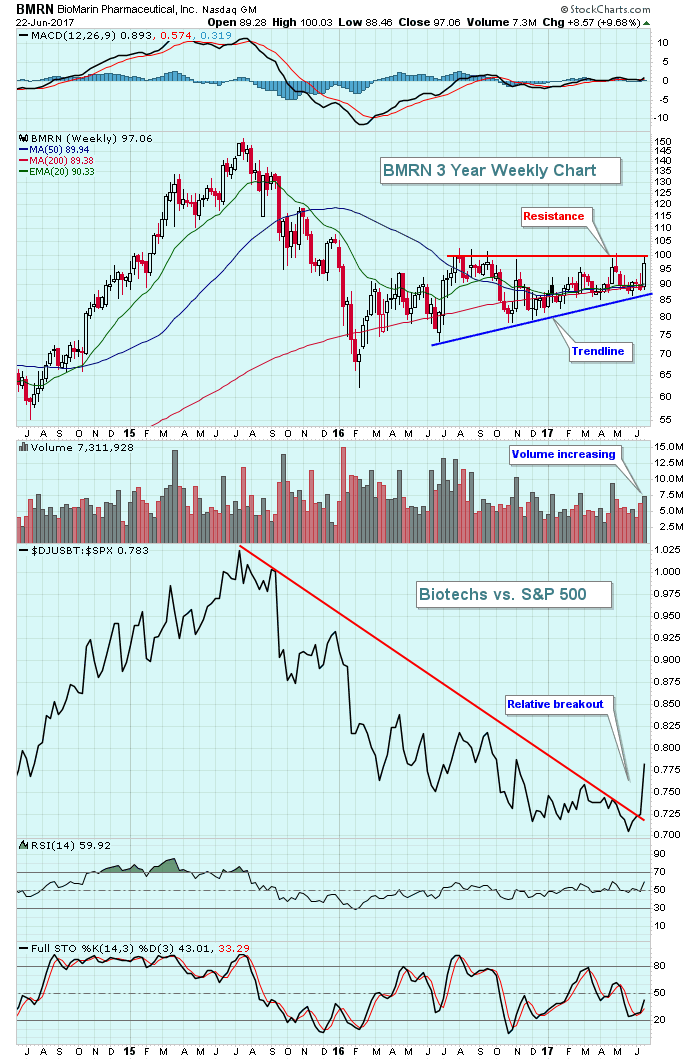
BioMarin Pharmaceutical (BMRN), like the overall biotech industry ($DJUSBT), has struggled for the past 18 months to clear overhead price resistance... Read More
Don't Ignore This Chart! June 21, 2017 at 11:43 AM
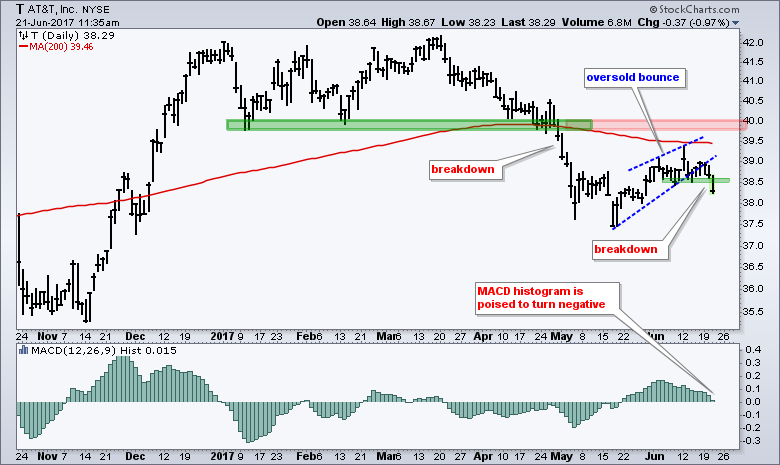
Despite a strong stock market in 2017, AT&T ($T) is having a tough time with a breakdown in early May and a sharp decline below the 200-day SMA. The stock rebounded after a double-digit decline with a bounce back to the 200-day SMA, which is now falling... Read More
Don't Ignore This Chart! June 21, 2017 at 12:44 AM
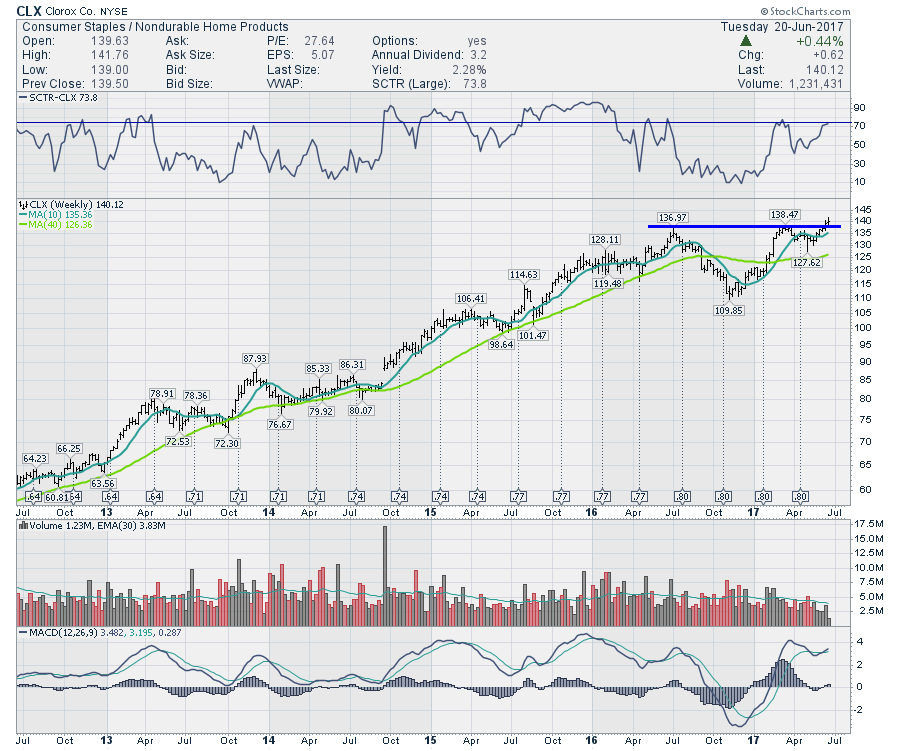
Clorox (CLX) is a big Consumer Staples company showing off a new 52-week high this week. The breakout jumps above a 2016 top and a high touched in March 2017... Read More
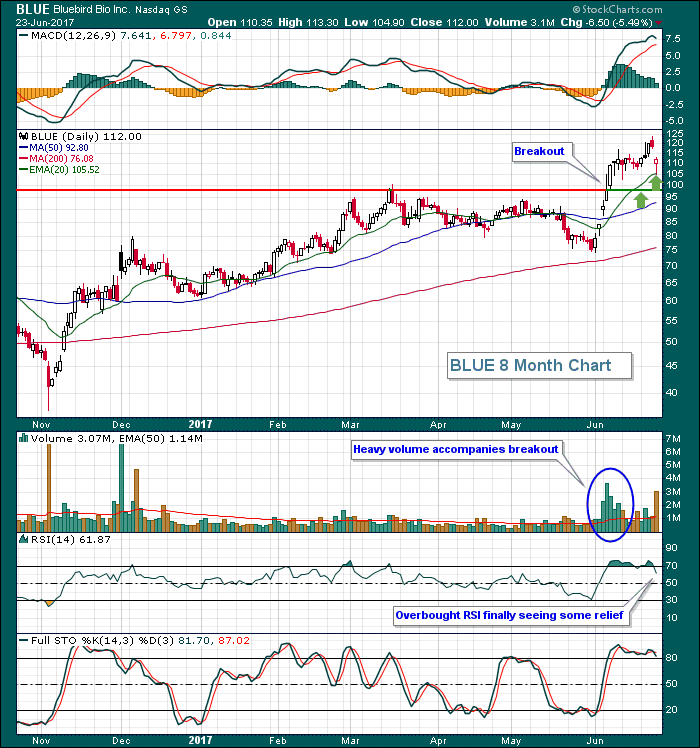
Don't Ignore This Chart! June 19, 2017 at 11:08 AM
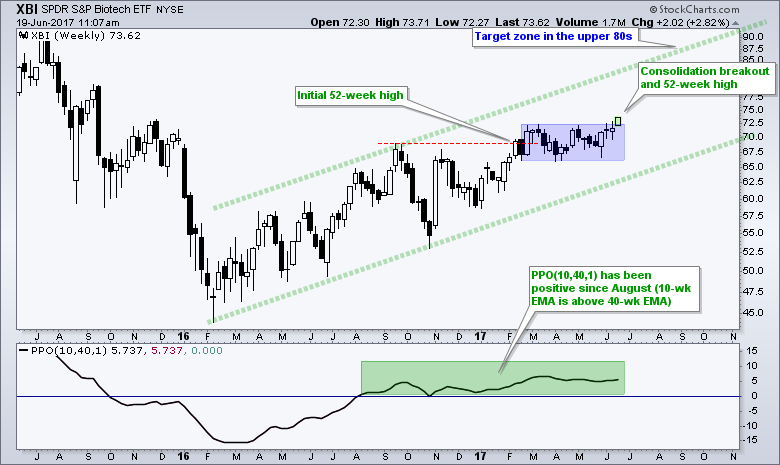
The Biotech SPDR (XBI) is starting to lead the market again with a consolidation breakout and 52-week high. The chart shows the ETF hitting an initial 52-week high in February and then consolidating for four months... Read More
Don't Ignore This Chart! June 18, 2017 at 10:20 AM
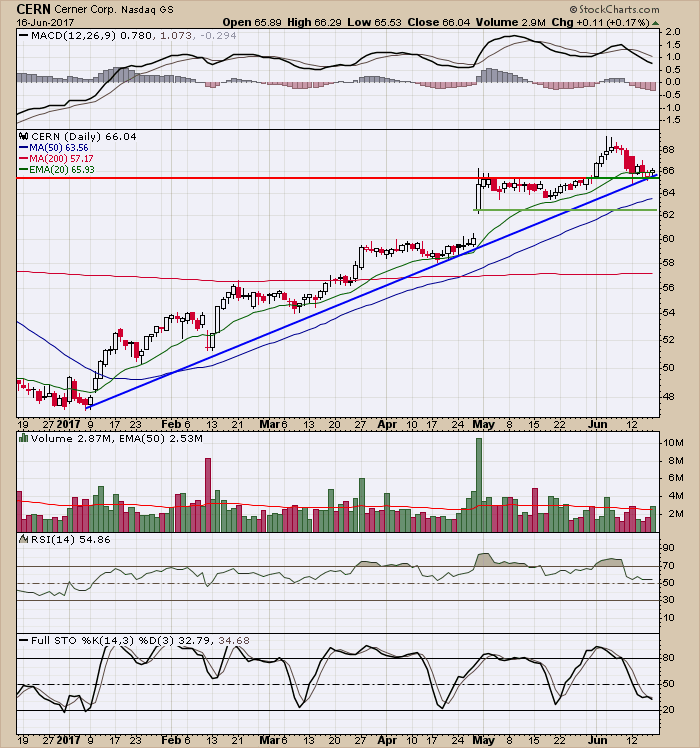
It's always nice to go back to the basics of technical analysis. Broken resistance becomes support. That's currently the case with Cerner Corp (CERN) where the stock recently cleared price resistance just above 65... Read More
Don't Ignore This Chart! June 16, 2017 at 10:18 AM
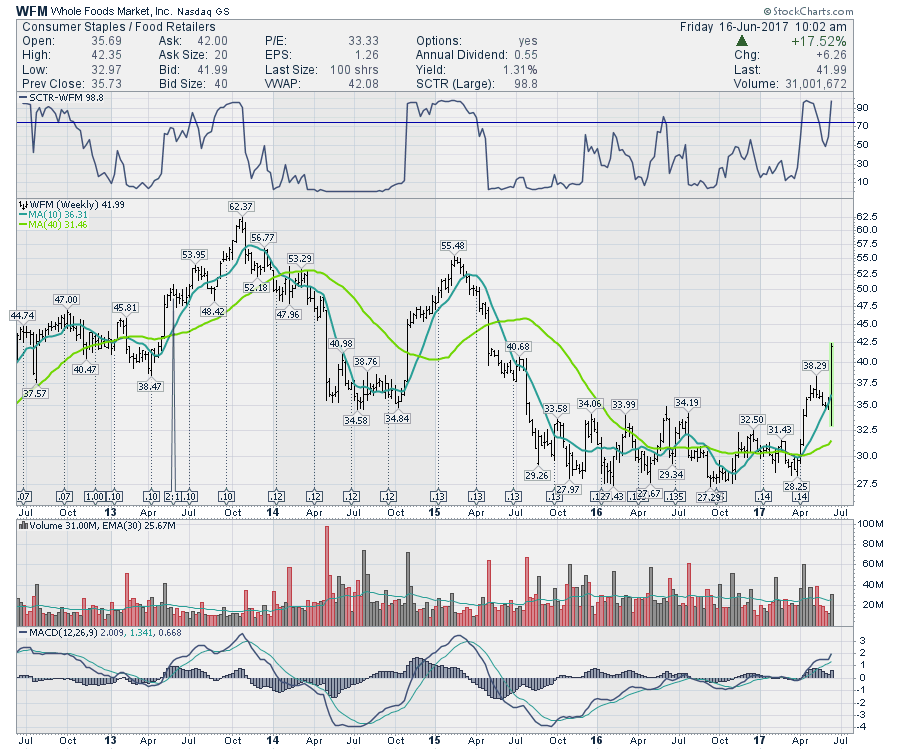
Amazon (AMZN) stepped up and bought shares of Whole Foods (WFM) for $13.7 B. While Whole Foods shareholders saw some relief from the prolonged pain of holding the stock, the rest of the industry group plummeted on the news... Read More
Don't Ignore This Chart! June 15, 2017 at 01:12 PM
One look at the 10 year treasury yield's ($TNX) decline the past several months provides proof that the bond market isn't exactly agreeing with the Federal Reserve's stated position that they see economic improvement in the months ahead... Read More
Don't Ignore This Chart! June 14, 2017 at 12:11 PM
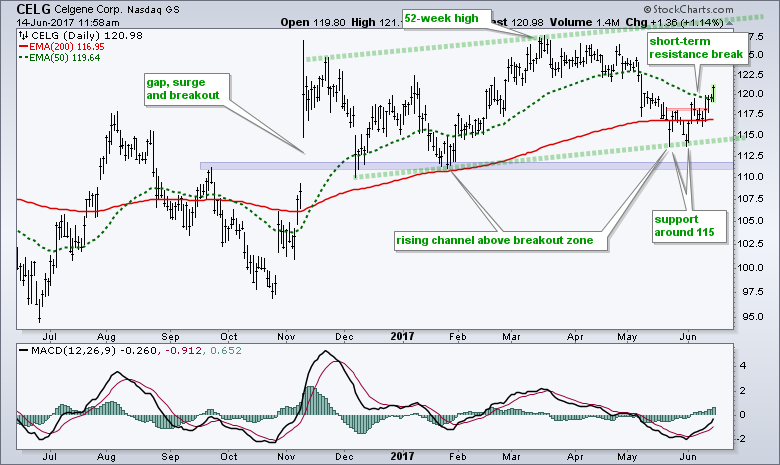
Celgene (CELG) is a large biotech stock that is part of the Biotech iShares (IBB) and the Biotech SPDR (XBI). Overall, I would suggest that the long-term trend is up because the stock hit a 52-week high in mid-March and the 50-day EMA is above the rising 200-day EMA... Read More
Don't Ignore This Chart! June 13, 2017 at 11:42 PM
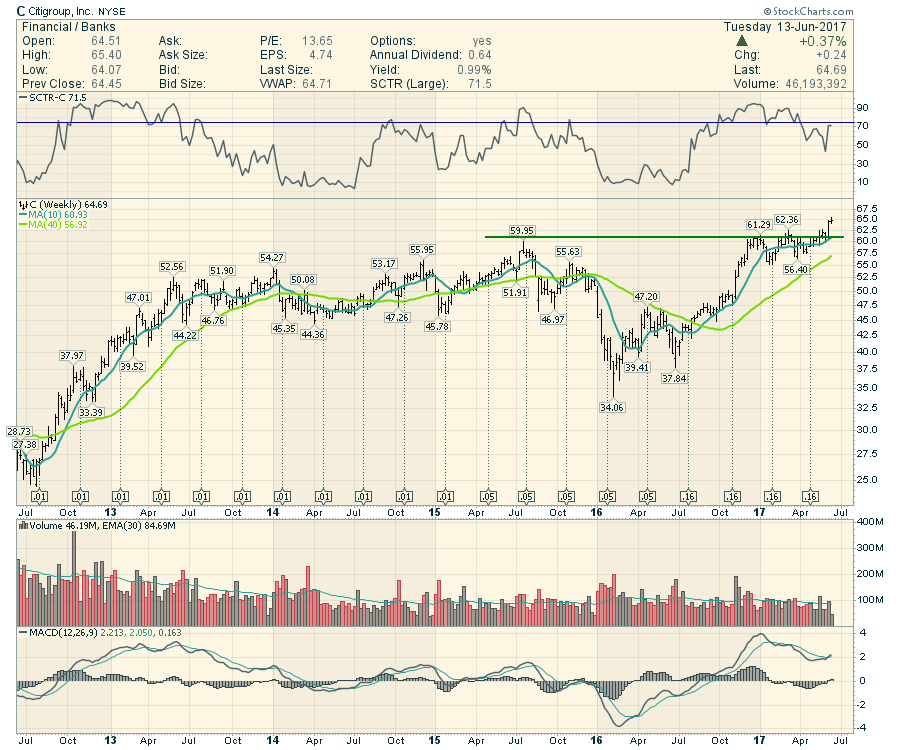
Citi (C) rallied last week to push to new highs. This week, Citi is holding up with the Fed meeting tomorrow. The SCTR is close to moving into the top performing area above 75... Read More
Don't Ignore This Chart! June 12, 2017 at 11:32 AM
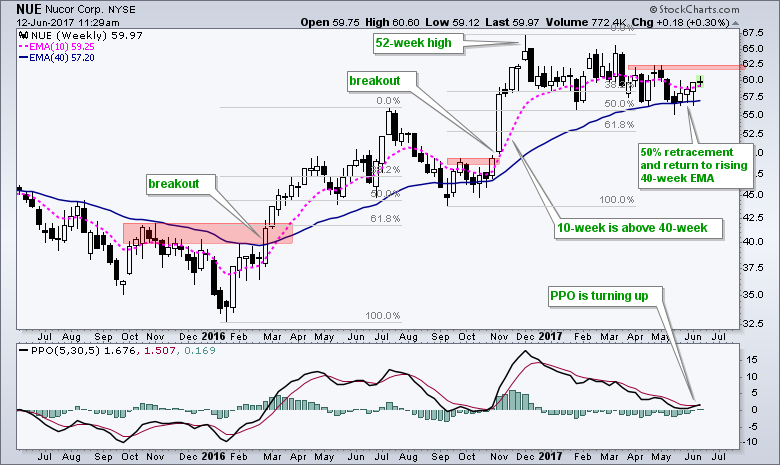
Nucor (NUE) is flat year-to-date and lagging the S&P 500, but the bigger trend is up and short-term momentum is turning up... Read More
Don't Ignore This Chart! June 11, 2017 at 10:42 AM
If you're someone that finds great investments among the high SCTR (StockCharts Technical Rank) stocks, you probably enjoy better than average returns most of the time. However, Friday was not one of those times... Read More
Don't Ignore This Chart! June 10, 2017 at 01:01 PM
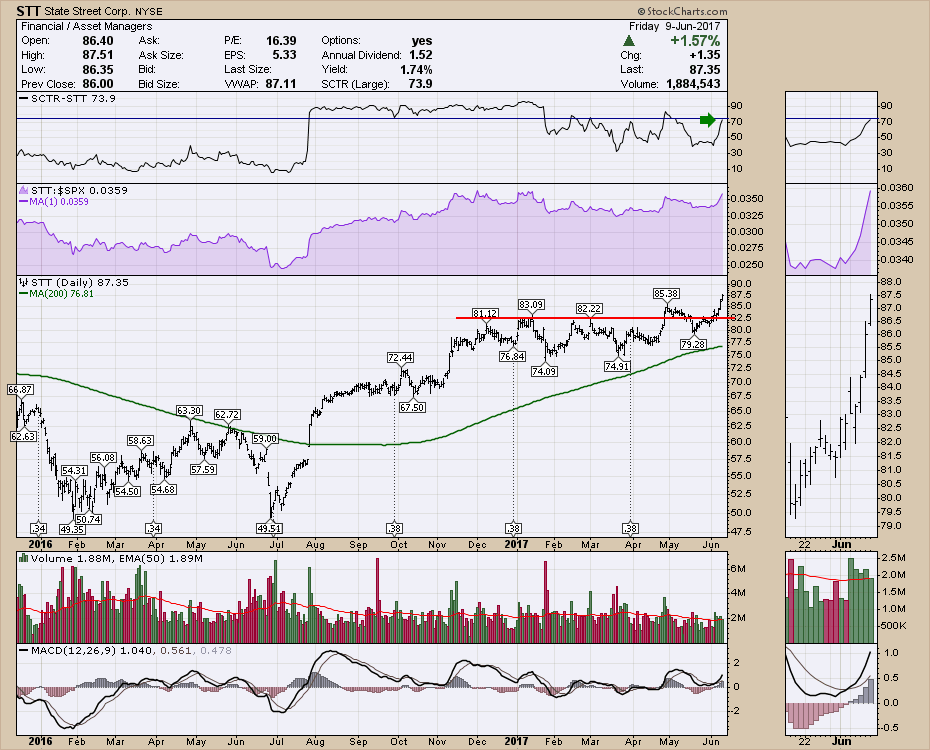
State Street (STT) turned up to new highs this week with a stronger consolidation pattern than the big banks have shown. State Street did not drop down to test the lows recently and still has not tested the 200 DMA which most of the bank stocks have been doing... Read More
Don't Ignore This Chart! June 08, 2017 at 09:20 PM
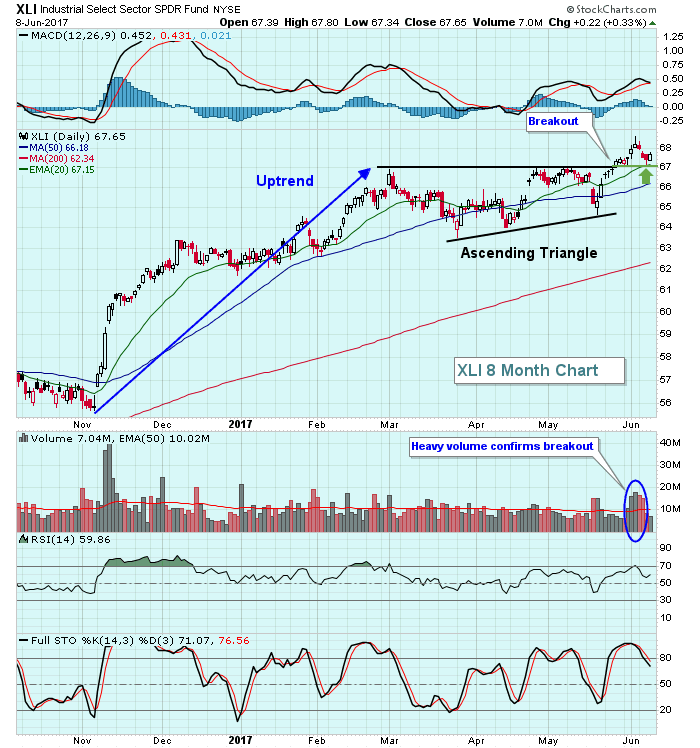
Over the past week, it's been about an even split among sectors in terms of winners and losers. Industrials (XLI) is one sector that's been slightly lower over the past week, but technically things still look very bright in this space... Read More
Don't Ignore This Chart! June 07, 2017 at 11:43 AM
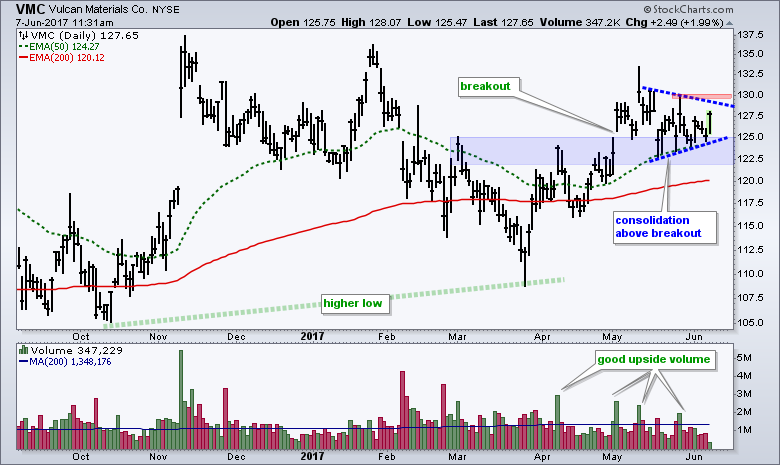
After struggling the first three months of the year, Vulcan Materials (VMC) is showing signs of life since late March with good upside volume and a breakout in early May. Notice that the stock broke above a resistance zone in the 122-125 area and this zone turns into support... Read More
Don't Ignore This Chart! June 06, 2017 at 05:52 PM
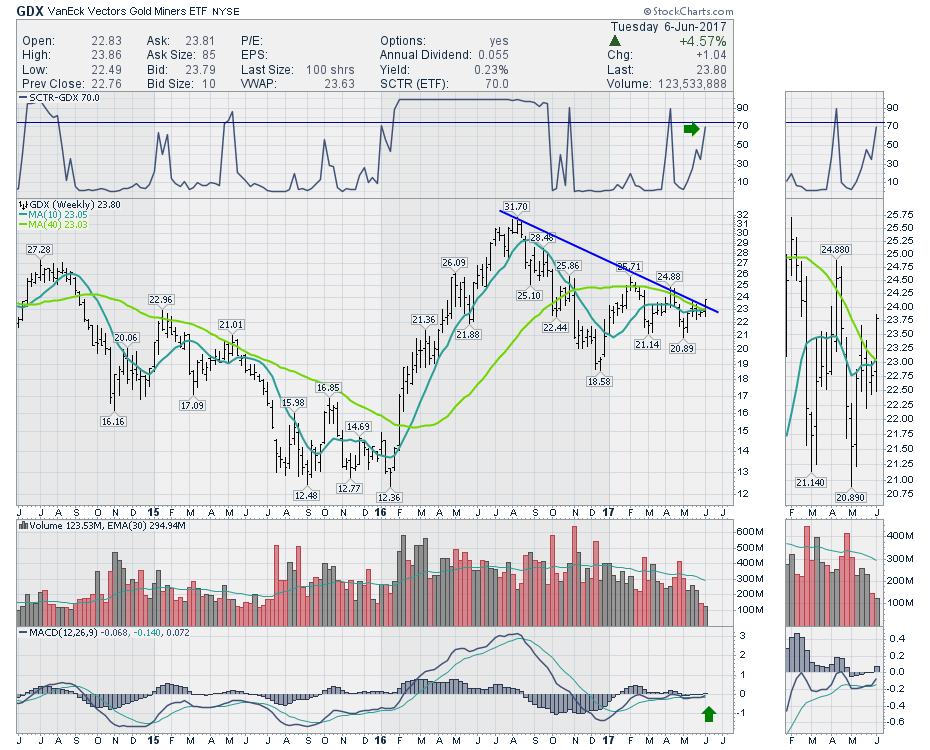
Investing in Commodities has been tough for the first 1/2 of 2017. Every rally was a false breakout and every opportunity seems to have dried up... Read More
Don't Ignore This Chart! June 05, 2017 at 10:56 AM
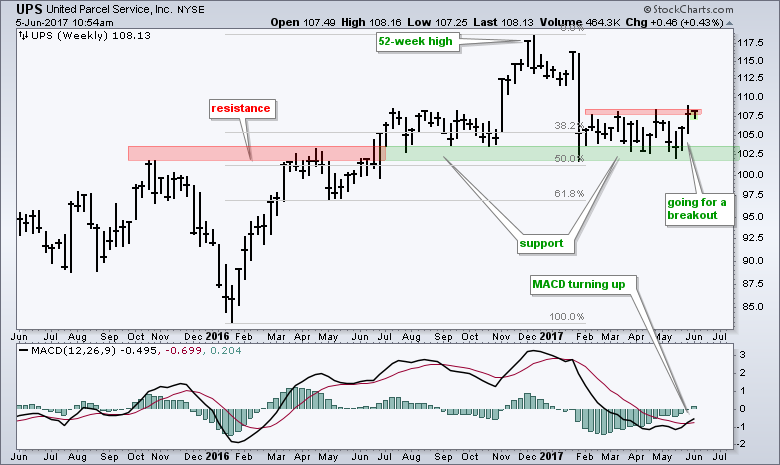
United Parcel Service (UPS) has been lagging the broader market this year, but may be turning around as it bounces off support and momentum turns up. UPS surged to a 52-week high in December and then retraced 50% with a sharp decline in January... Read More
Don't Ignore This Chart! June 04, 2017 at 05:58 PM
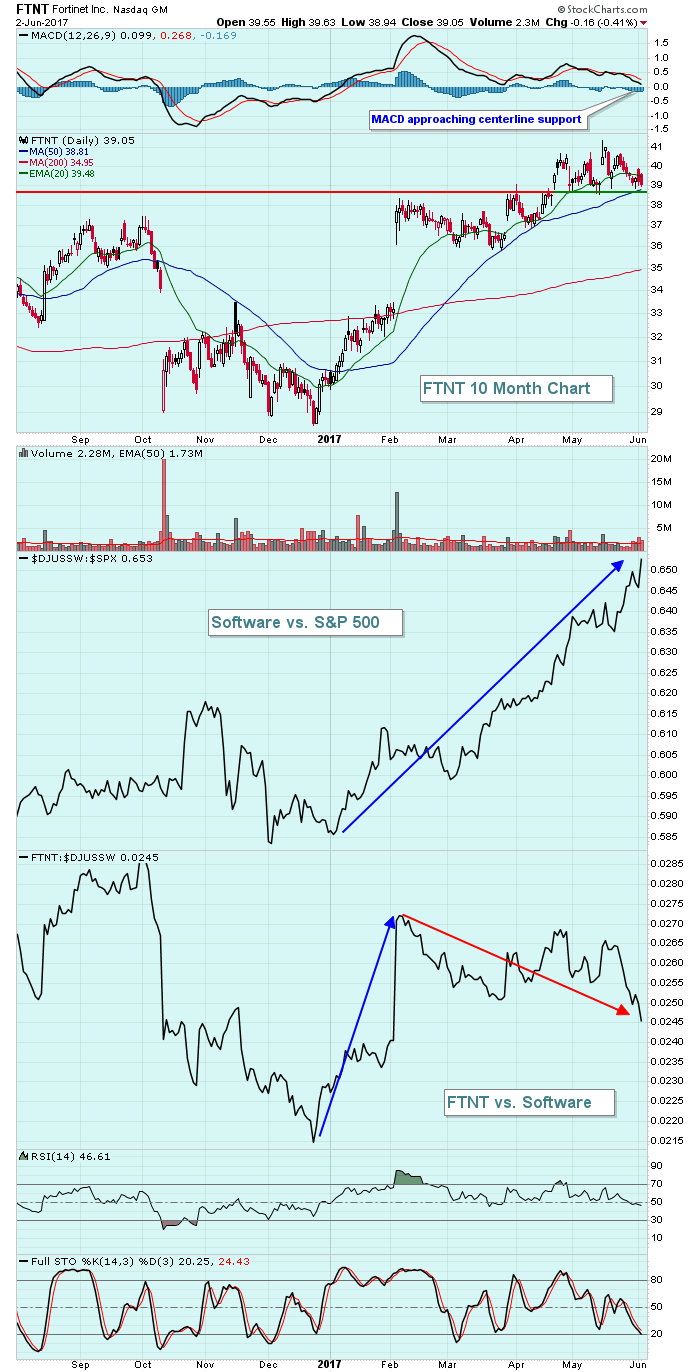
Fortinet (FTNT) is down roughly 5% from its recent price high as money rotates within the software industry ($DJUSSW). It's up close to 30% year-to-date, however, so a little profit taking in the short-term is likely providing an opportunity... Read More
Don't Ignore This Chart! June 02, 2017 at 01:30 PM
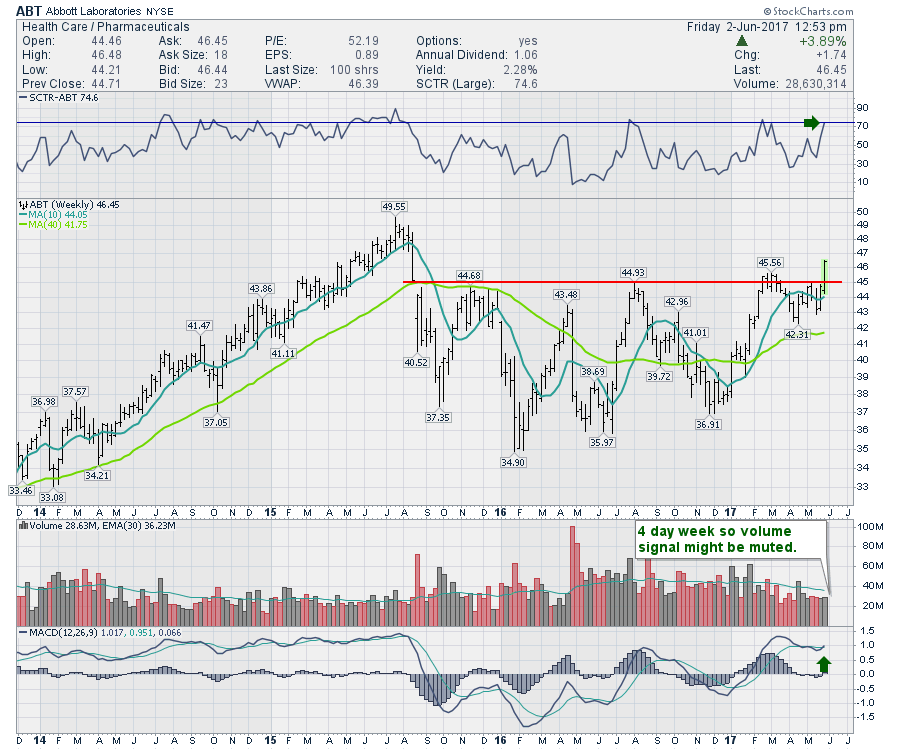
Abbott Labs (ABT) has been trapped under the $45 level for about 18 months. This week, the stock blew through the glass ceiling, cracking new highs. The recent breakout in late February was a cautionary signal the stock was trying to go higher... Read More
Don't Ignore This Chart! June 01, 2017 at 10:27 AM
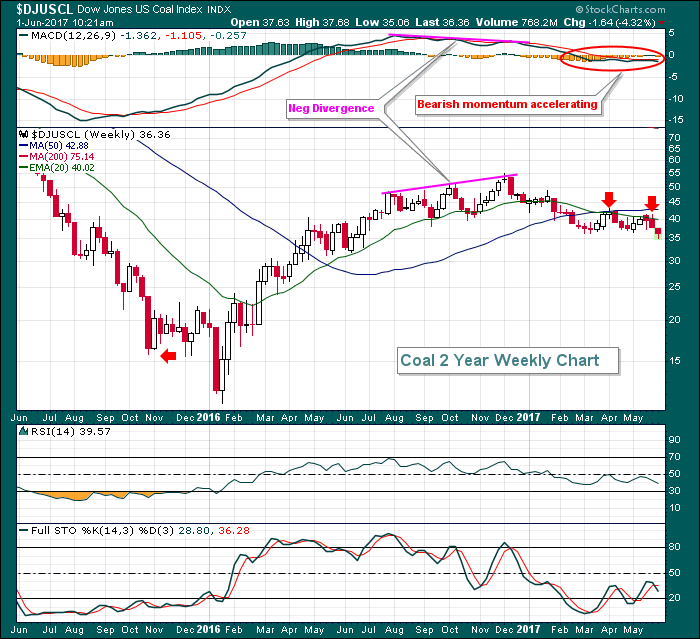
The Dow Jones U.S. Coal Index ($DJUSCL) spent 2016 bouncing from the ashes after a disastrous 2015 in which the DJUSCL lost 90% of its value. The "dead cat bounce" looks as though it may have ended as price action has rolled over and the weekly MACD has clearly turned bearish... Read More