
RRG ChartsNovember 14, 2014 at 06:23 AM
Wow...! What a difference a month makes .... I had lunch with Arthur Hill yesterday in Breda (the Netherlands) which is halfway where he lives in Belgium and where I live in the Netherlands (Amsterdam)...Read More
RRG ChartsNovember 03, 2014 at 05:25 PM
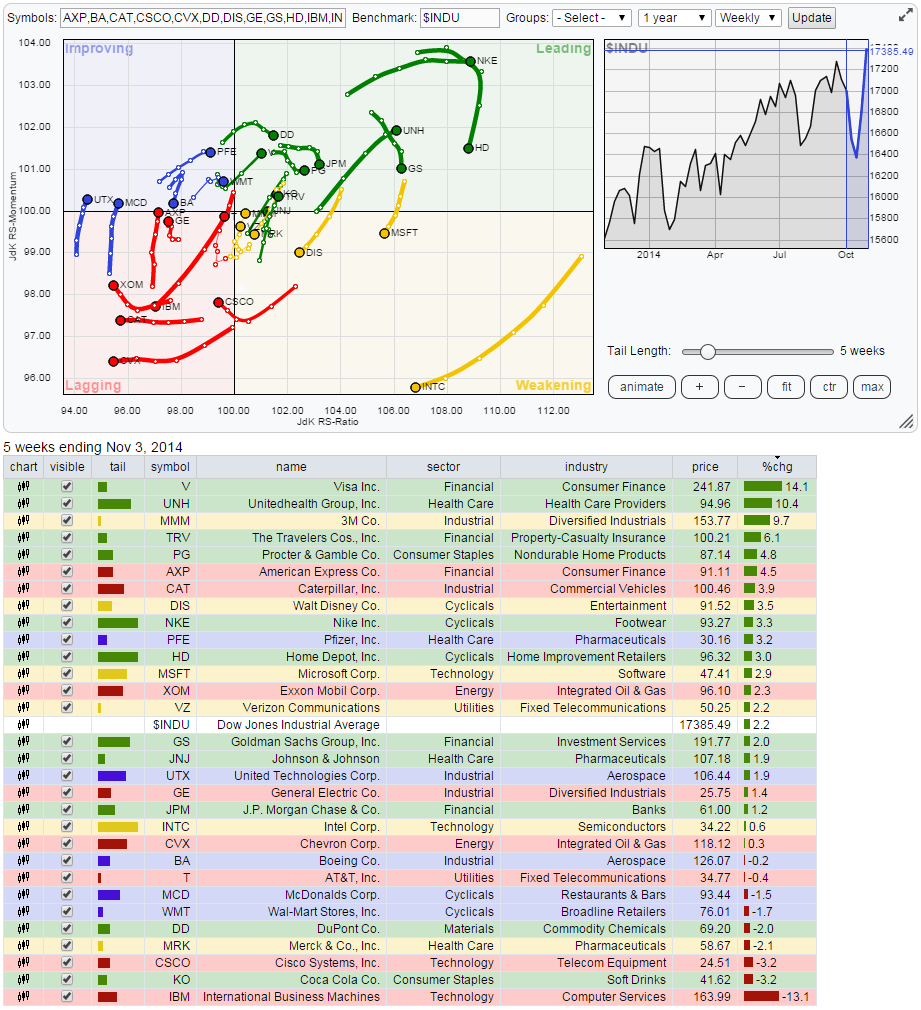
The Relative Rotation Graph below shows the members of the Dow Jones Industrials index with that same index acting as the benchmark. As all members of the benchmark universe are present on the plot we call this a "closed universe"...Read More
RRG ChartsOctober 27, 2014 at 12:11 PM
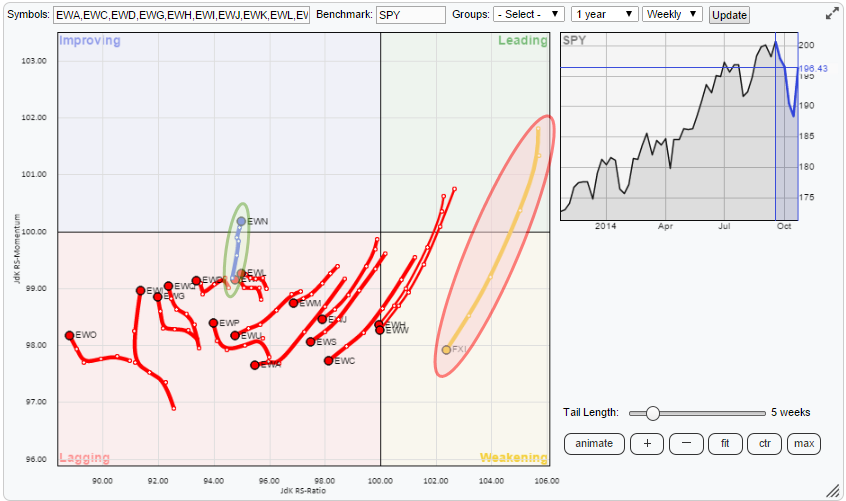
The landscape for international equities continues to show a rotation out of Emerging Markets into more developed markets. At least that is the big picture...Read More
RRG ChartsOctober 20, 2014 at 05:09 AM
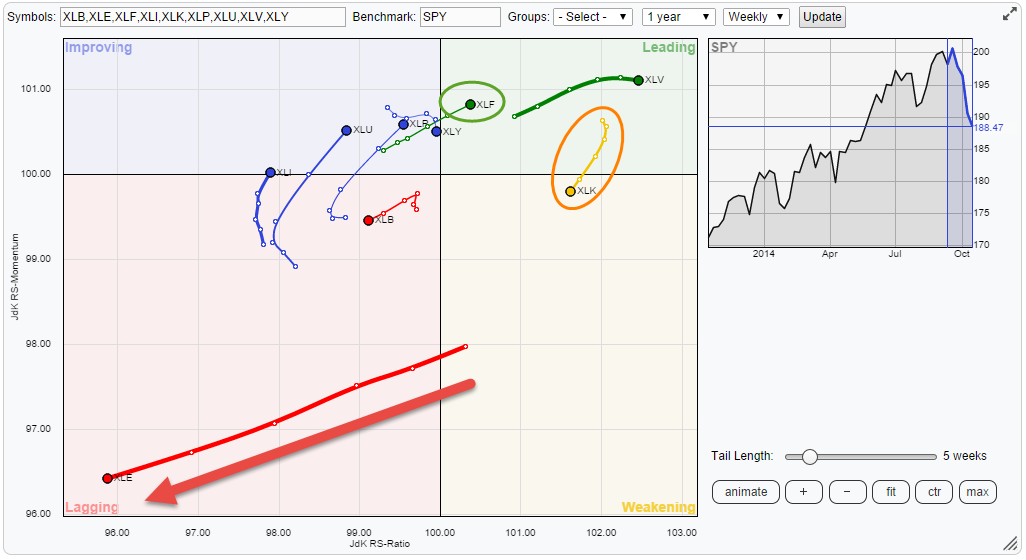
Printed below is the weekly Relative Rotation Graph(tm) of the nine S&P sector ETFs against SPY. The clear eye-catcher on this picture is the move of XLE (Energy) deep inside the lagging quadrant and still heading deeper into it...Read More
RRG ChartsOctober 06, 2014 at 12:45 PM
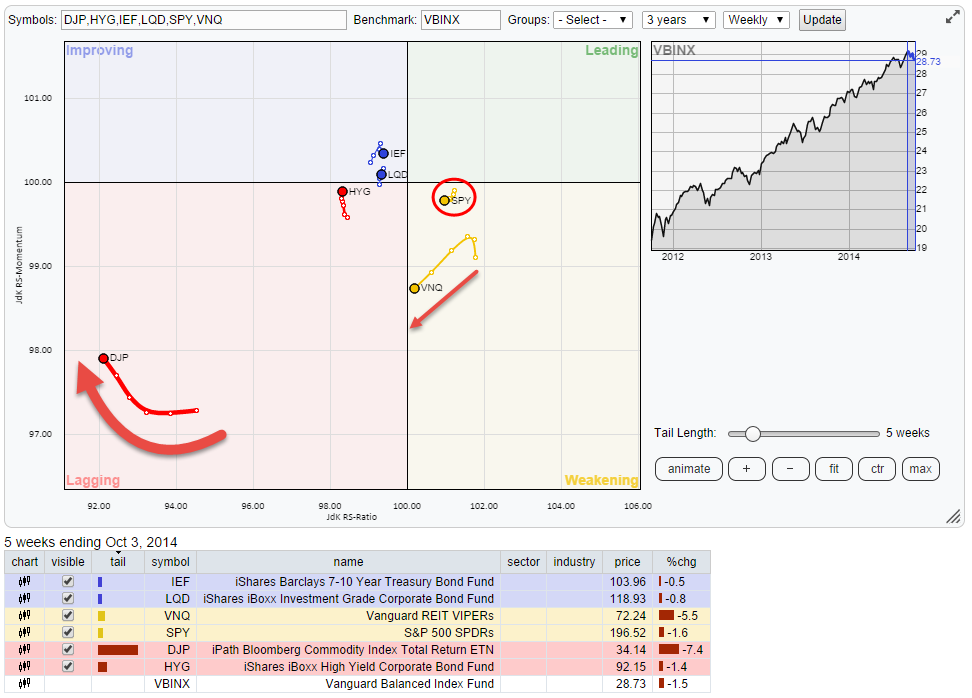
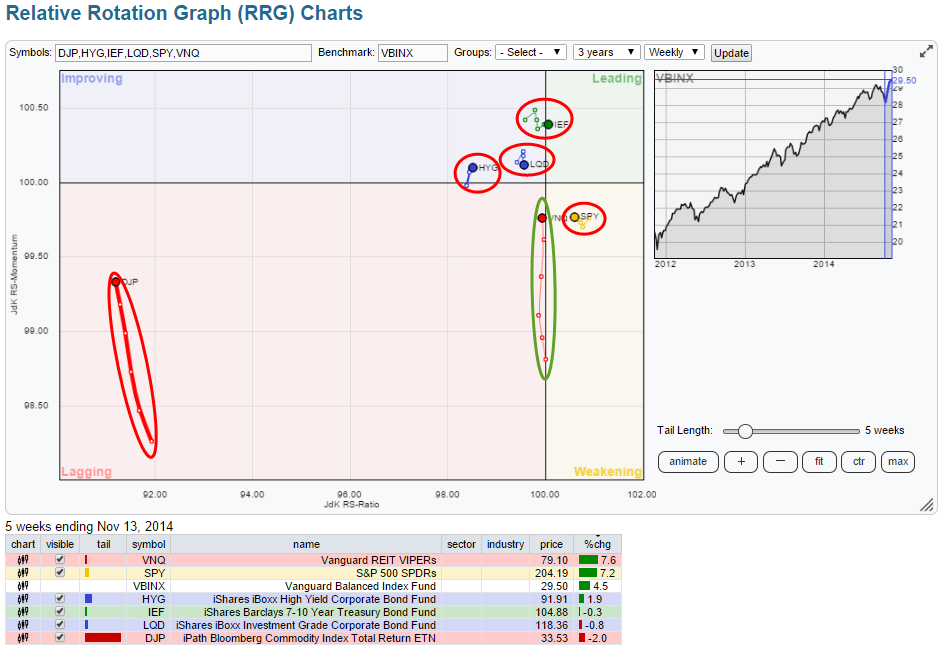
On the Relative Rotation Graph holding a number of, indices representing various, Asset Classes there are two that are standing out and deserve our attention. The first one is Commodities and the second one is Real-Estate...Read More
RRG ChartsSeptember 29, 2014 at 03:31 AM
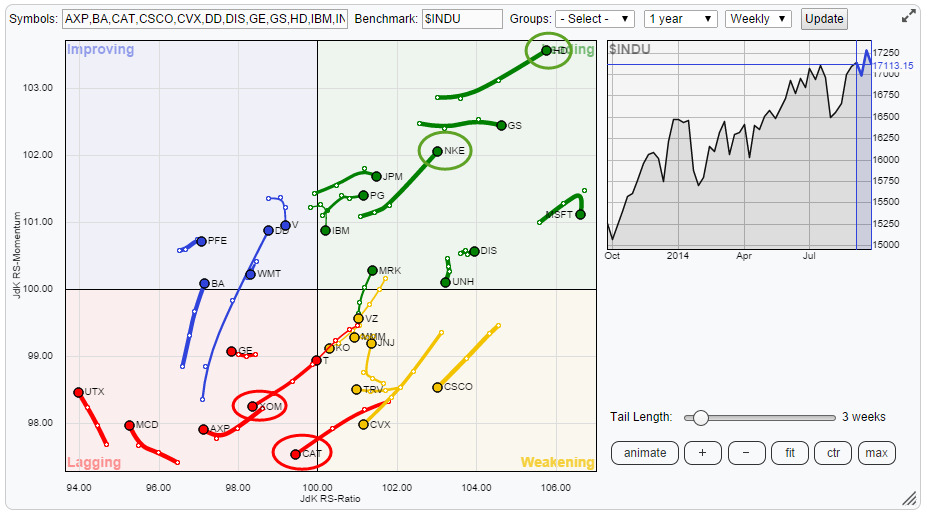
In previous posts I have been looking at asset classes, sectors, countries etc. In this post I am going to throw the 30 constituents of the Dow Jones Industrials index ($INDU) at a Relative Rotation Graph and also look for confirmation between weekly and daily time-frames...Read More
RRG ChartsSeptember 20, 2014 at 08:19 AM
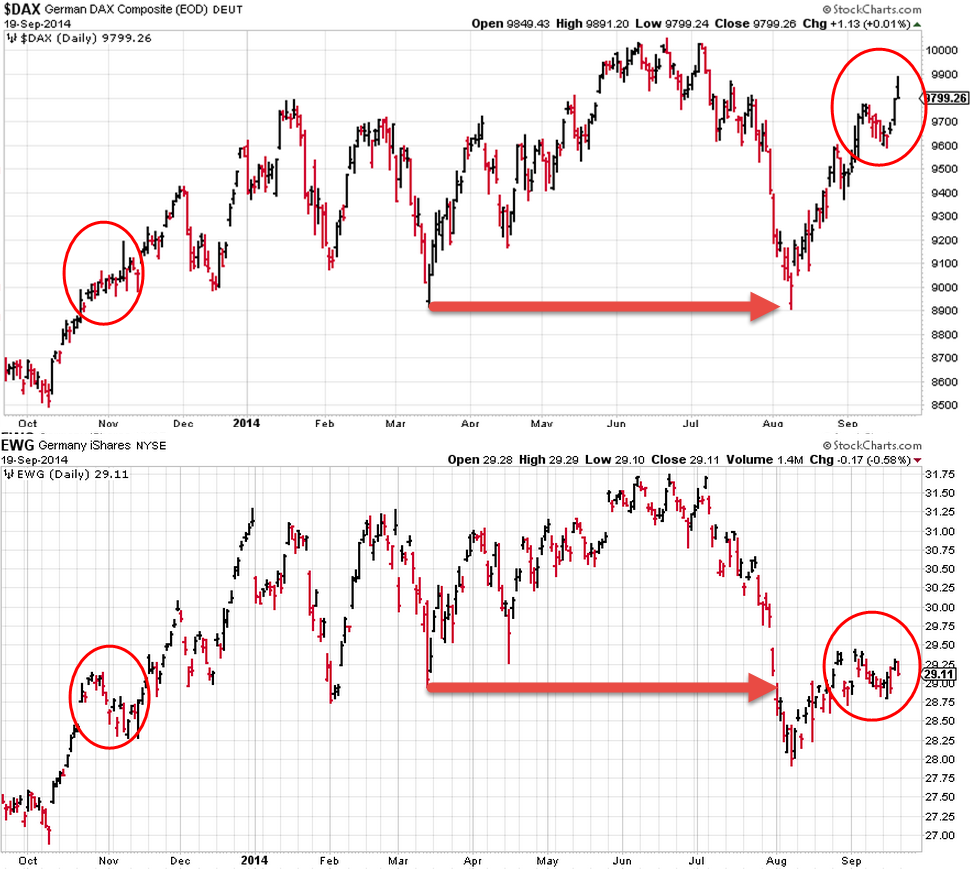
In a previous article we looked at using Relative Rotation Graphs for analyzing asset class rotation. One of the main caveats that was pointed out in that blog was to be very careful on what ticker symbols to use to construct the RRG with...Read More
RRG ChartsSeptember 12, 2014 at 10:39 AM
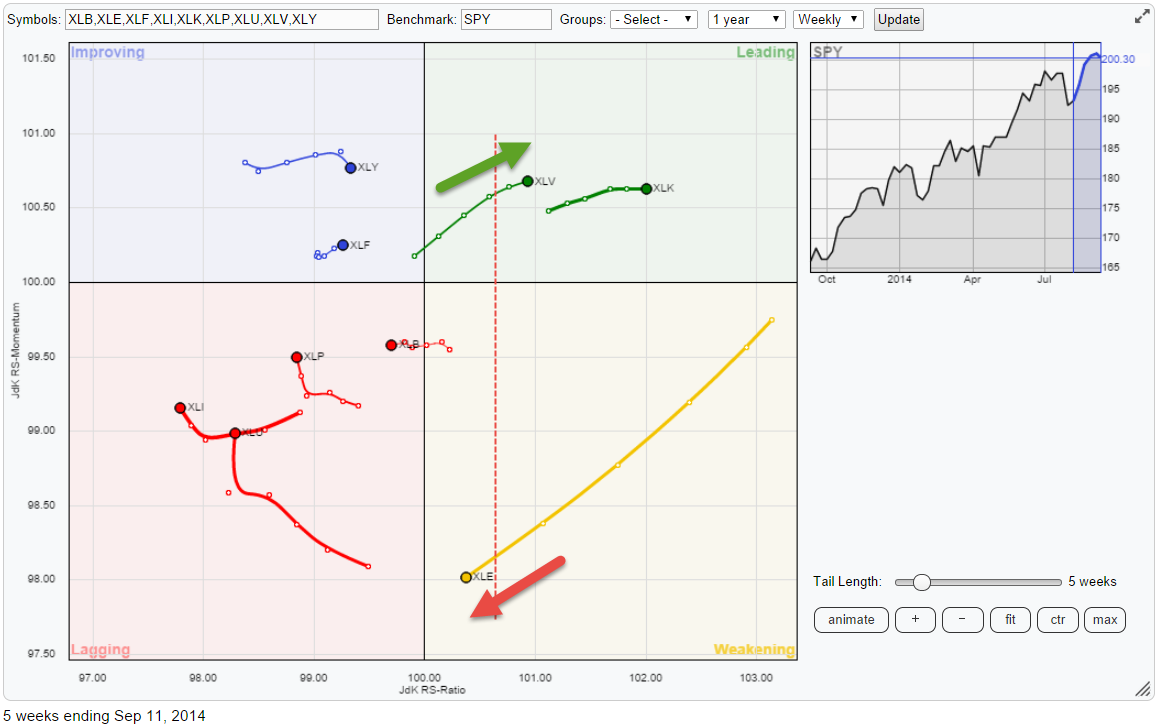
The Relative Rotation Graph of the nine sector ETFs against the S&P 500 (SPY) is showing some clear and distinct rotations at the moment...Read More
RRG ChartsSeptember 05, 2014 at 12:37 PM
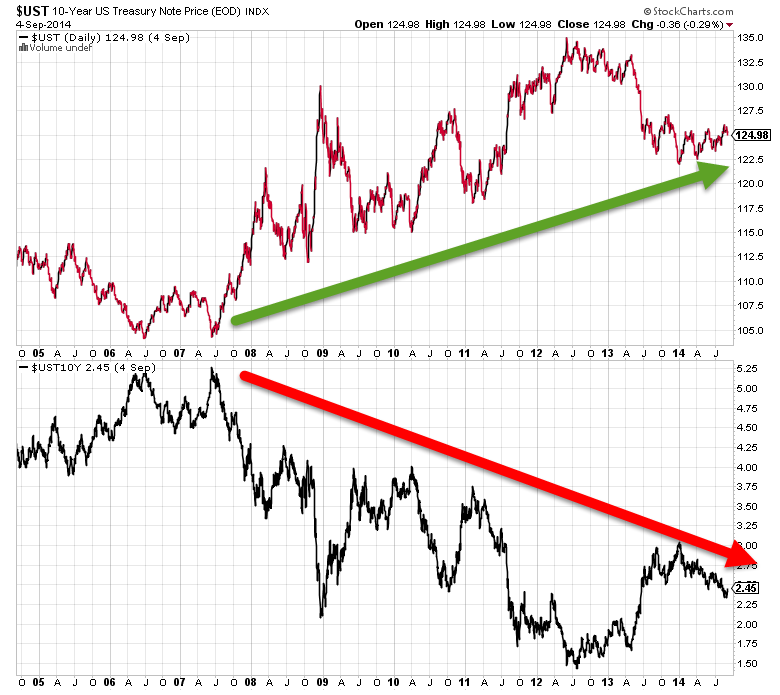
One of the comments on my last article (daily data now available for RRG charts) mentioned using RRG charts in relation to monitoring different asset classes, which just happened to be the subject of this article that I was already working on when the comment came in...Read More
RRG ChartsAugust 29, 2014 at 12:07 PM
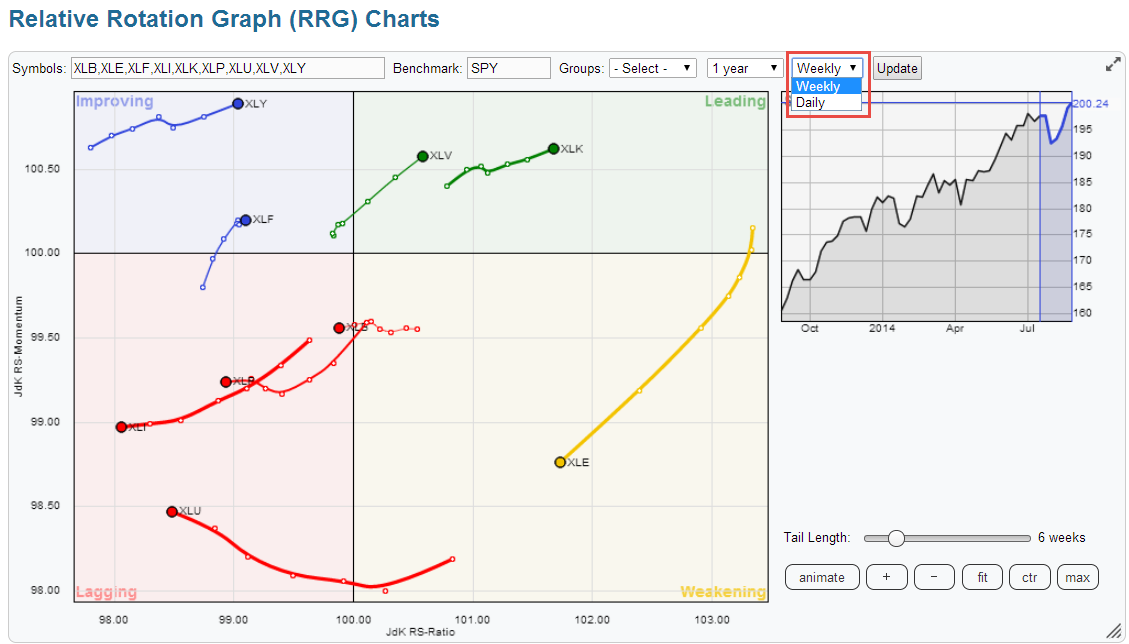
Until now Relative Rotation Graphs on StockCharts.com could only be rendered using weekly data-streams... Not any more! The early adapters and users who check in on RRGs on a daily basis may have seen the new addition already...Read More