 Hello Fellow ChartWatchers!
Well, it is December now and the stock market is STILL in record territory! The rally that started way back in October 2011 continues to roll on, seemingly without a care in the world. Skip on down to the articles that follow mine for more information and commentary about that whilst I explain how you can get the most out of our current Holiday Special. This advice applies to both current members and non-members.
The What, The When, The Why, and The How of our Holiday Special
The What: From now until the end of the month, if you place an order for 6 months of any service, we'll give you a 7th month for free. If you place a 12 month order, we'll give you 2 additional months for free. And if you place a 24 month order, we'll give you 5 additional months (29 total) absolutely free! The special applies to subscription orders from new members and returning members as well as extension orders from existing members.
As old-timers know, the best time to subscribe or renew an existing account is now, during one of our specials. Because our prices are already very affordable, when we run any kind of special, it is something that everyone should take advantage of.
IMPORTANT NOTE: Existing members don't have to wait until their account is about to expire in order to take advantage of this special! If you renew now, we'll simply add the additional time to your expiration date regardless of when that date is.
Here are some answers to some questions you might have about our Holiday Special:
Q: I'm an existing member with less than 12 months to go before my account expires. What should I do?
A: If you are happy with our service, my strong advice is to renew now for 6 or 12 months and take advantage of the special. It's the most cost-effective way to ensure that you have access to all of our subscriber features. For example, by ordering one year of our "Extra" service now, you will save $99.35 (28.4%) over the cost of paying month-to-month. By the way, to see how many months you have left on your current membership, click on the "Your Account" link at the top of any of our pages.
Q: I'm an existing member with more than a year to go before my account expires. What should I do?
A: We typically run two specials per year. While we can't guarantee when our next special will be, we often hold a special around the middle of the year. That means you can choose to either renew now in order to lock in the pricing or wait until next year.
Q: I'm not a subscriber yet but I'd like to try out your service and possibly take advantage of your special pricing. What should I do?
A: Follow these steps to test out our service and then, hopefully, take advantage of our Holiday Special:
1.) Sign up for 1 month of our "Extra" service. Our 1 month subscription comes with a 10-day money back guarantee which means that you'll have 10 days to test drive our service and see if it is what you expect.
2.) If you don't like our service, just let us know within the first 10 days. We'll refund your money completely.
3.) If you like our service, you can then place a renewal order for either 6-, 12-, or 24-months of service before the end of the month in order to lock in our Holiday Special rates. We'll simply add the additional months on to the end of your original subscription.
Q: I have a coupon code from your Long-Term Subscriber Loyalty Program. Can I use that coupon along with the Holiday Special?
A: Absolutely! Combining their Loyalty Discount with one of our Specials is how loyal, long-term members can get the biggest savings. Just be sure to enter your coupon code into the order form when placing your renewal order.
Existing Members: Click here to place a renewal order now.
New Members: Click here to learn more about our different service levels
One last tip: Don't delay. Our Holiday Special will be over before you know it.
- Chip
SITE NEWS
RECENT ADDITIONS TO STOCKCHARTS.COM
- NEW WEBINAR SERIES FROM ARTHUR HILL STARTS ON TUESDAY - Following the success of Greg Schnell's Thursday webinars, Arthur Hill will begin hosting a second weekly webinar series on Tuesdays at 1pm Eastern starting this week! Arthur will be sharing his thoughts on the market live and then taking questions from the audience. Currently, but Greg and Arthur's webinars are free for everyone. If you can attend, click here to register.
- MONTHLY SCANS NOW AVAILABLE! - "Just in time for the holidays," we now support Monthly advanced scans in addition to the Daily and Weekly scan periods we've always supported. For example, "[monthly rsi(14) x 70]" will find all symbols whose 14-month RSI has just crossed above 70. Enjoy!
- DON'T FORGET TO "TAC" - Our "Top Advisors Corner" (or "TAC") is a real hidden gem on the website. Each week, 10 to 15 articles from recognized industry experts appear in TAC free for you to read and ponder. Experts like Tom McClellan, David England, Tim Ord, Martha Stokes, Gene Inger and our newest contributor Jean-Francois Owczarczak from FinGraphs.
- HOLIDAY CHECKLIST - Got some extra time during the holidays? Here's a list of things you could to do on StockCharts.com to spend that time becoming a better investor:
- Study the DecisionPoint Chart Gallery - an amazing collection of indicators that really can show you what's coming next
- Check out the Seasonality of your Favorite Stocks - our Seasonality tool tells you which months a stock traditionally goes up and by how much
- Become a Certified ChartWatcher - passing our certification exam will make you a better informed technician (and it will save you money!)
- Get Alex Elder's New Book - the new edition of "Trading for a Living" is the perfect book to read by a warm fire (and it makes a great Christmas gift!)
- Check out the DecisionPoint Market Recap - Members can download this hidden gem every day and see exactly what the market is currenly doing. The spreadsheet link is located on the right side of the "DP Reports" blog.
- Learn RRG Charts - That "spaghetti" is actually telling you something - something important. Read Julius' RRG blog to learn more about how to decipher his Relative Rotation Graphs.
- Read John Murphy's Free eBook "Charting Made Easy" - It's free, it's John Murphy, it's on our website. It's great for beginners and a great review for experienced chartists.
- Re-Read Sir Martin Pring's Posts! - Are you reading Martin's "Market Roundup" blog articles religously? No? You are definitely missing out then.
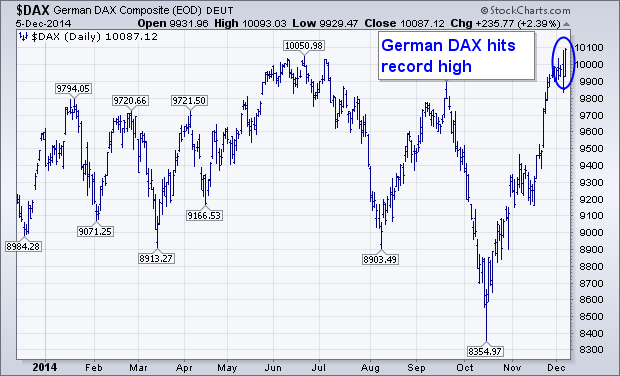
German stocks sold off Thursday after the ECB delayed further monetary easing until the first quarter. Later reports that more monetary stimulus might come as early as January helped boost European stocks which rallied sharply on Friday. Chart 1 shows the German DAX Composite Index jumping 2.4% on Friday to reach a new record. Other eurozone stock markets jumped as well. France rose 2.2%, Spain gained 2.6%, and Italy 3.4%. Friday's strong jobs report in the U.S. may have also improved market sentiment in global markets. The only laggards were oil producers like Brazil, Canada, and Russia. Oil importers like China and Japan hit three and seven year highs respectively. That puts most global stock markets on a sounder footing. Most foreign currencies fell however as the U.S. Dollar hit a new eight-year high. That was due mainly to a big jump in U.S. rates on Friday following the strong jobs report.
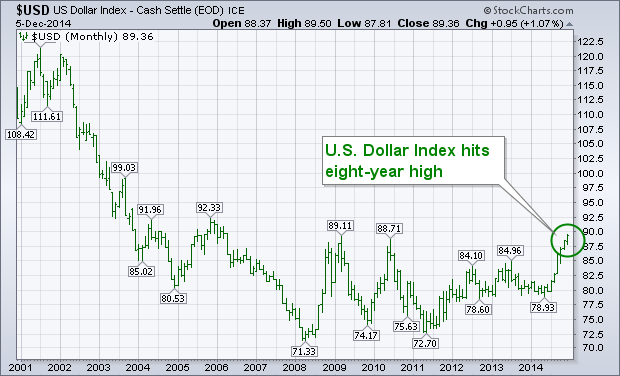
The monthly bars in Chart 2 show the U.S. Dollar Index ending the week at the highest level since 2006. The USD closed slightly above its 2009 and 2010 highs. Any chart reader will recognize that as a major upside breakout. The USD had fallen between 2002 and 2008 before bottoming. It has traded sideways since then in an apparent bottoming formation. This week's upside breakout has completed that bottoming formation and signals the likely start of major uptrend in the U.S. currency. Chart 2 suggests that the bull market in the dollar has a lot further go both in price and time. Dollar strength is one of the main reasons why commodity markets are in major downtrends. It also explains why commodity exporters are underperforming and commodity importers outperforming on the global stage. The main reason for dollar strength is the growing discrepancy by rising U.S. interest rates and low foreign rates.
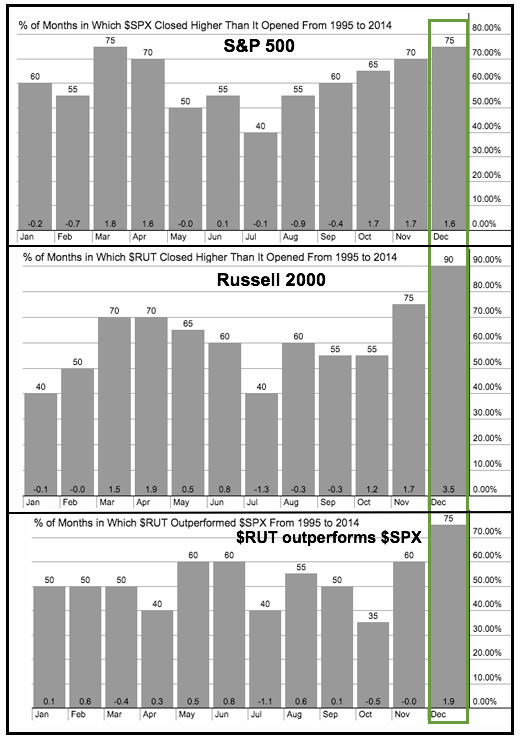
There are two bullish seasonal patterns at work right now. First, stocks have shown a strong tendency to advance in December. Second, small-caps have shown a strong tendency to outperform large-caps in December. Over the last twenty years, the S&P 500 has risen 75% of the time and the average gain was 1.60%. The Russell 2000 has risen 90% of the time and the average gain was 3.5%. Yes, you read right. Don't take my word for it, check out our seasonality charts below. This is a pretty staggering statistic that gives the Russell 2000 a bullish bias heading into yearend. Furthermore, Charlie Bilello of Pension Partners took December seasonality one step further and found that most of the strength comes in the second half of the month. And finally, it is also worth mentioning that the Russell 2000 outperformed the S&P 500 75% of the time over the last twenty years. Seasonal tendencies are one thing, and trend is another so I will focus on the IWM chart after the jump.
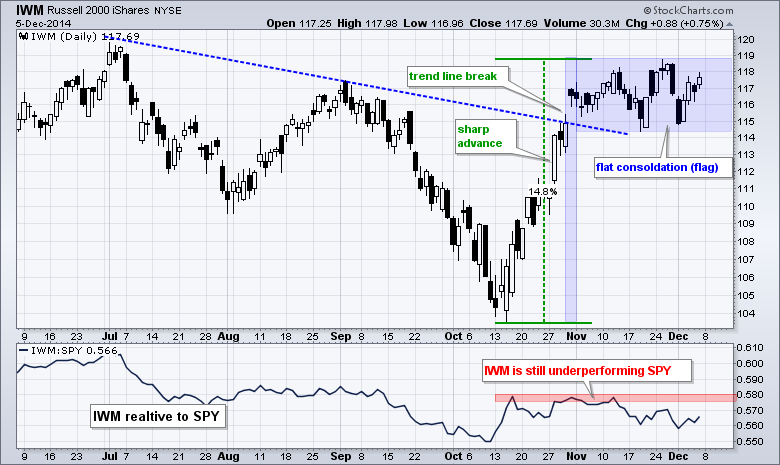
The Russell 2000 iShares (IWM) has yet to start out performing and is up less than 1% so far this month. The second chart shows IWM surging in October and then consolidating the last five weeks. Even though it is not picture perfect, the pattern resembles a flat flag, which is a bullish continuation pattern. IWM bounced off support in the 114-115 area twice, but remains shy of a breakout that would signal a continuation of the October surge. A break above the November highs would confirm the bull flag and target a move to new highs. The indicator window shows the IWM:SPY ratio working its way lower the last few weeks. The ratio has yet to break the mid October low, but IWM shows relative weakness and a break above the October-November highs is needed for IWM to start showing relative strength again.
Thanks for tuning in and have a great weekend!
Arthur Hill CMT
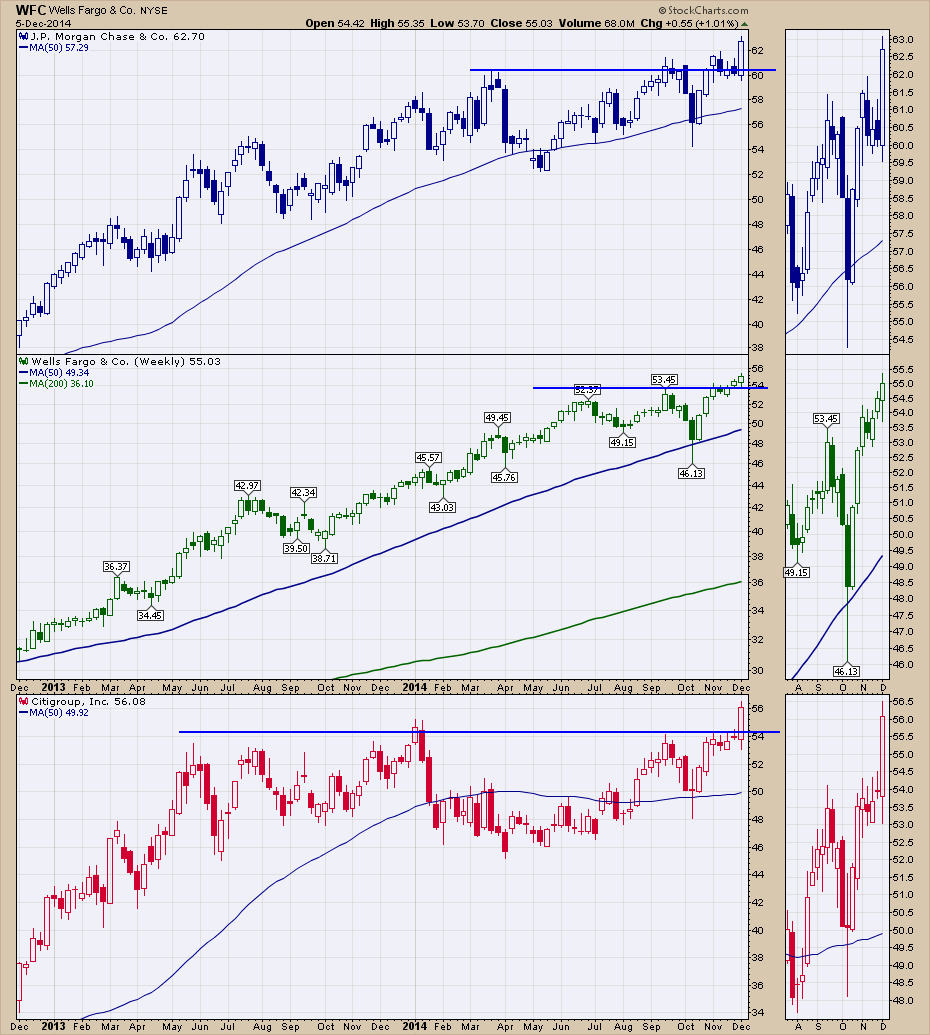
Friday saw an outstanding jobs number that was 25-50% higher than the expectations. The immediate take on that was the Federal Reserve would have to raise interest rates sooner than the expectations. All that meant that there would be an interest spread for the banks to start working with and all of the big banks and brokers broke through their respective ceilings.
Here is the weekly for three of the big banks. Two of these three closed last week below these horizontal resistance areas. Wells Fargo was marginally higher.
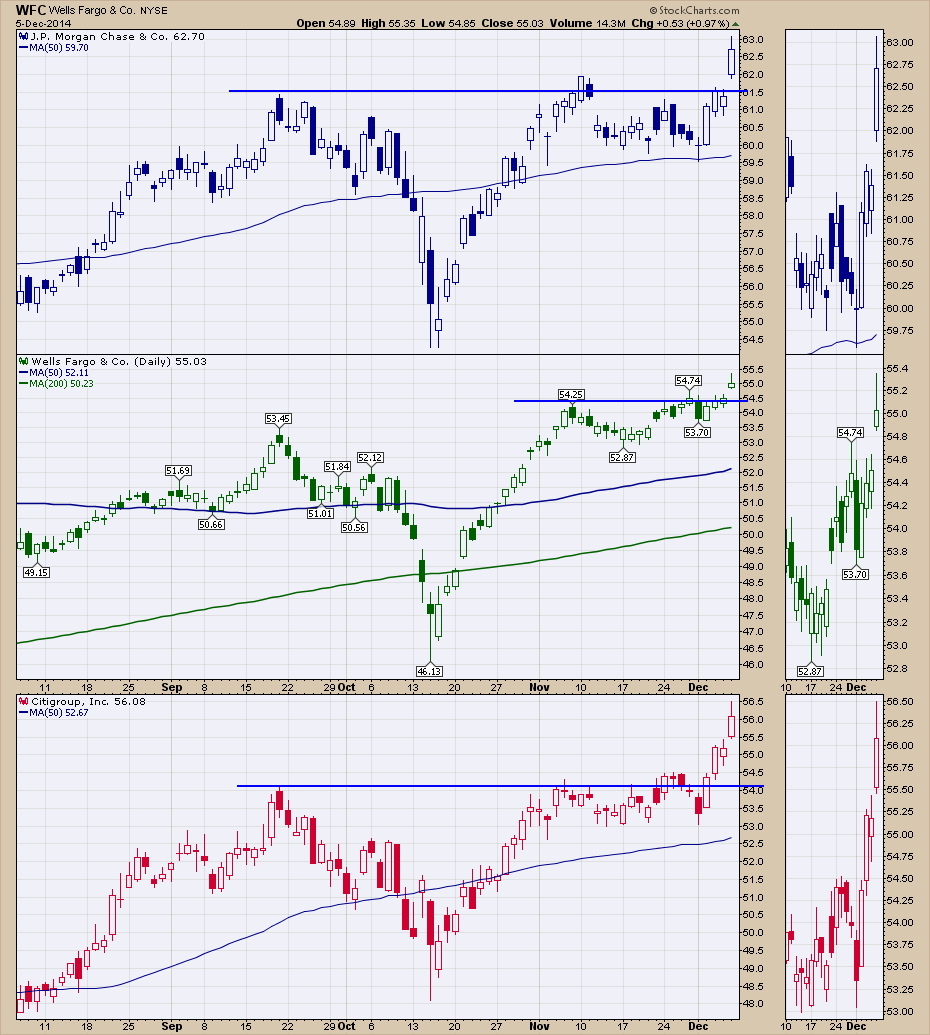
Here is the daily of the same three. This can only be considered as a bullish breakout for the industry group.
Here are the brokers. This is a weekly chart but almost all of the move was on Friday.
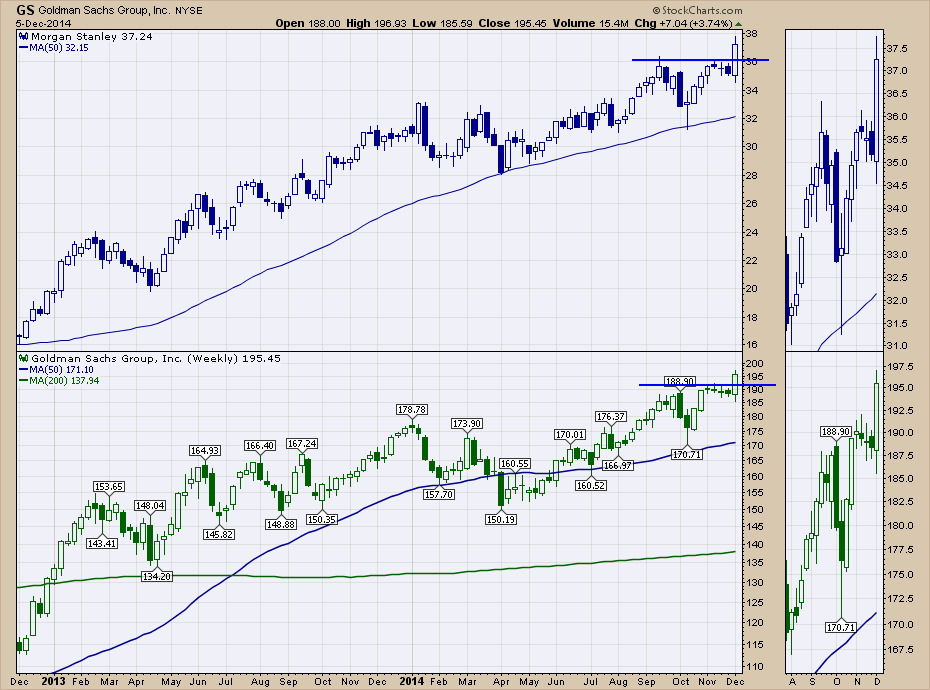
This is very promising to see the banks and brokers shooting Orion-like launches to new highs as a group. It suggests this area is really getting the institutional investors on board. As these are mega - cap stocks, it takes big institutional buying power to make these take off and I'll be considering it a new industry breakout till proven otherwise. On Thursday's webinar I noted that the industry group charts looked like they were stuck under resistance and this was an important time to watch closely. Well, we got a signal, a big bullish signal that these are going to perform well into Federal Reserve interest rate moves. As long as that plan holds up, these should too.
Good trading,
Greg Schnell, CMT
GOLD MINERS: HOW LOW CAN THEY GO?
by Erin Heim | DecisionPoint.com
I wrote a blog article some time back that questioned whether the Gold Miners stocks had finally hit rock bottom. I concluded that it was good set-up for a bottom but there was still plenty of room for decline before they hit all-time lows. The stocks in the Gold Mining Industry Index, $DJUSPM may have hit their bottom, but our indicators in three time frames warn us of trying catch a falling knife.
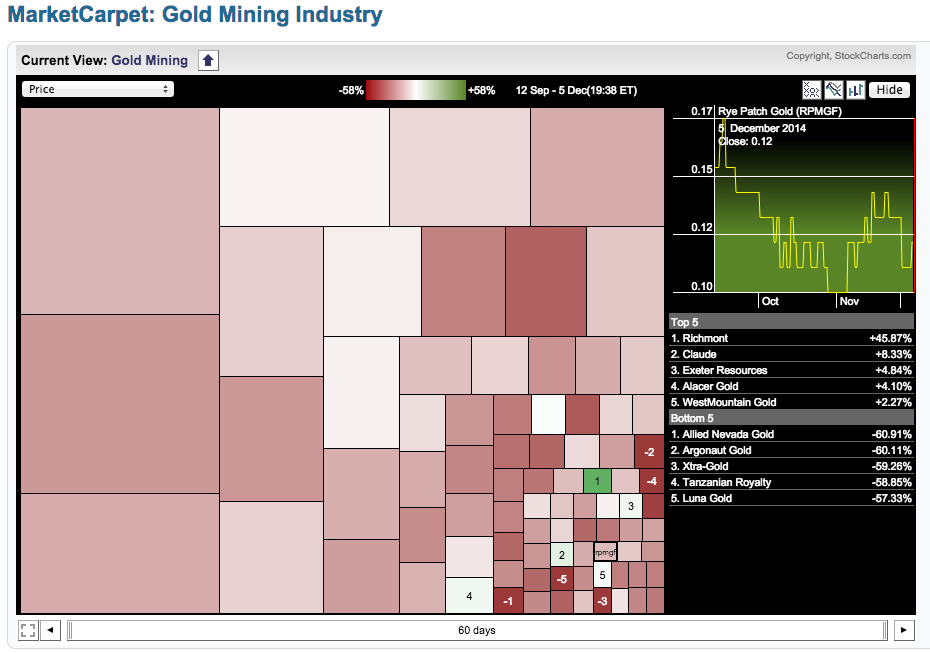
The Market Carpet for the Gold Mining Industry shows just how devastating the last 60 days have been.
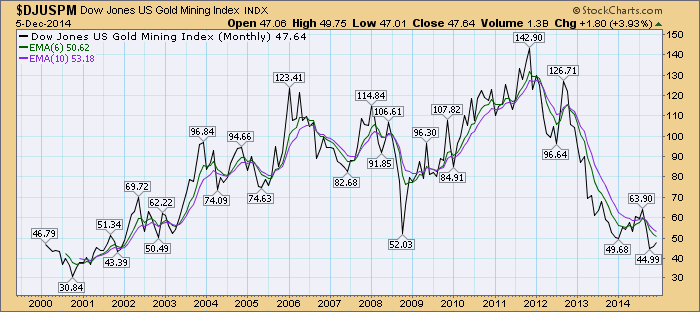
Let's start with the long-term view and move out from there. Since this index began, the all-time low was 30.84, price is not there yet but it is getting very close. This year both the 2003 and 2008 lows were taken out. The question is whether the all-time low will be taken out soon.
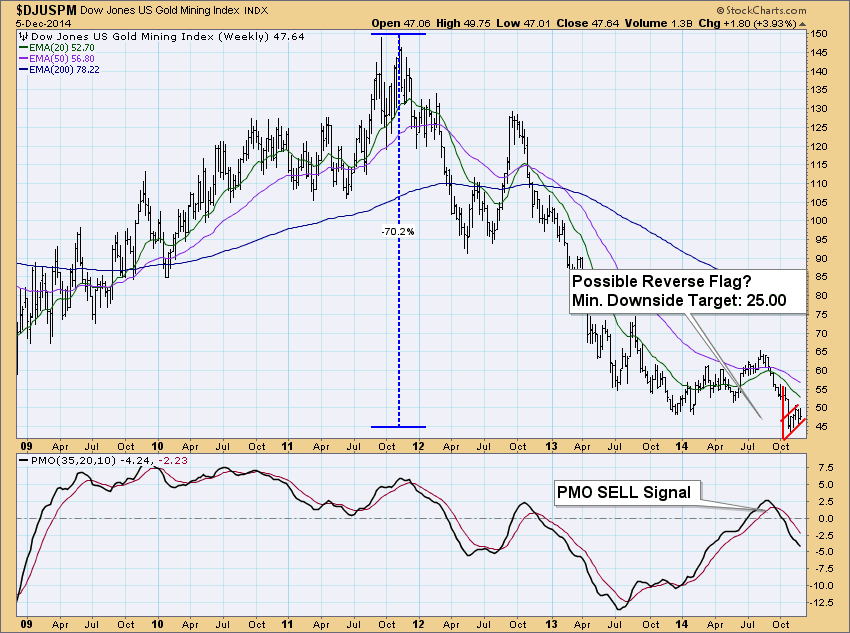
On the weekly chart this sector has taken more than a 70% beating! Unfortunately when we look more closely at this chart, there is a possible bearish reverse flag in play. If this flag were to execute downward, the decline would be the length of the flagpole. The minimum downside target would be 25.00. The Price Momentum Oscillator (PMO) in the third quarter of this year and has been declining ever since. Worse is that it is only in neutral territory and has much further to fall before reaching oversold levels.
In the shorter-term daily chart, the picture doesn't get much more optimistic. There's a lot going on here. The PMO is rising after a positive crossover in oversold territory which is bullish, but notice that it is beginning to decelerate. A PMO top below the zero line would be very bearish. Notice right before the big correction a the PMO SELL signal was generated in August, followed by the 20-EMA crossing below the 50-EMA. That generated a Neutral signal on the DP Intermediate-Term Trend Model. Why not a SELL signal? Because the 50-EMA was still above the 200-EMA at the time which implies this sector was in a bull market. However, shortly thereafter the 50-EMA crossed below the 200-EMA which generated a DP Long-Term SELL signal. The Neutral signal doesn't change; once the Trend Model generates an intermediate-term Neutral (or SELL) signal, it doesn't change until it gets a positive 20/50-EMA crossover and generates a BUY signal. To read more about the DP Trend Model, check out the article in ChartSchool.
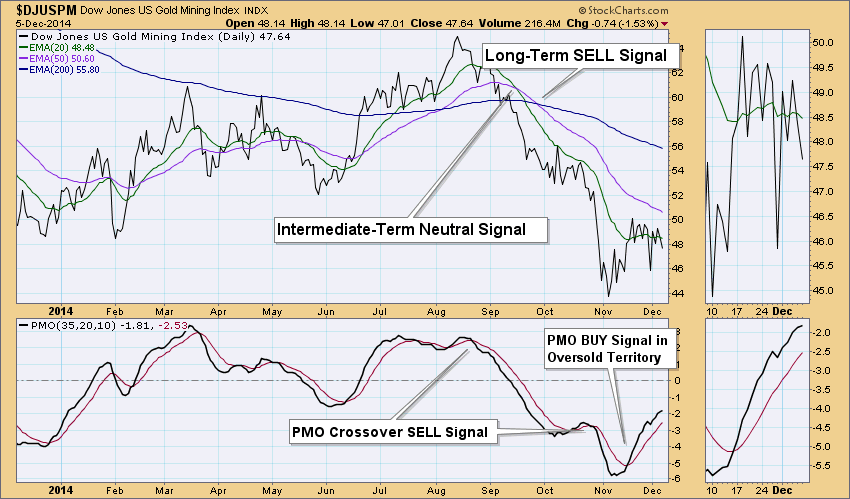
It is hard to imagine the index reaching 25.00, but with the reverse flag shaping up and its potential execution, it is entirely possible. However, if it doesn't execute, then a bottom might well have been reached or at a minimum, the prospective downside target could be avoided.
As a student of stock market history, I'm often astonished by historical facts about market performance. December is generally a very solid month for equities and no index benefits more from this seasonal bullishness than the Russell 2000. Since 1987, the Russell 2000 has risen 24 of 27 years during the month of December, sporting a robust 42.45% annualized return. It is BY FAR the best month of the year for small caps with the second best month - April - lagging way behind with an annualized return of 19.42%.
Of the 3 negative Decembers on the Russell 2000, there was a 0.23% loss in 2007, a 0.60% loss in 2005 and a 5.72% loss in 2002. So really the 2002 year was the only year since 1987 where small caps have performed very poorly. That's 1 bad year out of 27. Small caps gained ground in December every year from 1987 through 2001. Being overly bearish small caps during December has proven to be a very poor trading strategy. So does this mean we should be ALL IN on the long side? Of course not. First of all, history is just that - history. It provides us no guarantees about future performance. But even beyond that limitation, one third of December actually is quite bearish for small caps. This may be the most amazing historical statistic of all.
For purposes of historical market performance, December can be broken down into three periods as follows:
1st through 6th
7th through 15th
16th through 31st
The performance between these these periods is staggering. Take a look at the annualized returns by period:
1st through 6th: +25.81% (up 20 times, down 7 times)
7th through 15th: -22.77% (up 5 times, down 22 times)
16th through 31st: +78.84% (up 24 times, down 3 times)
A couple more historical facts:
Remember, it was pointed out above that the Russell 2000 moved higher every year from 1987 to 2001, or 15 consecutive years. Well, consider that this same index LOST value every year from 1988 to 2003, (or 16 consecutive years!) during the December 7th through the 15th period. That is quite remarkable.
So why bring this up? Well, check your calendar because the December 7th through 15th period starts on Monday. This would be the time where we begin to see some selling, if it's going to happen in December. Here's the current technical look at the Russell 2000 as this potentially bearish period begins:
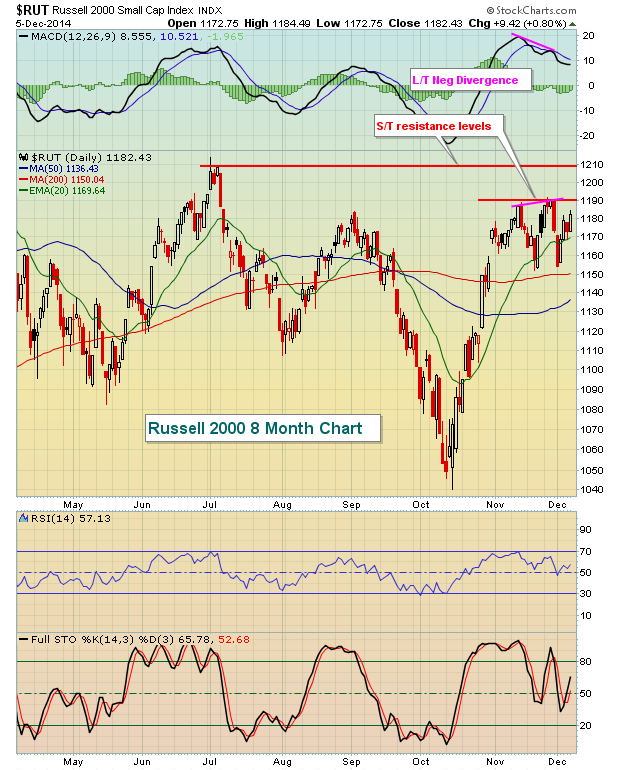
There is a long-term negative divergence still in play and a couple of key price resistance levels overhead that must be negotiated. So if the bulls are going to take charge next week, they're going to have their work cut out for them.
Over the next week to ten days, it makes sense to look for small cap stocks that have been performing well, but poised for some short-term selling. One such stock is Tessera Technologies (TSRA), part of the very hot semiconductor industry. It's beginning to show a weakening daily MACD along with an extremely overbought RSI at 80. If it sells off in the week ahead, it could become a much better reward to risk trading candidate on the long side as we wrap up 2014.
I'm featuring another small cap stock stock for my Monday Chart of the Day. This Chart of the Day is free and I'm also having a webinar this Wednesday that discusses how I scan for and analyze stocks before including them as Charts of the Day. To register, simply CLICK HERE
Happy trading!
Tom Bowley
Chief Market Strategist
Invested Central

Fish swim in schools. Birds fly in flocks. Humans follow grouping principles too. Gestalt psychologists describe these as the Laws of Grouping and the stock market most definitely acknowledges these laws at its core. My own trading methodology leans heavily on these principles to such an extent that I actually named my version the "sisters strategy". In the most elemental...
Read More Hello Fellow ChartWatchers!
 Hello Fellow ChartWatchers!


 Fish swim in schools. Birds fly in flocks. Humans follow grouping principles too. Gestalt psychologists describe these as the Laws of Grouping and the stock market most definitely acknowledges these laws at its core. My own trading methodology leans heavily on these principles to such an extent that I actually named my version the "sisters strategy". In the most elemental...