Hello Fellow ChartWatchers!
So as I write this, I’m crammed into seat 18F on the red-eye back to Seattle. I can barely type on my laptop thanks to the wonderful people all around me. It’s not their fault, but I’m about to ask the flight attendant if I can crawl out on the wing so I can get this article written. According to the flight tracker, things do not look promising:
 The good news is that I learned about several new technologies that will help us improve our website but - man - attending tech conferences can be a big, expensive pain! Check out the (approximate) costs for this one trip:
- Conference registration: $800
- Airfare: $350
- Taxi rides: $120
- Hotel: $1200
- Non-Convention Food: $200
- Parking: $130
So that’s $2800 for this conference alone (I go to 3 or 4 each year) and that doesn’t include these amazing, intangible “benefits”:
- Jet Lag
- No Exercise
- No Laundry
- Bad Bed/Pillows
- Sketchy Food
- Our good friends at the TSA
- The inevitable cold/illness
- The crying babies in 17A, 18C, and 19E
- TuRbULenCe!
- Kamikaze Taxi Drivers
- …and so much more!
Why am I boring you with this stuff? Because this stuff is exactly the reason we made ChartCon 2016 a virtual conference! Instead of suffering with all of this pain and expense, if you register for ChartCon 2016, you'll be able to watch everything from the comfort of your own home. And you’ll be able to pause, rewind and re-watch any part of the conference as often as you want - something I wished I could do multiple times this past week.
ChartCon 2016 is being held - online - on Friday September 23rd and Saturday September 24th. It costs $200 period. That's all. None of the additional time and expenses like I mentioned above. $200 bucks. Done.
I also guarantee you that you’ll learn more than I did this week. While I did get a couple of nuggets and some good tech contacts, there were lots of useless sessions and events that I had to suffer through to get those nuggets. Instead of that, we’re working hard to make sure you’ll get great, actionable takeaways from each and every session. Check out this agenda:
Friday:
- Keynote: “Profiting from the Special K” - Martin Pring
- “Building a Successful Technical Trading System” - Grayson Roze, Arthur Hill and yours truly
- “Why Technical Analysis Works (and It Does Work!)” - Greg Morris
- “The Ten Stages of Successful Technical Trading” - Gatis Roze
- “The TechniTrader Analysis Approach” - Martha Stokes
- “Tech Titans Power Panel: Where’s the Market Headed?” - Everyone
- “Passing the SCU Certification Exam” - Grayson Roze
Saturday:
- Keynote: “Why Intermarket Analysis is Critical for Understanding Today’s Markets” - John Murphy
- “Visualizing Relative Strength and Profiting from Relative Rotation Graphs” - Julius de Kempenaar
- “How SCTRs Can Significantly Improve Any Trading Strategy” - Greg Schnell
- “Understanding Wyckoff’s Approach to Technical Trading” - Bruce Fraser
- “Making Money from Repeating Historical Trends” - Tom Bowley
- “The DecisionPoint Technical Trading System” - Erin Heim
- “Building a Customized Action Plan Based on ChartCon 2016” - yours truly
OK, seriously, maybe it’s the jet lag talking, but I think that is a conference agenda that just doesn’t quit! I’m positive that everyone who attends ChartCon 2016 will come away with tons more “nuggets” than I got this week.
Something else to keep in mind is that there will be lots of great stuff between each of these sessions. Immediately after each talk will be an online Q&A chat with each presenter where you'll be able to ask questions and see their answers. You'll also see tips, tricks, motivational quotes, comments from other attendees, videos and much more!
And, in case you didn’t notice, the emphasis for this year’s conference is helping everyone put together a strategy - an actionable strategy - that you can use to improve your technical investing results. A way to cut through all the noise and get down to the business - the actual process - of making money using technical charts.
So, unless you want to end up in seat 18F like me (thank goodness for noise-cancelling headphones!), do yourself a favor and register for ChartCon 2016 - all the benefits of a world-class investing convention without any of the hASseLs (sorry, hit some more turbulence).
Click here to learn more and to register
See you (virtually) in September!
- Chip
P.S. Just to be clear, the only way you can watch the recordings from ChartCon 2016 is to register for the conference beforehand! So even if you can't watch the event live, you still want to register now so that you can watch it later.
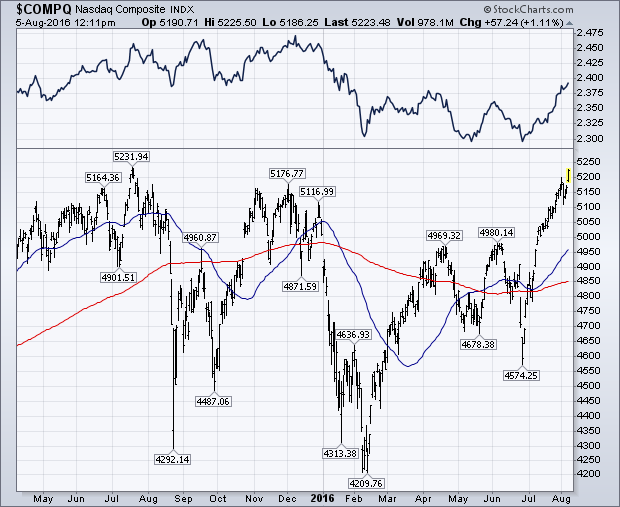
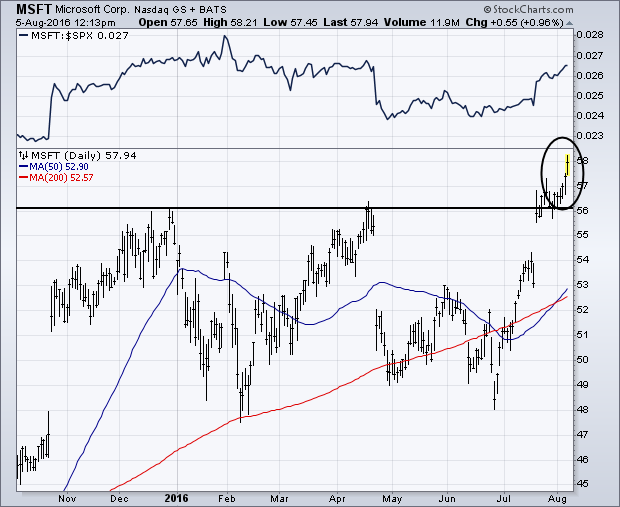
The Nasdaq Composite Index is on the verge of joining the Dow and S&P 500 in record territory. The first chart below shows the $COMPQ trading at the highest level in a year, and on the verge of clearing last July intra-day peak at 5232. The Nasdaq 100 (which includes the 100 largest non-financial stocks in the Nasdaq market) has already hit a new record, as has Technology SPDR (XLK). The Nasdaq and the technology sector are being led higher by big tech stocks that include Amazon.com, Alphabet (GOOGL), Cisco (CSCO), Facebook (FB) and Intel (INTC). The Nasdaq's biggest stock -- Apple (AAPL) -- has gained 13% since the start of July, has cleared its 200-day average, and is trading at a four-month high. The Nasdaq's second biggest stock is doing even better. The second chart show Microsoft (MSFT) hitting a new record high today to reaffirm its bullish breakout that took place during July. Its relative strength ratio (top of chart) is climbing as well. It's hard not to be positive on the stock market with big technology stocks like that leading it higher. Along with the financials.
 Be sure to register for our upcoming ChartCon 2016 conference in September where I will talk more about Intermarket relationships and where I think the markets are headed next. Click here for details.
- John
Before looking at some patterns and breakouts, let's first review the basic of the flag pattern. Flags are continuation patterns that depend on the prior move for a directional bias. Flags are bullish continuation patterns when the prior move was up and bearish continuation patterns when the prior move was down. A bullish flag can be flat or have a downward slope, while bearish flags can be flat or have an upward slope.
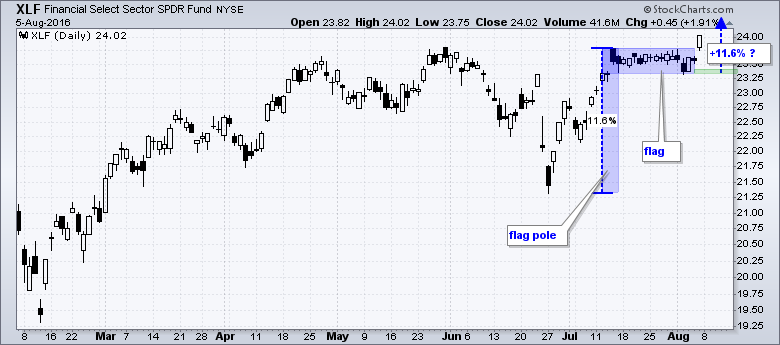
A variety of bullish flags formed in the finance sector over the last few weeks and big gaps on Friday triggered breakouts. First, the chart above shows the Finance SPDR (XLF) with a flat flag, a gap and a breakout. Flags typically fly at half-mast and this means chartists can measure the flagpole for an upside target. XLF gained 11.6% on the flagpole advance and another 11.6% move from the flag lows would target a move to around 26. After a flag breakout, chartists can use the flag lows to mark first support. Failure to hold the gap and a move below the flag lows would be quite negative.
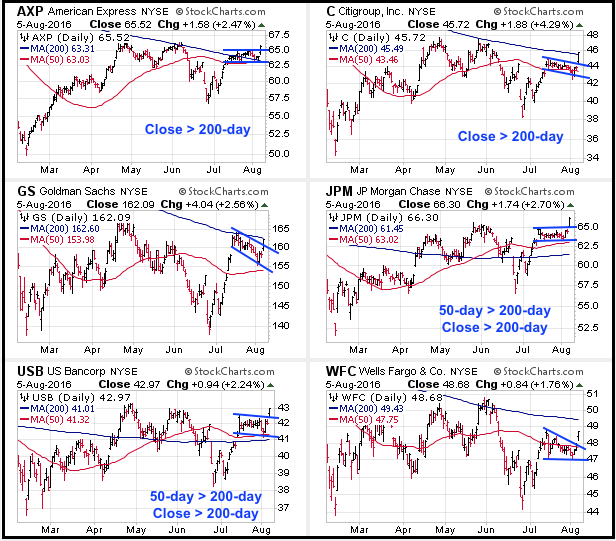 The next image shows six CandleGlance charts and a variety of flags (flat, falling and wedge). Even though a wedge (AXP) is not a flag per se, it does represent a short-term correction after an advance. AXP, JPM and USB are the strongest on the price charts because they are above their 50-day SMAs and 200-day SMAs. C, WFC and GS have flag breakouts working and are above their 50-day SMAs. C closed above its 200-day on Friday. Note that JPM and USB are the only two where the 50-day is above the 200-day. Thus, based on the charts, I would say JPM and USB are the strongest of these six.
****************************************
Thanks for tuning in and have a good weekend!
--Arthur Hill CMT
Plan your Trade and Trade your Plan
*****************************************
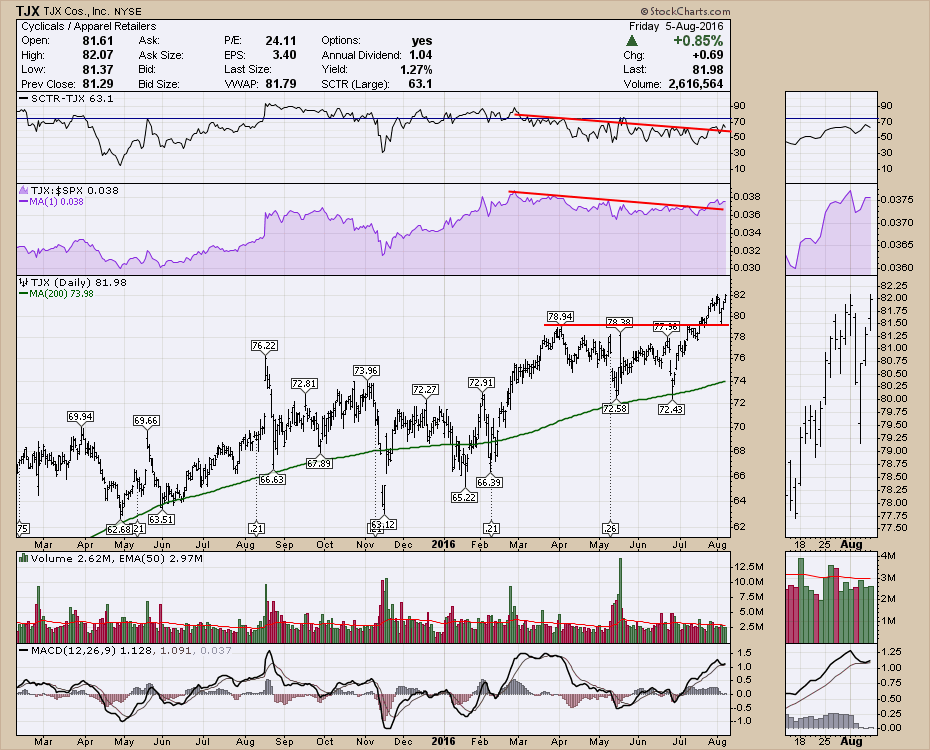
Some of the retail stocks are performing well, but it is a mixed bag. TJX (TJX) continues to hit new highs, but last year's big winner L Brands (LB) is one of the worst. So from the church of what is working lately, we turn to the SCTR's to help rank the Consumer Cyclicals group. In general, the whole retail industry is still lagging. Very few are leading in terms of price performance, but some are working ok.
TJX Co. (TJX) is one of the best retailers right now. We can see the price is breaking to new highs. The SCTR shows the stock price appreciation is stronger than 63% of large cap stocks. While that is not bad, there are a lot of stocks performing better. The price chart shows the stock breaking above three-month highs and looks to be building on the breakout.
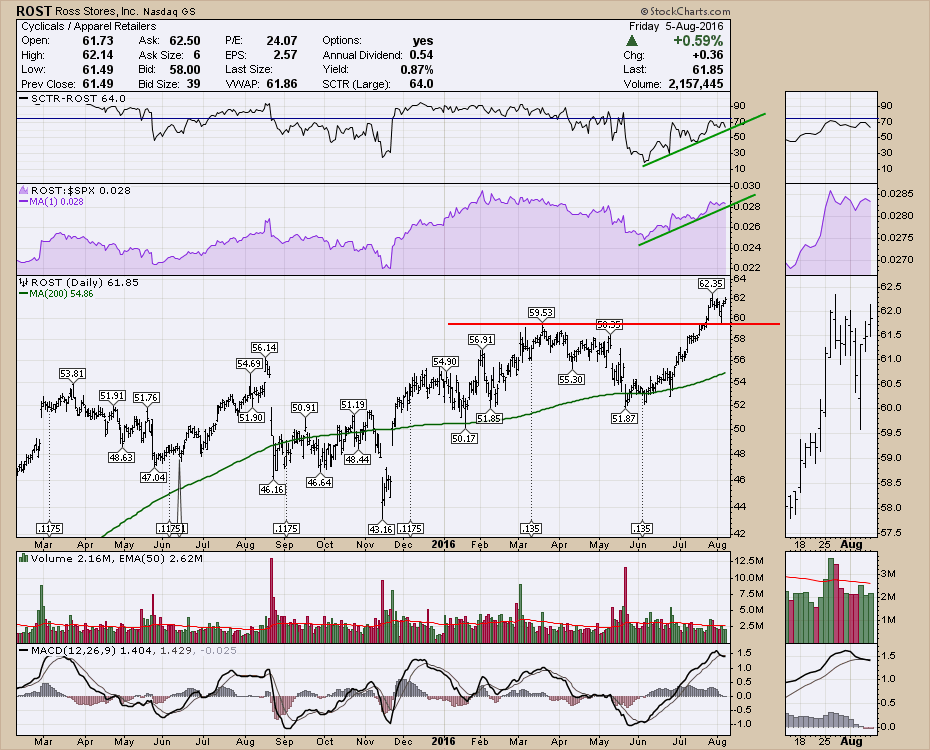
Ross Stores (ROST) is also perking up. In a similar chart look as TJX, they both seem to be accelerating to the upside.
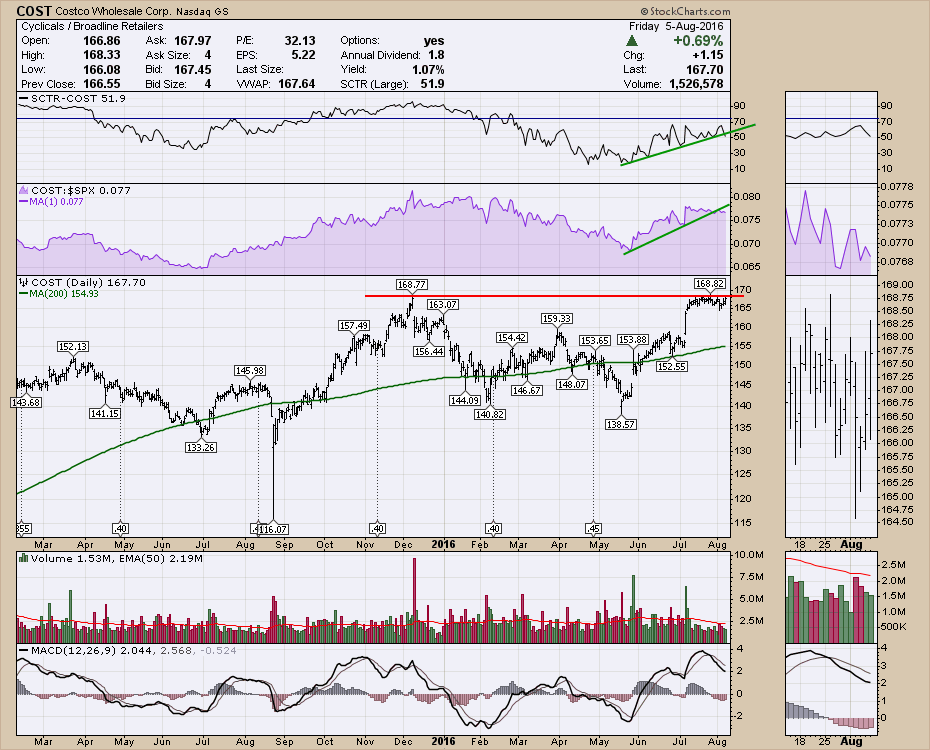
 Costco (COST) is also a nice performing chart. The stock price has moved sideways for a month after jumping up and is staying just below the new 52-week highs. When this starts to move, it looks like a nice setup into the retail season of back to school, US Thanksgiving, and Christmas.
 There are not many top performing stocks in the retail space yet. I like to look mid-summer to see what might make a run for the remainder of the year. This industry group should be picking up steam soon. The SCTR can help you quickly filter the winners from the losers and last years strong stocks may not be this years' winners. Stay tuned to the SCTR's to find the best in class.
Good trading,
Greg Schnell, CMT, MFTA.
The market has seen both the Dow and S&P hit record highs recently and now the NASDAQ wants to join the party. In fact the NASDAQ got to within just a few points of its all time high Friday, fueled by a very positive response to earnings in the tech sector, going to show that when everything is said and done the one things investors really care about is the bottom line.
It hasn't hurt that Central banks across the globe have moved into economic stimulus mode, the latest being Japan and this past week the BOE which lowered rates and signaled further help could be coming down the road. At the same time, Friday's non-farm payroll report showed a much stronger jobs report than expected, exciting investors who are hoping the US economic picture is better than most have thought.
Interestingly, until recently the NASDAQ was lagging both the Dow and S&P. But that started to change when Apple reported better than expected earnings just when it was showing signs of completely breaking down in late July. And you can see in the chart below that since they reported, AAPL has continued its ascent higher, taking the NASDAQ along for the ride.
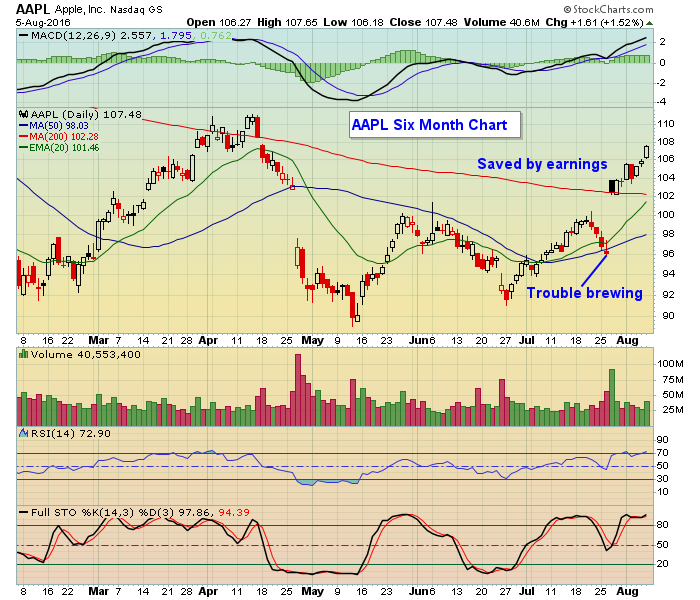
But it wasn't just AAPL's numbers that caught the attention of investors. Facebook, Google and Amazon all beat expectations as well. So it's the collection of better than expected earnings that has powered the market higher.
The renewed interest in stocks has come at a time that historically favors the bears. And some analysts and market observers are asking if equities are over priced, a fair question indeed. So the next few weeks could be important, especially with earnings season nearing an end and as traders look for fresh reasons to stay long.
At EarningsBeats we continuously track earnings and search for those companies that beat expectations, especially since traders gravitate to those stocks that show strong results. If you would like to see a sample of some of our most recent trade alerts to members just click here.
We're now in an historically tough time of the year. Earnings season is winding down. We've got an election coming up in just a few months. Some think the market is nearing a top. These are all important things to take into consideration when trading, making it even more critical than ever to zero in on those stocks that have shown strong earnings results.
- John
 The good news is that I learned about several new technologies that will help us improve our website but - man - attending tech conferences can be a big, expensive pain! Check out the (approximate) costs for this one trip:


 Be sure to register for our upcoming ChartCon 2016 conference in September where I will talk more about Intermarket relationships and where I think the markets are headed next.


 If there's a better way, take it. ...