
|
Today I am pleased to welcome Jean-Francois Owczarczak of FinGraphs.com to the ranks of our "Top Advisors Corner" commentators. Jean-Francois and I have met at the previous two IFTA conferences and over that span of time, he has told me a remarkable tale. His father, Edouard, has been advising bankers in Switzerland since the mid-1960s using purely a technical approach to the markets. In the early days, since there were no computers and certainly no Internet, Edouard would go from bank to bank carrying his hand-drawn charts in his briefcase(!). In 1969, Edouard founded his own management company in which his is still very active. In addition, his sons Jean-Francois and Andre have now joined him and managed to being Edouard's tried and true approach into the 21st century using some unique visualization techniques.
Their approach is so different that, using it, Jean-Francois won the Bronwen Wood Memorial Award from IFTA in 2012 for the best CFTe exam paper that year.
Here's an example of their approach using YHOO:
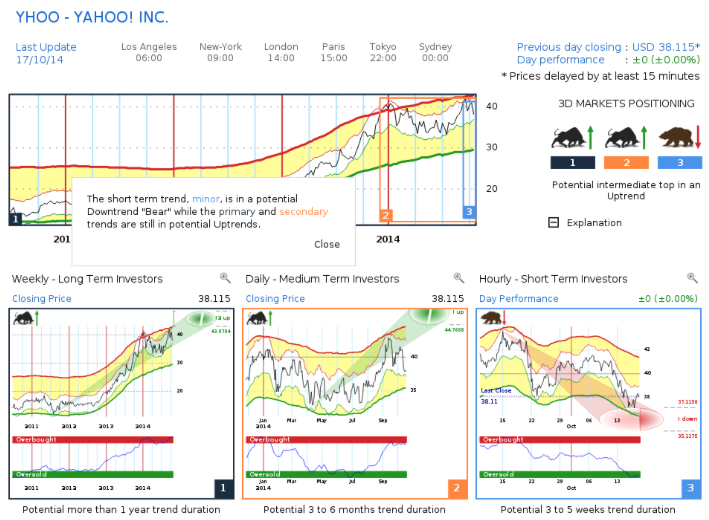
Basically, they look at three different timeframes and determine - based on their yellow channel overlay and their overbought-oversold indicator - whether the stock is bullish or bearish for each of those three timeframes. In the case of Yahoo, the screenshot above shows bullish in the long term, bullish in the mid term, but bearish in the short term. Note that the charts also contain "fuzzy" price projections in either green or red.
To be clear, StockCharts.com does not make stock picks or buy/sell recommendations nor do we use proprietary indicators on our website, so fully integrating something like FinGraphs directly into our website is not possible. That said, we still receive lots requests from our users for stock advice, price targets, etc. So when I saw what FinGraphs provides - a unique, technicals-based visual representation combined with a long, successful track record and a willingness to blog about their system (something VERY unique in the financial advice industry) - I worked with Jean-Francois to find a way to provide FinGraph's proprietary charts and recommendations to those users that want that kind of information. Eventaully we came up with an approach that will allow Jean-Francois to post weekly articles in the "Top Advisors Corner" area of the StockCharts website. His articles will include a special link that gives StockCharts users a nice discount if they decide to subscribe to FinGraphs.
In fact, you can click here right now to see Jean-Francois' first article.
Again, if you are the kind of person that does their own analysis, this is probably not for you. But if you are looking for a different approach - one that is both new and based in classic technical approaches, check out FinGraphs and what Jean-Francois has to say each week in the Top Advisors Corner section of our Blogs area.
- Chip
