Art's Charts November 30, 2009 at 07:14 AM
Friday's decline reversed the short-term uptrend, but the medium-term trend remains up. On the daily chart, SPY has been zigzagging higher the last 3-4 months. After moving above its October high in mid November, SPY stalled around 110 with choppy trading for two weeks... Read More
Art's Charts November 30, 2009 at 07:11 AM
-Bonds show relative strength with a 5-month closing high -Another new low in short-term rates weighs on the Dollar -Gold remains overextended, but still strong -The 5-week downtrend in oil looks like a falling flag -Bonds surge with biggest 2-week surge since November 2008 - Cli... Read More
Art's Charts November 27, 2009 at 07:38 AM
-SPY stalls near resistance -IWM traces out a symmetrical triangle -Medium-term Evidence Remains Bullish -Defensive sectors perking up -Interest rates and the Dow -Bond ETF holds resistance breakout -Click here for the video pag... Read More
Art's Charts November 27, 2009 at 03:28 AM
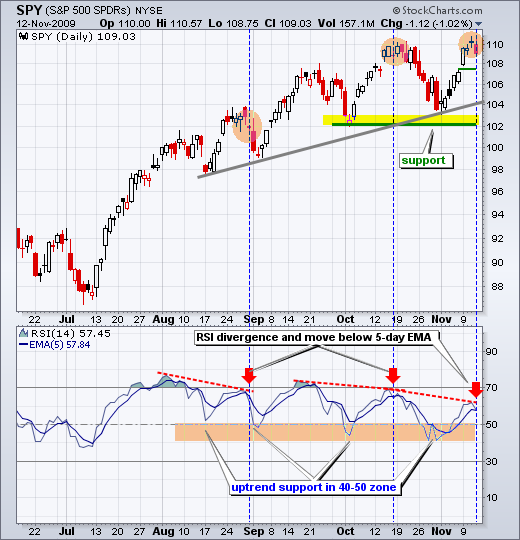
The medium-term trend remains up for SPY, but the going is getting tough around 110. The S&P 500 ETF (SPY) first moved above 110 on November 11th, eleven trading days ago. Since first moving above 110, the ETF has seesawed above and below this level at least four times... Read More
Art's Charts November 27, 2009 at 03:19 AM
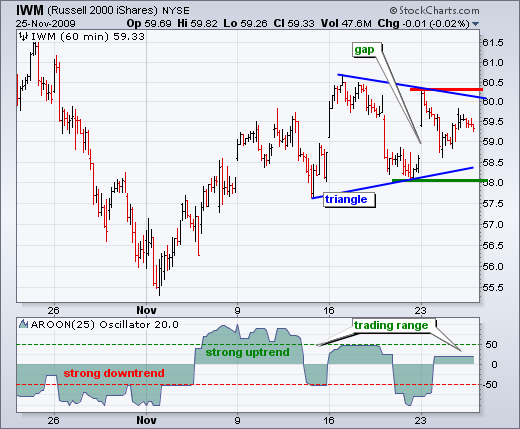
The Russell 2000 ETF (IWM) is stalling with a symmetrical triangle over the last two weeks. Because the prior move was up, there is still a bullish bias overall. However, the ensuing break will determine the next directional signal for IWM... Read More
Art's Charts November 27, 2009 at 03:16 AM
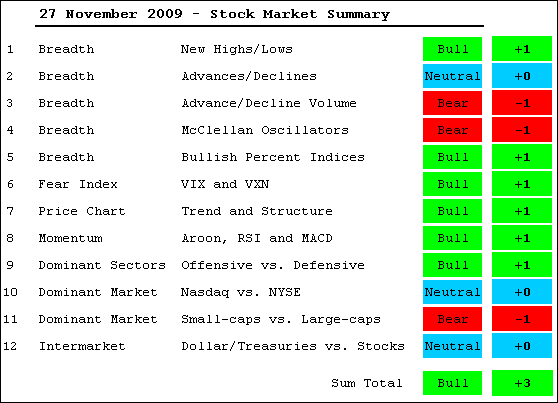
Note that current evidence does not include Friday's trading. The S&P 500 is down around 3% in pre-market trading. This move could be an overreaction in thin trading or more. I will review the table and indicators on Monday as well... Read More
Art's Charts November 27, 2009 at 03:12 AM
-Nasdaq AD Line forms a bearish flag -Nasdaq AD Volume Line forms lower high in November (bearish divergence) -Nasdaq Net New Highs remain positive, but there were fewer in November -NYSE AD Line remains in bull mode and above support -NYSE AD Volume Line forms lower high in Nove... Read More
Art's Charts November 27, 2009 at 03:10 AM
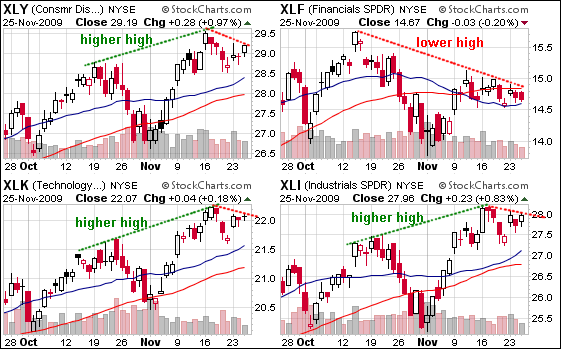
The next two Candleglance groups show the four offensive sectors (technology, finance, industrials, technology) and the three defensive sectors (healthcare, utilities, consumer staples). Three of the four offensive sectors moved to new reaction highs in mid November... Read More
Art's Charts November 27, 2009 at 03:07 AM
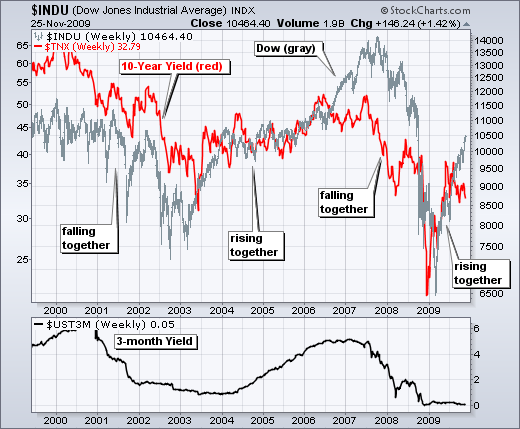
Over the last ten years, there is generally a positive correlation between long-term interest rates and the Dow Industrials. The 10-Year Treasury Yield ($TNX) and the Dow fell from 2000 to 2003, rose from 2003 to 2007, fell from 2007 to 2008 and rose in 2009... Read More
Art's Charts November 27, 2009 at 03:05 AM
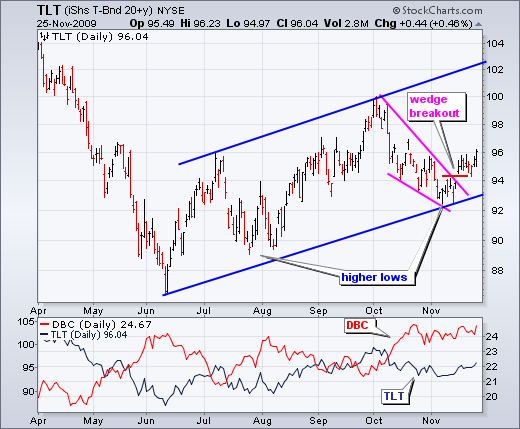
The 20+ Year Treasury ETF (TLT) continues to exhibit strength with a wedge breakout. Notice that the ETF broke resistance with a gap above 94. More importantly, notice that this gap is holding and TLT moved higher the last two days... Read More
Art's Charts November 25, 2009 at 04:55 AM
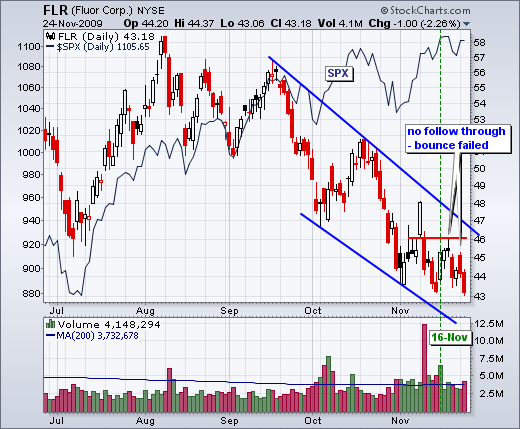
Based on the November 16th close, Fluor (FLR) was featured after the stock bounced on good volume. Even though FLR was still in a downtrend, it was at retracement support and the bounce occurred on good volume. This bounce has now failed... Read More
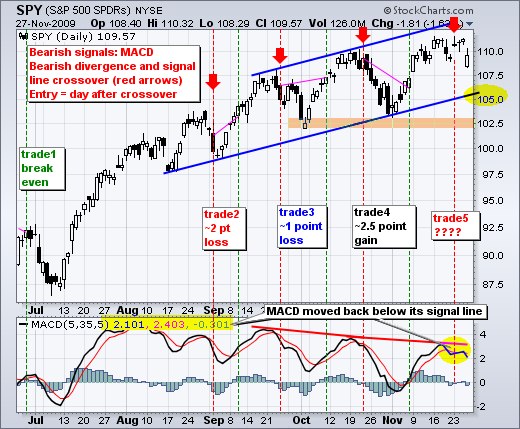
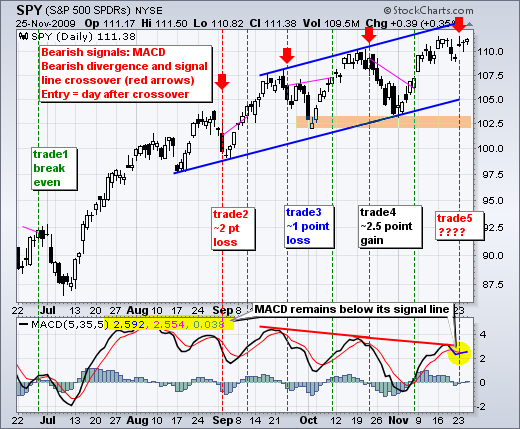
Art's Charts November 25, 2009 at 04:26 AM
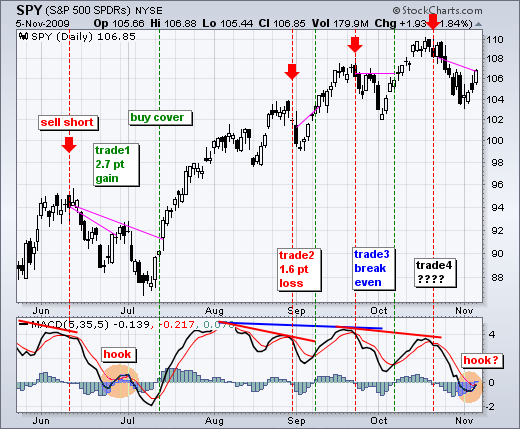
I am showing three charts for the S&P 500 ETF (SPY) today. The first shows daily candlesticks with MACD(5,35,5). SPY is trending up with higher highs and higher lows, but MACD(5,35,5) is trending down with lower highs and lower lows... Read More
Art's Charts November 24, 2009 at 09:12 AM
-SPY gaps off support -MACD(5,35,5) crossover signal for SPY -T-Bill rate near zero again -Financials SPDR lags overall market -3 key banks to watch (GS,JPM,STT) -Gold gets frothy on the daily chart -US Dollar Index remains in downtrend -Bullish flag in oil extends -30-year Treas... Read More
Art's Charts November 24, 2009 at 08:06 AM
Intermarket highlights include: -Gold continues to lead the intermarket group -Gold is looking frothy on the daily chart -Look for a break above 76 to show strength in the Dollar... Read More
Art's Charts November 24, 2009 at 07:38 AM
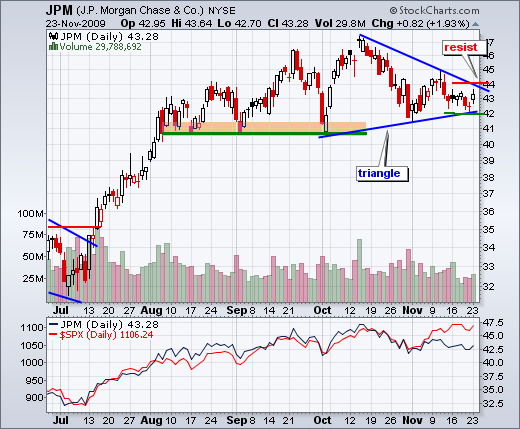
JP Morgan Chase (JPM) is the biggest holding (12.08%) in the Financials SPDR (XLF). As with XLF, JPM is showing relative weakness as it trades well below its October high. The stock is currently testing support from the triangle trendline extending up from the October low... Read More
Art's Charts November 24, 2009 at 06:29 AM
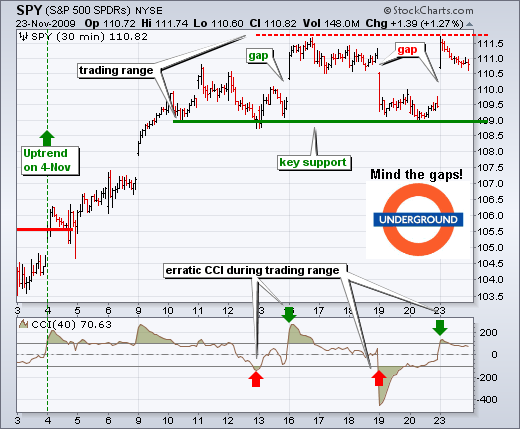
With another gap-surge on Monday, SPY has gapped up the last four Mondays (November 4, 9, 16 and 23). The first three gaps were part of an uptrend, but the fourth occurred within a trading range. Also notice that SPY gapped up-down-up over the last six trading days... Read More
Art's Charts November 24, 2009 at 06:21 AM
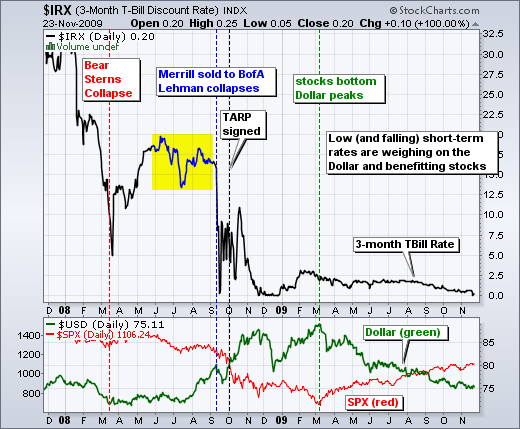
I featured the 3-month T-Bill Rate ($IRX) near zero last Wednesday and Mark Hulbert wrote about this phenomenon in is commentary for Tuesday. Based on my analysis, low short-term rates reflect Fed policy and put downward pressure on the Dollar... Read More
Art's Charts November 24, 2009 at 06:12 AM
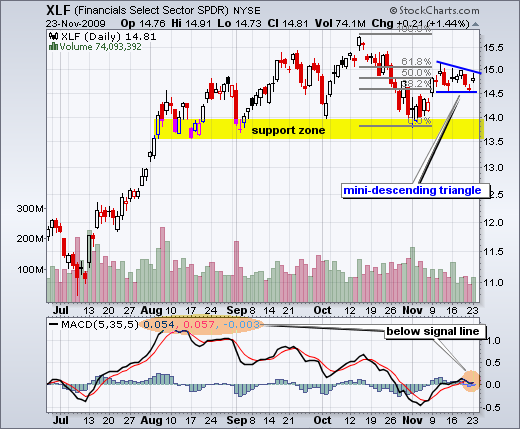
While the Dow and S&P 500 moved to new reaction highs in November, the Financials SPDR (XLF) remains well below its October high. XLF is clearly not keeping pace with the broader market. Such relative weakness can foreshadow absolute weakness and a potential break down... Read More
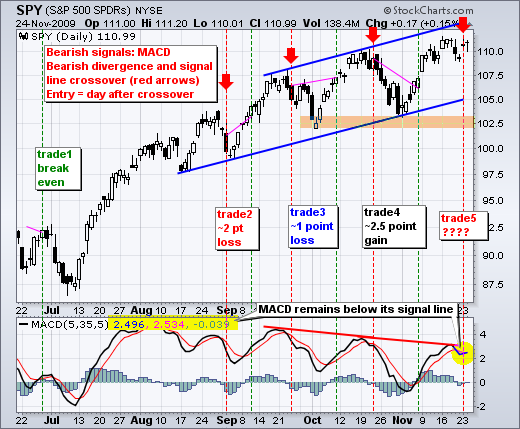
Art's Charts November 23, 2009 at 06:36 AM
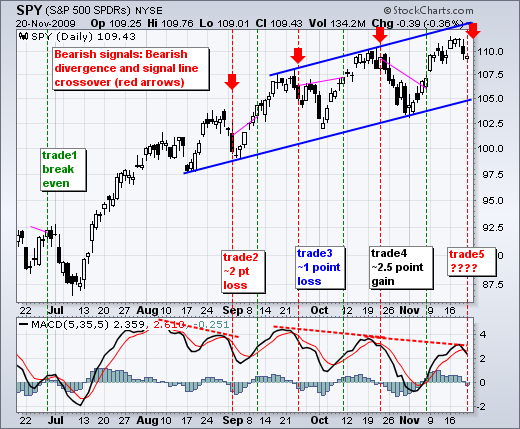
With a little weakness on Friday, SPY broke below flag support on the 30-minute chart and MACD(5,35,5) moved below its signal line on the daily chart. First, let's look at the daily chart... Read More
Art's Charts November 20, 2009 at 10:26 AM
-Performance anxiety and seasonality -The split-month pattern in SPY -Bear flags on the 30-minute charts -Medium-term Evidence Remains Bullish -Breadth is mixed overall -Bullish% for consumer discretionary sector lags -VIX forms inverse head-and-shoulders -SPY momentum remains bu... Read More
Art's Charts November 20, 2009 at 09:19 AM
Tops are complicated beasts that usually take time to evolve. Bottoms, on the other hand, form quicker and often feature some sort of quick "V" reversal. Stocks are well off their March lows after a powerful rally the last nine months... Read More
Art's Charts November 20, 2009 at 09:16 AM
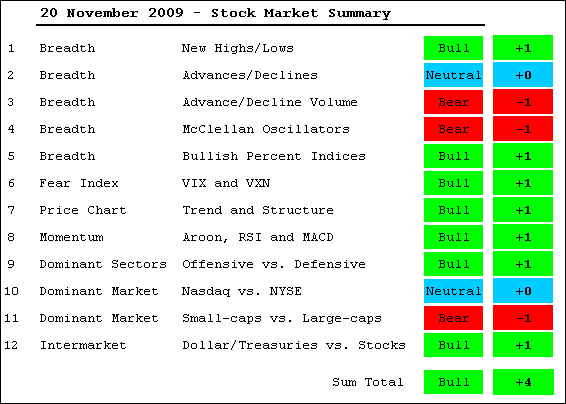
The warnings signs continue, but the bulk of the medium-term evidence remains bullish. On the negative side, breadth has been deteriorating the last few weeks. Small-caps and the finance sector have been relatively week since October... Read More
Art's Charts November 20, 2009 at 06:02 AM
-Nasdaq AD Line forms bear flag and hits resistance -Nasdaq AD Volume failed to confirm new reaction high in the Nasdaq -Nasdaq Net New Highs were weaker in November, but still positive overall -NYSE AD Line bounced off support and remains in bull mode -NYSE AD Volume line failed... Read More
Art's Charts November 20, 2009 at 05:29 AM
There is an interesting pattern taking shape on the daily charts of the major index ETFs. In September and October, notice how SPY advanced in the first half of the month and fell in the second half of the month. This is also the case for DIA, IWM and QQQQ... Read More
Art's Charts November 20, 2009 at 05:28 AM
Stocks gapped down and pretty much stayed down on Thursday. After gapping up on Monday, SPY traded flat for three days and then gapped down on Thursday... Read More
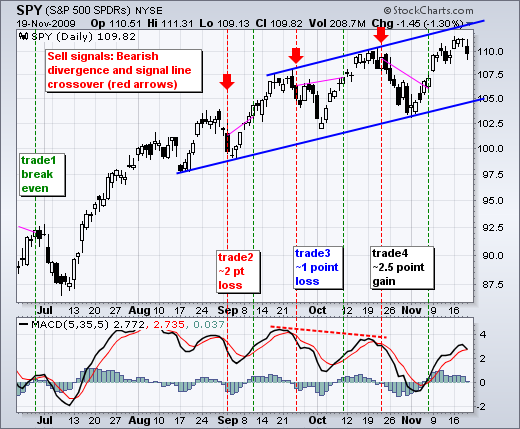
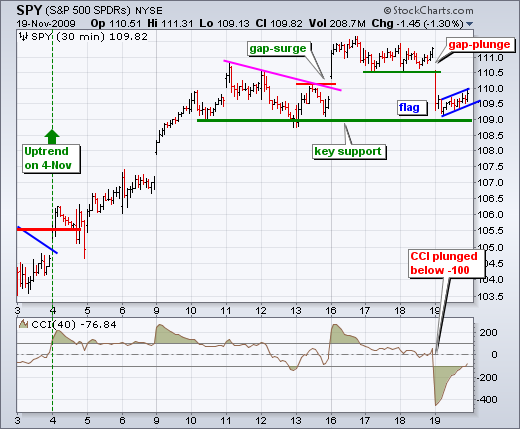
Art's Charts November 19, 2009 at 06:24 AM
SPY gapped up and moved above its October high on Monday to affirm the medium-term uptrend with a higher high. The gap is holding as SPY trades comfortably above 110. In addition, the Stochastic Oscillator remains above 80 for the second week... Read More
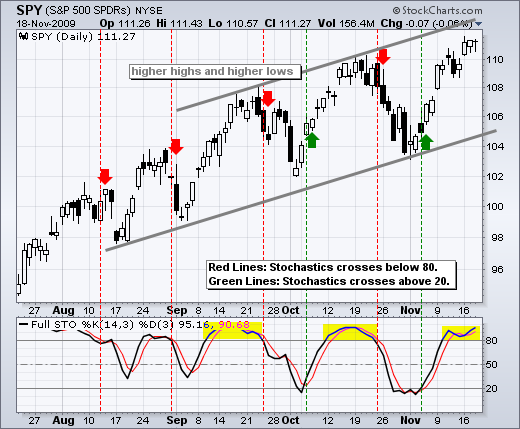
Art's Charts November 18, 2009 at 03:34 AM
The S&P 500 ETF (SPY) remains in a medium-term uptrend as it approaches the upper trendline of the rising channel. This trendline extends to around 112 this week and SPY could hit this level before starting a downswing... Read More
Art's Charts November 17, 2009 at 08:18 AM
-SPY Nears Channel Resistance -Regional banks and the finance sector -US Bancorp (USB) hits momentum-of-truth -A bearish engulfing for Limited (LTD) -Xerox (XRX) consolidates after surge -Ciena (CIEN) surges on good volume -Fluor (FLR) bounces off key retracement - Click here for... Read More
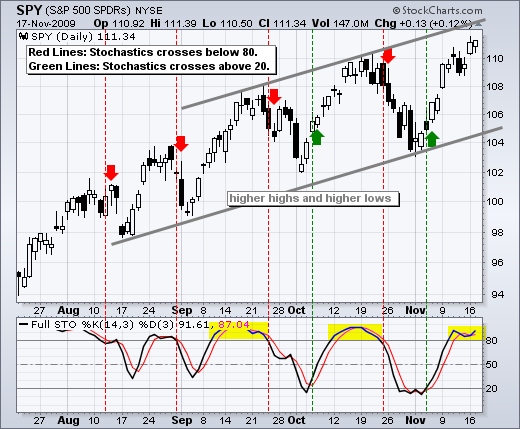
Art's Charts November 17, 2009 at 07:39 AM
The S&P 500 ETF (SPY) gapped up and closed strong to forge a higher high on Monday. The ETF has been channeling higher since August with a series of higher highs and higher lows... Read More
Art's Charts November 17, 2009 at 07:38 AM
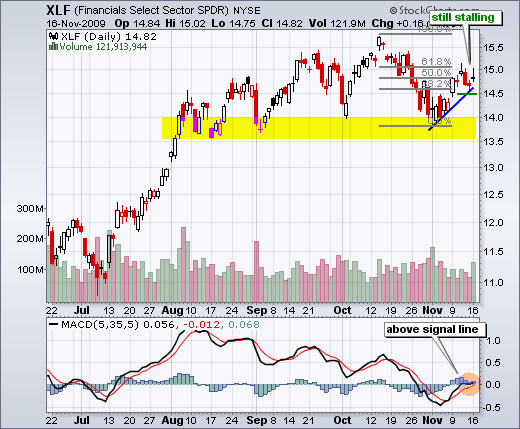
The Regional Bank SPDR (KRE) was a boon to the market in late July and early August, but under performed the market from early August to mid November. In contrast, the Financials SPDR (XLF) performed in line with the market as it went on to new highs in September and October... Read More
Art's Charts November 17, 2009 at 07:30 AM
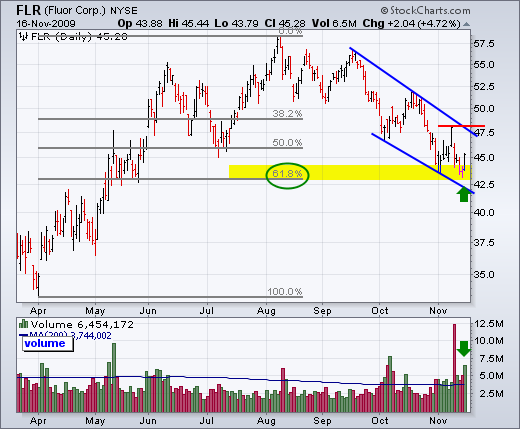
Even though Fluor has been trending lower since the August high, the decline looks like a correction after the April-August advance. First, the advance was big and some sort of correction or pullback can be expected... Read More
Art's Charts November 17, 2009 at 07:29 AM
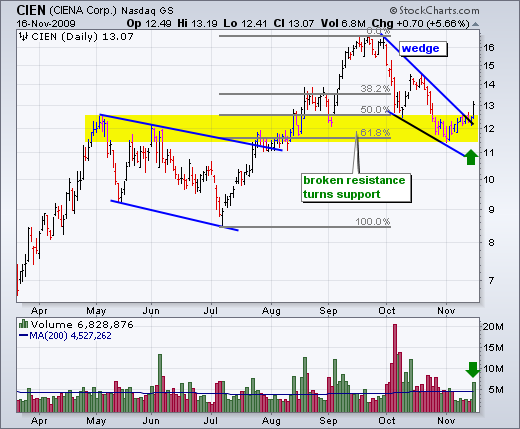
Ciena is showing strength with a high volume wedge breakout. The stock surged from July to September and then corrected with a falling wedge the last two months. Sorry, no prizes for guessing how much this wedge retraced... Read More
Art's Charts November 17, 2009 at 07:28 AM
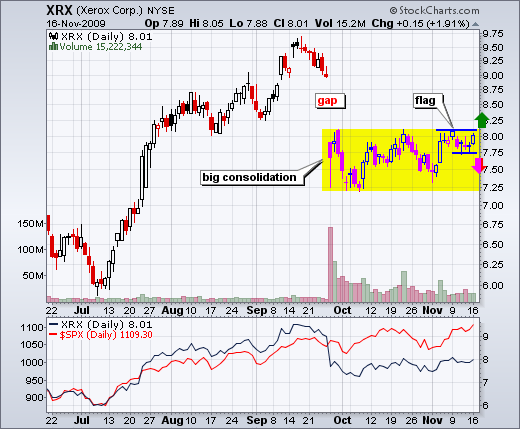
After a big gap down in late September, Xerox established support around 7.25 and consolidated the last seven weeks. Within this consolidation, the stock surged in early November and then formed a flat flag. I am watching this pattern for clues on the next move... Read More
Art's Charts November 17, 2009 at 07:27 AM
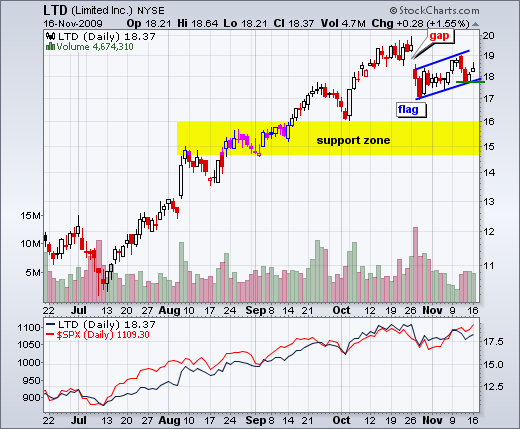
I featured Limited (LTD) two weeks ago with a small pennant, but the stock never broke pennant support for confirmation. Even though LTD edged higher, it looks like a bearish flag is now taking shape. The stock gapped down in late October and this gap zone acts as resistance... Read More
Art's Charts November 17, 2009 at 07:25 AM
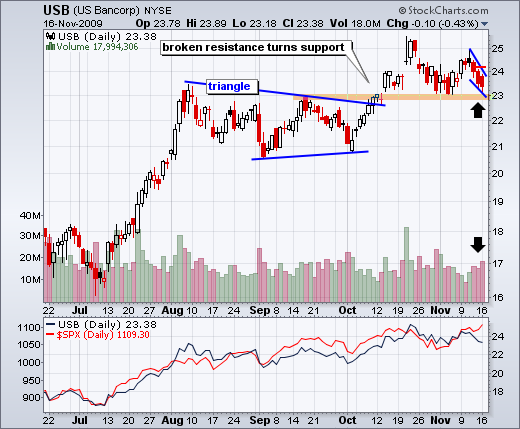
US Bancorp (USB) broke triangle resistance in mid October and broken resistance turned into support around 23. Even though the breakout is still holding, relative weakness in November is a concern here. SPY is up over 7% this month, but USB is down slightly... Read More
Art's Charts November 16, 2009 at 07:41 AM
-Gold remains the strongest of the five intermarket securities -The Dollar is at it again with a RSI divergence and harami on Thur-Friday -Broken resistance around 1070 turns into first support for gold -Oil formed a bull flag over the last few weeks -Bonds continue to hold suppo... Read More
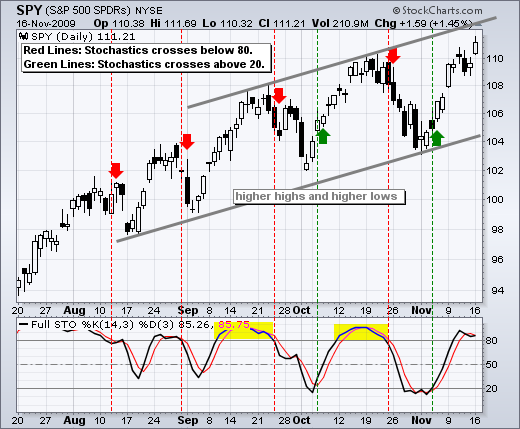
Art's Charts November 16, 2009 at 06:11 AM
Despite a gain for the week, overall price action for the S&P 500 ETF (SPY) was indecisive last week. SPY surged Monday, stalled for two days, declined sharply on Thursday and stalled on Friday... Read More
Art's Charts November 13, 2009 at 09:08 AM
-Short-term RSI signal for SPY -Medium-term evidence remains bullish -AD Volume Lines fall short -Net New Highs diminish -Small-caps lag -Finance sector lags -VIX nears October lows -Short-term rates hit new low -Wave 4 advance remains in place... Read More
Art's Charts November 13, 2009 at 08:00 AM
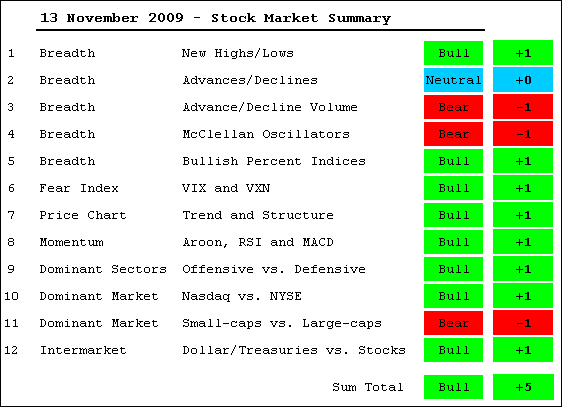
Despite some warning signs, the bulk of the medium-term evidence remains bullish for stocks. Only three indicators are in bear mode... Read More
Art's Charts November 13, 2009 at 07:54 AM
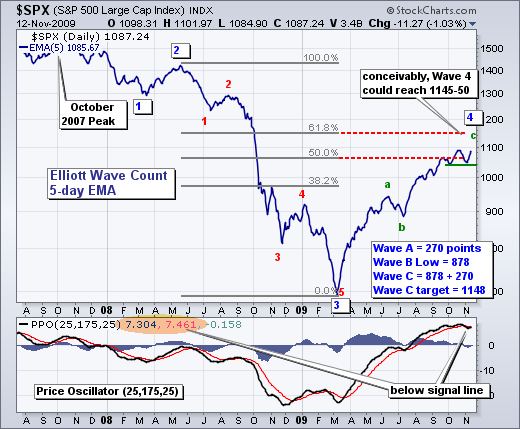
Nothing has changed regarding my interpretation of the Elliott Wave counts for the Nasdaq and S&P 500. Both indices are in Wave 4 advances or a 5 Wave decline. The Wave 4 target zone for the S&P 500 is 1080-1150, while the target zone for the Nasdaq is 2100-2200... Read More
Art's Charts November 13, 2009 at 05:05 AM
There are some potential warning signs in the breadth indicators. First, the Nasdaq AD Volume Line and the NYSE AD Volume Line both bounced, but remain well below their October highs. Lower highs could be forming... Read More
Art's Charts November 13, 2009 at 04:23 AM
After a sharp advance, I noted how doji can sometimes foreshadow a reversal. Doji signal indecision as the bulls and bears battle it out for control. What happens after the doji produces the winner. With yesterday's decline, one could argue that the bears now have the upper hand... Read More
Art's Charts November 12, 2009 at 09:47 AM
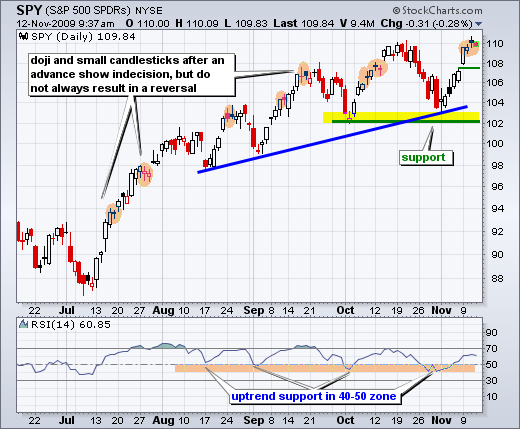
There is no change in the SPY analysis. Stocks stalled over the last two days with SPY forming two doji. These signal indecision and can sometimes foreshadow a short-term reversal. At this point, I consider this indecision as a rest within the short-term and medium-term uptrends... Read More
Art's Charts November 11, 2009 at 03:08 AM
After a 5+ percent surge the prior five days, stocks took a breather on Tuesday as the S&P 500 ETF (SPY) formed a doji on the day. Doji are small candlesticks that look like a plus sign (+). They show little change from open to close and a relatively tight high-low range... Read More
Art's Charts November 10, 2009 at 08:46 AM
-SPY challenges October highs -Defining the short-term uptrend for SPY -Impressive breadth for NYSE, not for Nasdaq -Low volume rally the last three days -XLF and WFC surge off support -XHB and KBH firm at key retracements -Click here for video pag... Read More
Art's Charts November 10, 2009 at 07:42 AM
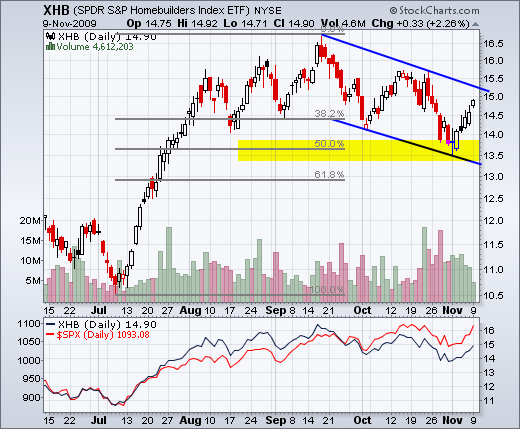
The homebuilders have been relatively weak since mid September. While SPY is within striking distance of a new high for the year (2009), the Homebuilders SPDR (XHB) remains well below its September and October highs... Read More
Art's Charts November 10, 2009 at 06:50 AM
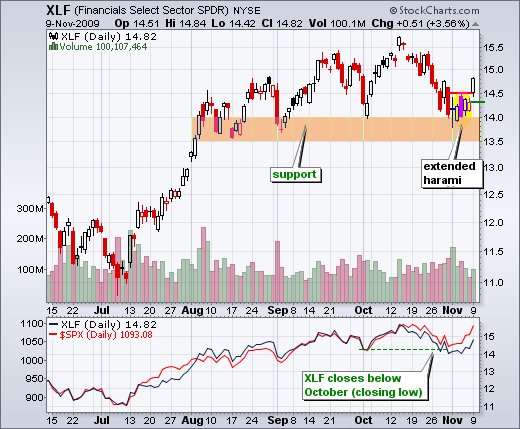
The Financials SPDR (XLF) confirmed last week's harami with a gap breakout. XLF hit support in late October and formed a big spinning top on November 2nd. With the short-term trend down, the stock formed a long red candlestick on Wednesday and two inside days on Thursday-Friday... Read More
Art's Charts November 10, 2009 at 06:09 AM
Breadth and volume are the first ports of call after a big move. Before going any further, I must emphasize that breadth and volume are indicators. I view breadth as an important indicator, more important than volume... Read More
Art's Charts November 10, 2009 at 04:39 AM

With a gap and big advance on Monday, the S&P 500 ETF (SPY) is already challenging resistance from its October highs. I would not consider this major resistance, but rather potential resistance because the medium-term and short-term trends are up... Read More
Art's Charts November 09, 2009 at 08:31 AM
Highlights include: -US Dollar Index fails to hold gains as short-term rates decline -Gold surges to new highs and remains leader of the pack -Oil forms a bull flag and continues to benefit from Dollar weakness -A medium-term downtrend for bonds as $USB tests support -Click here ... Read More
Art's Charts November 09, 2009 at 07:58 AM
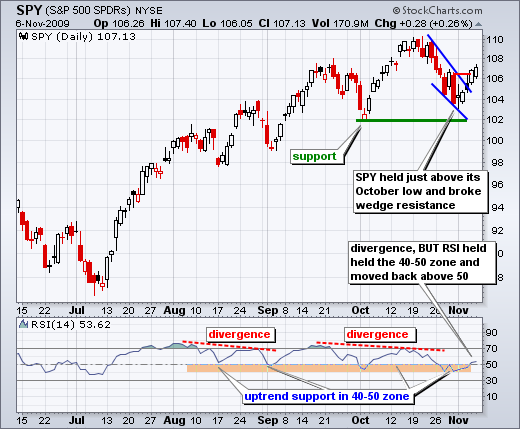
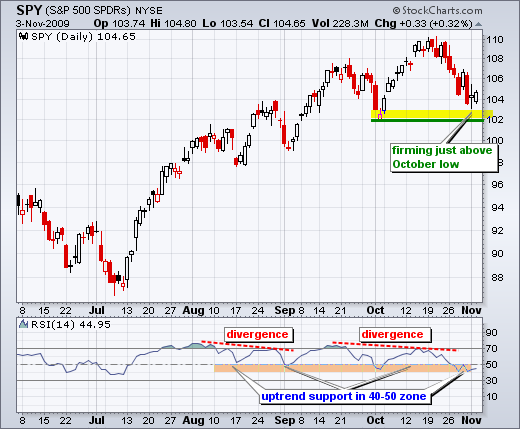
As the headline notes, both the medium-term and short-term trends are up for the S&P 500 ETF (SPY). Yes, SPY held above its early October low and RSI held the 40-50 zone. With a big move on Thursday, SPY broke wedge resistance and RSI moved back above 50... Read More
Art's Charts November 07, 2009 at 11:59 AM
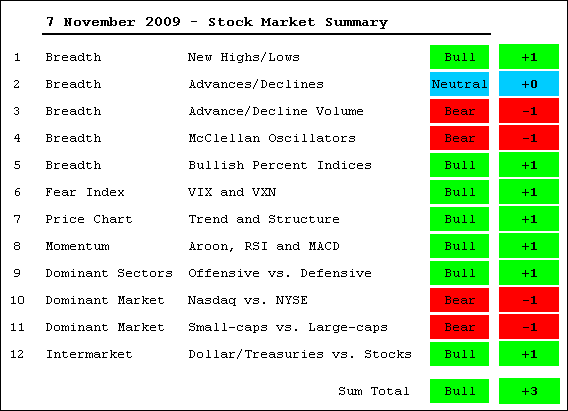
It's the bulls by a nose. After the October decline, the bulk of the medium-term evidence was teetering on the edge of turning bearish. However, a sizable bounce this week brought the bulls back from the brink. As a result, the bulk of the evidence remains bullish... Read More
Art's Charts November 06, 2009 at 10:06 AM
Today's video includes: -A short-term uptrend for SPY -SPY holds medium-term support -Elliott wave for the S&P 500 and Nasdaq -Offensive sectors remain bullish -Long-term rates peak -Short-term rates trending lower -Market Summary Update on Saturday -Click here for the video page... Read More
Art's Charts November 06, 2009 at 08:01 AM
Wall Street is waiting for sparks from the employment report, but we may have already seen the sparks with yesterday's rally. Nevertheless, there is still a chance for a sizable move today (1-2%)... Read More
Art's Charts November 06, 2009 at 07:39 AM
On the market summary table, I watch offensive sectors closely for clues on the overall market. Offensive sectors should keep pace with the market (S&P 500) during a bull run. Relative weakness or a bearish divergence would show underlying weakness... Read More
Art's Charts November 06, 2009 at 07:07 AM
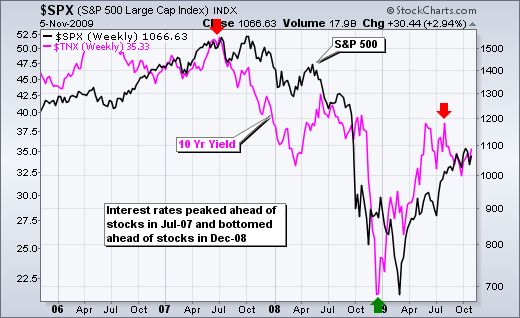
The 10-Year Treasury Yield ($TNX) is largely positively correlated with the S&P 500 - and also shows a propensity to lead the stock market. Notice how the 10-Year Treasury Yield peaked in July 2007 and stocks peaked in October 2007 (3 months later)... Read More
Art's Charts November 06, 2009 at 05:49 AM
-Six of the eight indicators are bearish -Nasdaq breadth is bearish -NYSE breadth is mixed -Click here for the breadth charts pag... Read More
Art's Charts November 06, 2009 at 05:12 AM
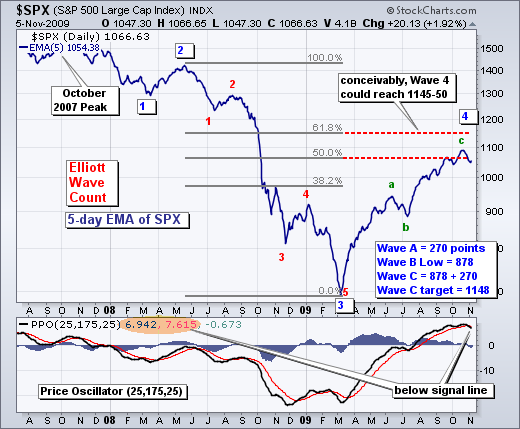
The S&P 500 remains in a Wave 4 advance of a 5 Wave decline. I expect (think) Wave 4 will end in the 50-62% retracement zone and there are already signs of a reversal... Read More
Art's Charts November 06, 2009 at 04:26 AM
With a bounce over the last four days, MACD (5,35,5) crossed above its signal line on Thursday's close. Red dotted lines mark prior signals when MACD formed a bearish divergence AND crossed below its signal line. The last such signal occurred on October 21st... Read More
Art's Charts November 05, 2009 at 04:13 AM
While I don't like holding myself hostage to fundamental events, we need to be prepared for volatility when market-moving events hit the fan. Sometimes we can predict the news, such as the Fed policy statement remaining unchanged... Read More
Art's Charts November 04, 2009 at 04:16 AM
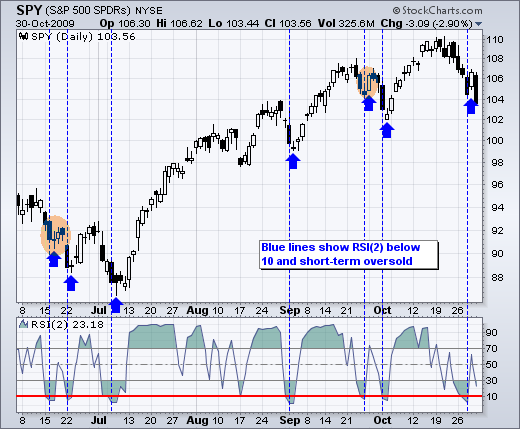
Objectively speaking, the medium-term uptrend in SPY remains in place. The ETF forged a higher high in October and has yet to break the early October low. After a sharp decline from 110 to 104, SPY firmed with a spinning top on Monday and a small white candlestick on Tuesday... Read More
Art's Charts November 03, 2009 at 07:27 AM
-A volatile week ahead -Spinning tops and indecision -QQQQ stalls at support -DIA and SPY stall above support -SPY remains in short-term downtrend -KRE breaks support and XLF tests support -XLB and XLI hit double top support -BBY forms bullish falling wedge -Bear flags/pennants f... Read More
Art's Charts November 03, 2009 at 07:23 AM
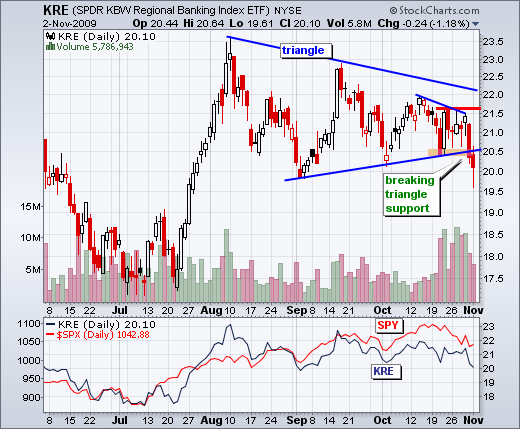
-KRE breaks support and XLF tests support -XLB and XLI hit double top support -BBY forms bullish falling wedge -Bear flags/pennants for JWM, LTD, RL and SBUX **************************************************************** Regional Bank ETF Breakdown The Regional Bank SPDR (KRE) ... Read More
Art's Charts November 03, 2009 at 06:35 AM
SPY formed a spinning top to signal indecision on Monday. Perhaps more importantly, the ETF surged above 105 in early trading and failed to hold these gains. The inability to hold early gains shows weakness. Buyers were not strong enough to hold gains... Read More
Art's Charts November 03, 2009 at 05:33 AM
We can expect above average volatility this week. First, earnings season remains in full swing. Second, the Fed issues its policy statement on Wednesday at 2:15 PM ET. Third, the employment report will be released on Friday at 8:30 AM ET... Read More
Art's Charts November 03, 2009 at 04:21 AM
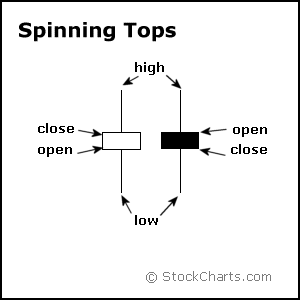
-DIA forms spinning top and bull flag. -QQQQ forms spinning top at support. -IWM forms spinning top below support break. On the daily charts, the major index ETFs finished with spinning top candlesticks on Monday. These show indecision that could foreshadow a short-term bounce... Read More
Art's Charts November 02, 2009 at 08:26 AM
Highlights Include: -Bonds and the Dollar surge as stocks fall -Dollar forms small flag as RSI hits resistance -Triangle support break for gold holds -Bonds bounce off key support -Click here for intermarket chart pag... Read More
Art's Charts November 02, 2009 at 08:23 AM
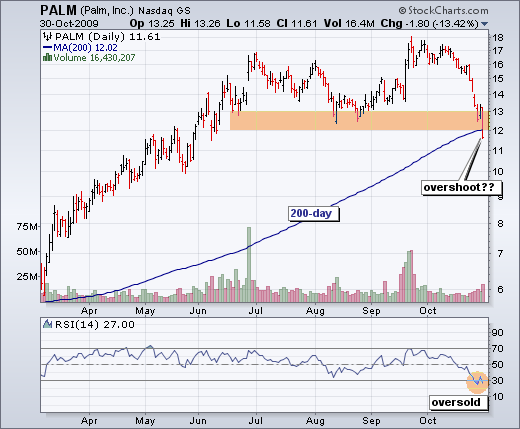
With talk and release of the Pre, Palm was the talk of the town earlier this year. The stock tripled from its March low to its September high. October has been a rough month as PALM fell below 12 on Friday... Read More
Art's Charts November 02, 2009 at 08:01 AM
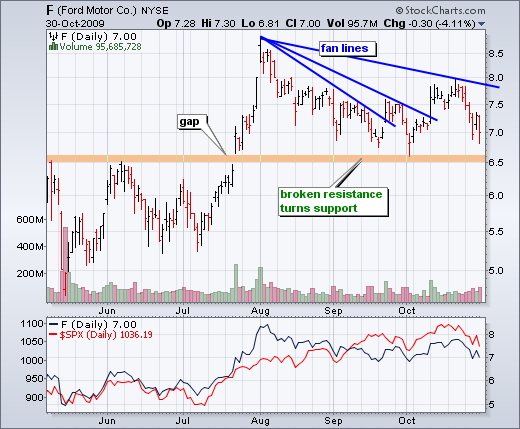
Ford (F) beat earnings estimates this morning as the stock tests an important support area around 6.5-7. After breaking resistance with a big surge in July, the stock returned to broken resistance in September-October... Read More
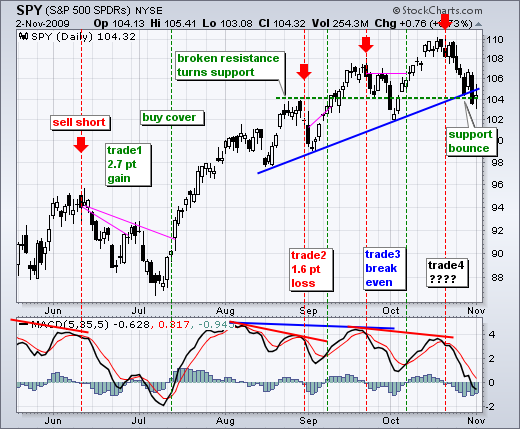
Art's Charts November 02, 2009 at 06:54 AM
After a pretty good bounce on Thursday, stocks gave it all back with an even bigger decline on Friday. This kind of price action is not normal for a bull market or medium-term uptrend. First, Thursday's bounce only lasted one day... Read More