ChartWatchers May 22, 2016 at 03:20 AM
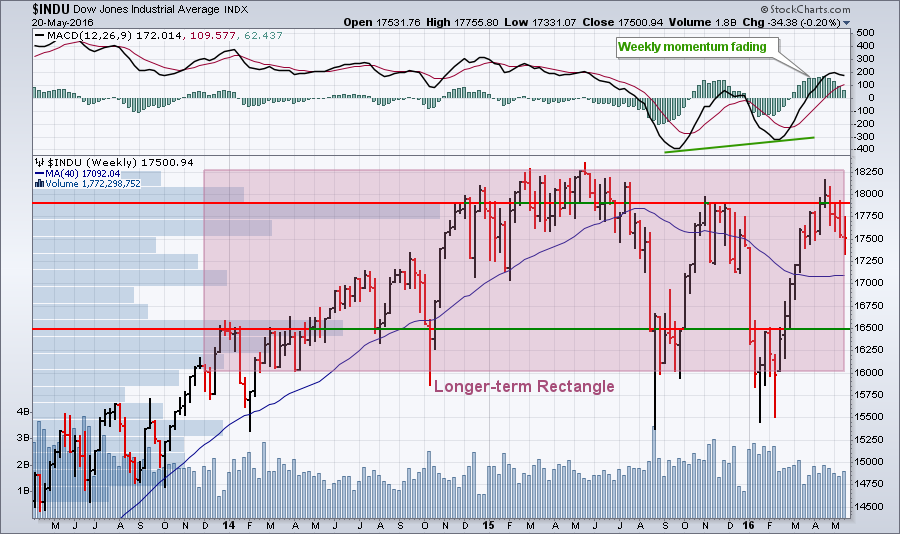
Hello Fellow ChartWatchers! Short Version: The Dow continues moving lower. The upcoming death of Flash means everyone is getting the new version of ChartNotes. You really need to sign up for ChartCon 2016 soon... Read More
ChartWatchers May 22, 2016 at 02:08 AM
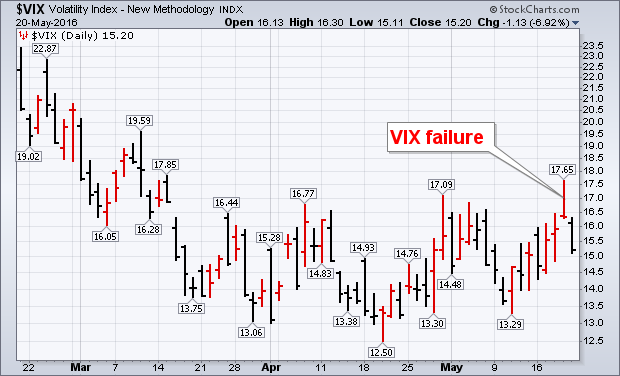
My Thursday morning message showed the Volatility Index (VIX) trying to break through resistance near 17. It rose as high as 17.65 intra-day which was the highest level in two months. Fortunately, it wasn't able to close there... Read More
ChartWatchers May 21, 2016 at 07:45 PM
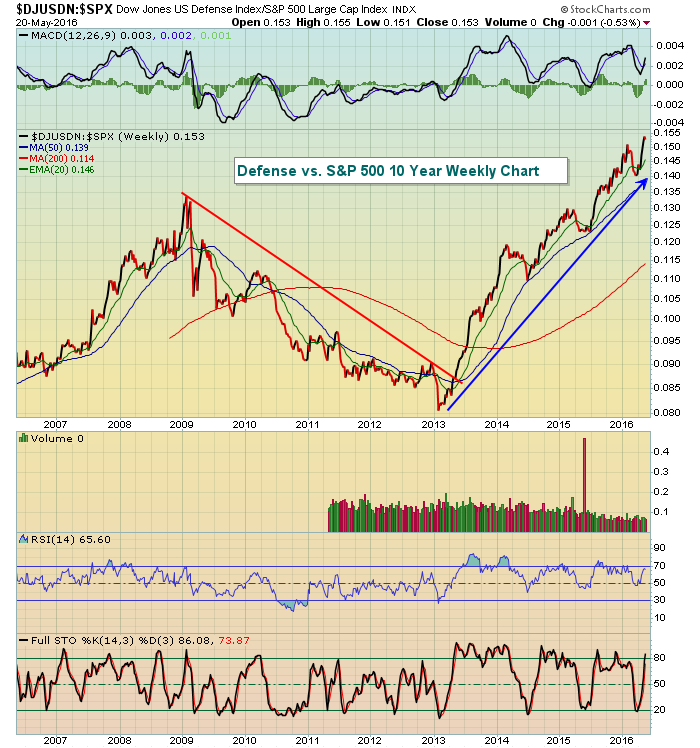
The Dow Jones U.S. Defense Index has been annihilating its competition for the past few years. It's very clear if you take a look at a longer-term relative performance chart. Check this out: This is an interesting chart... Read More
ChartWatchers May 21, 2016 at 03:49 PM
In my last ChartWatchers article I pointed to the importance of taking a time out now and then to analyze trading habits. I referred to it as a "Trading Tune Up"... Read More
ChartWatchers May 21, 2016 at 02:33 AM
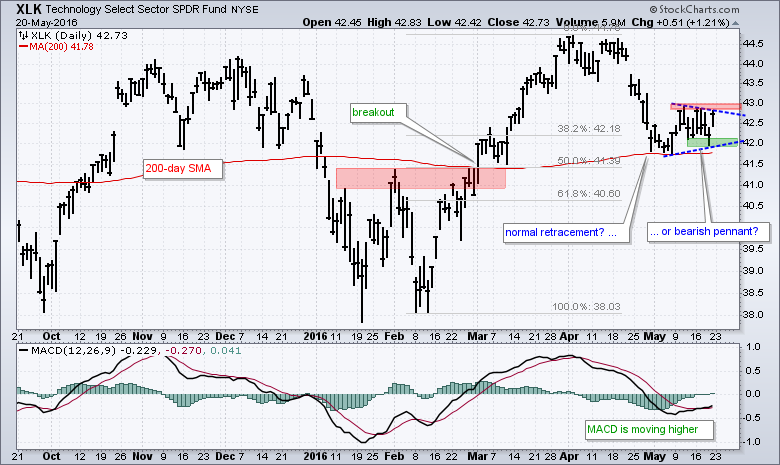
It has been a wild ride for the Technology SPDR (XLK) since August, but the ETF is showing signs of strength by holding the 200-day moving average in May. The red line shows the 200-day SMA dissecting the chart in the 41.5-42 area... Read More
ChartWatchers May 21, 2016 at 12:56 AM
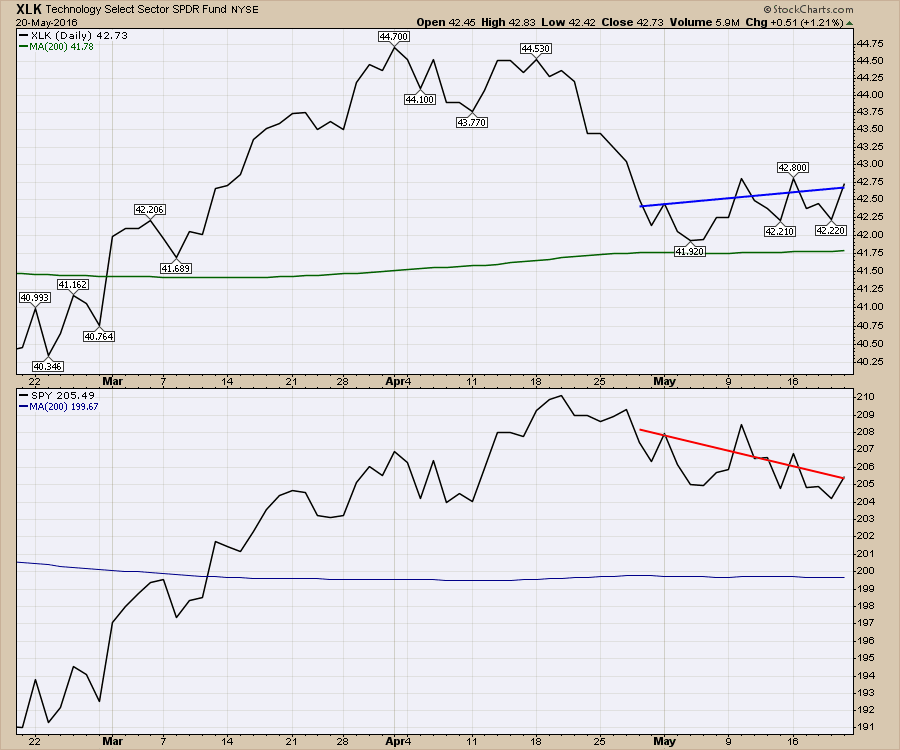
Technology has been one of the worst-performing sectors recently. However, over the last three weeks, the Tech sector represented by the SPDR ETF (XLK) has been performing slightly better than the SPX. Scanning through the carnage, I found lots of interesting charts... Read More
ChartWatchers May 20, 2016 at 09:51 PM
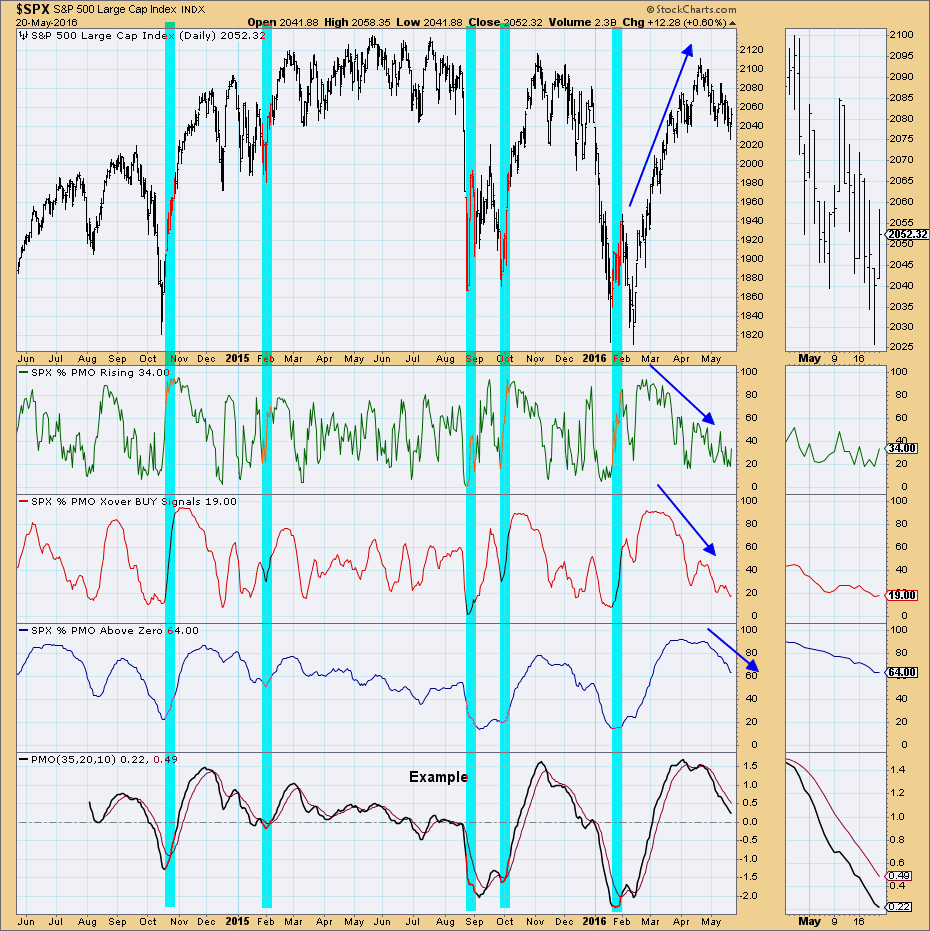
During today's webinar, my "Bonus Indicator Chart" was the Price Momentum Oscillator (PMO) Analysis chart for the SPX. It reveals that it doesn't have the internal strength necessary (yet) to rally out of the current declining trend. The NDX is beginning to show signs of life... Read More
ChartWatchers May 07, 2016 at 08:54 PM
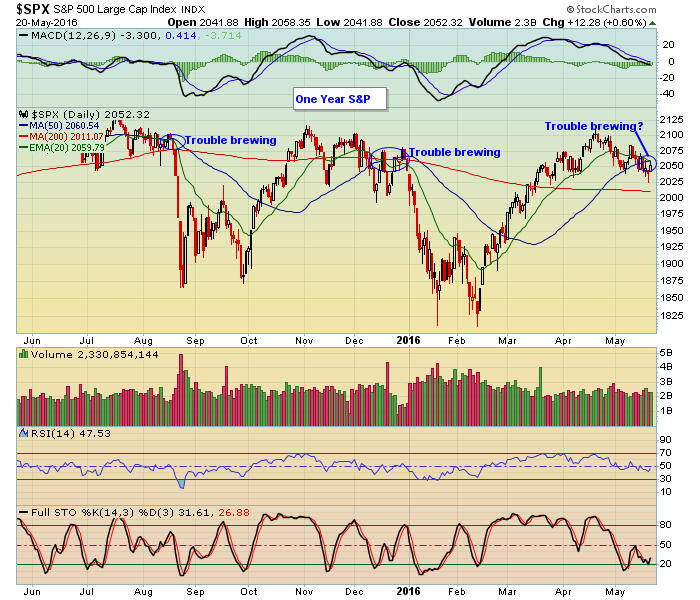
Hello Fellow ChartWatchers! The market moved lower this week, retreating from its failed assault on the highs of last August. Optimists can conclude that more consolidation is needed before the market will be ready to put in new highs... Read More
ChartWatchers May 07, 2016 at 07:22 PM
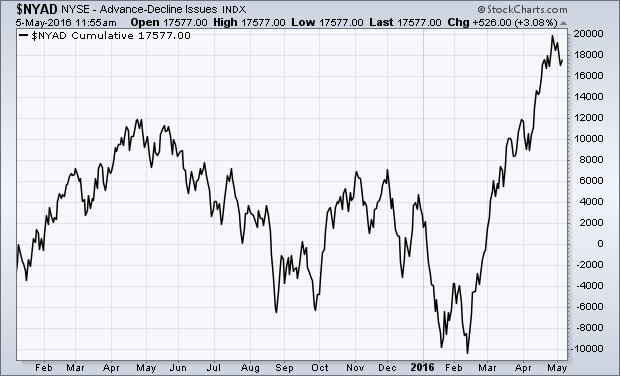
THE TRADITIONAL NYAD LINE HITS NEW RECORD... Chartists look to the NYSE Advance-Decline line to help determine the trend of the stock market. The NYAD line is simply a running cumulative total of the number of advancing stocks minus decliners on the big board... Read More
ChartWatchers May 07, 2016 at 06:29 PM
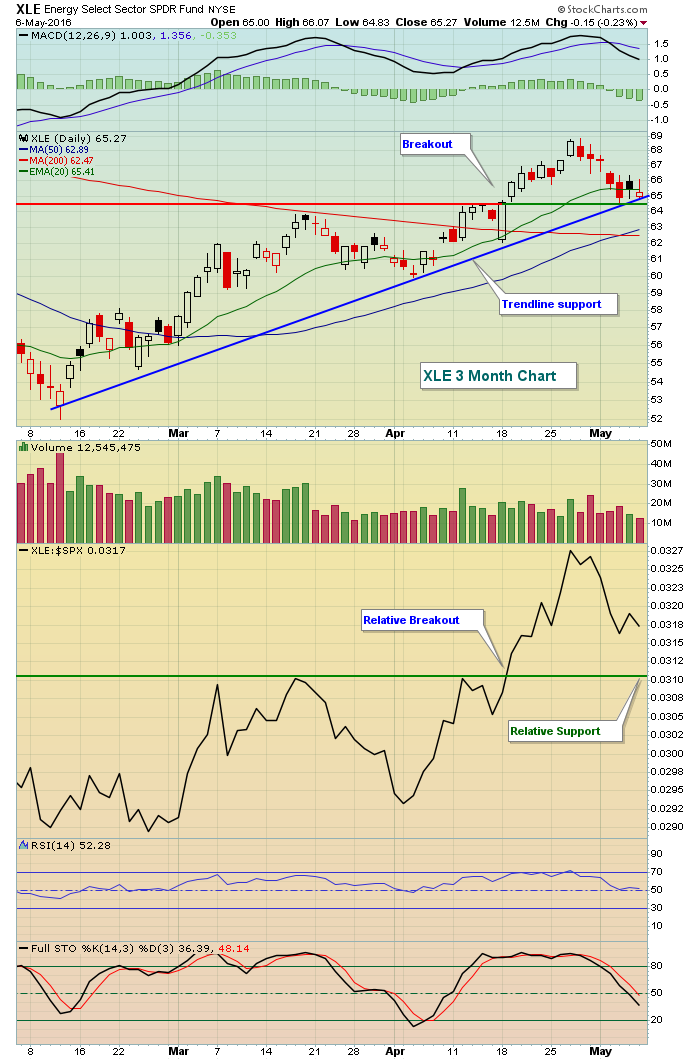
2016 has been a very good year thus far for the energy sector (XLE) as it's gained 17.51% in just the last three months alone... Read More
ChartWatchers May 07, 2016 at 12:29 PM
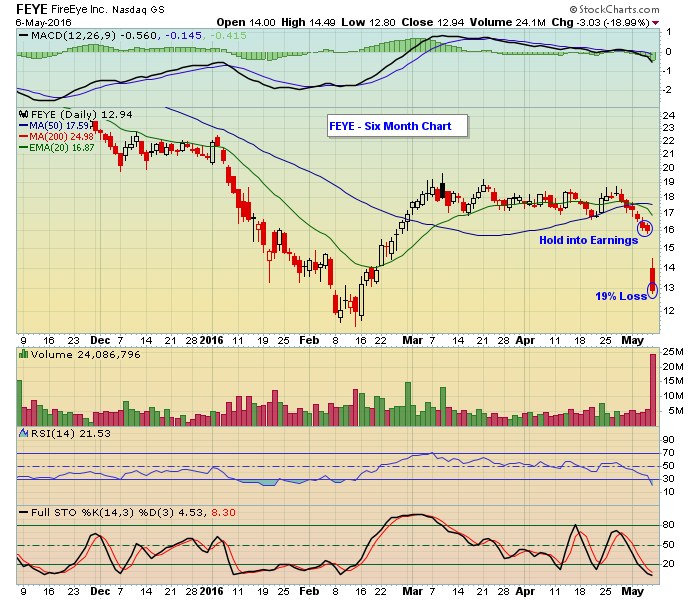
If you've been trading for a decent period of time you know how quickly things can turn against you. Sometimes with no warning, all of the good work you've done seems to disappear and before you know it, profits quickly disappear as well... Read More
ChartWatchers May 07, 2016 at 05:36 AM
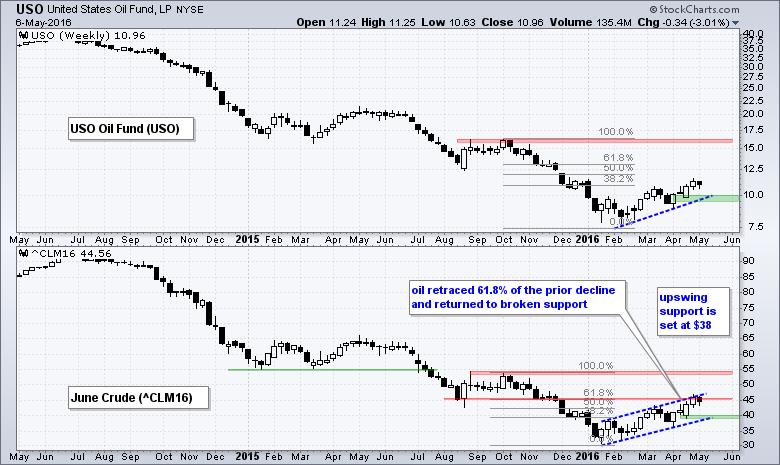
Oil remains in an uptrend this year, but the bigger trend remains down and this could be just a counter-trend bounce. The price chart shows the USO Oil Fund (USO) in the top window and June Crude (^CLM16) in the bottom window... Read More
ChartWatchers May 06, 2016 at 11:03 PM
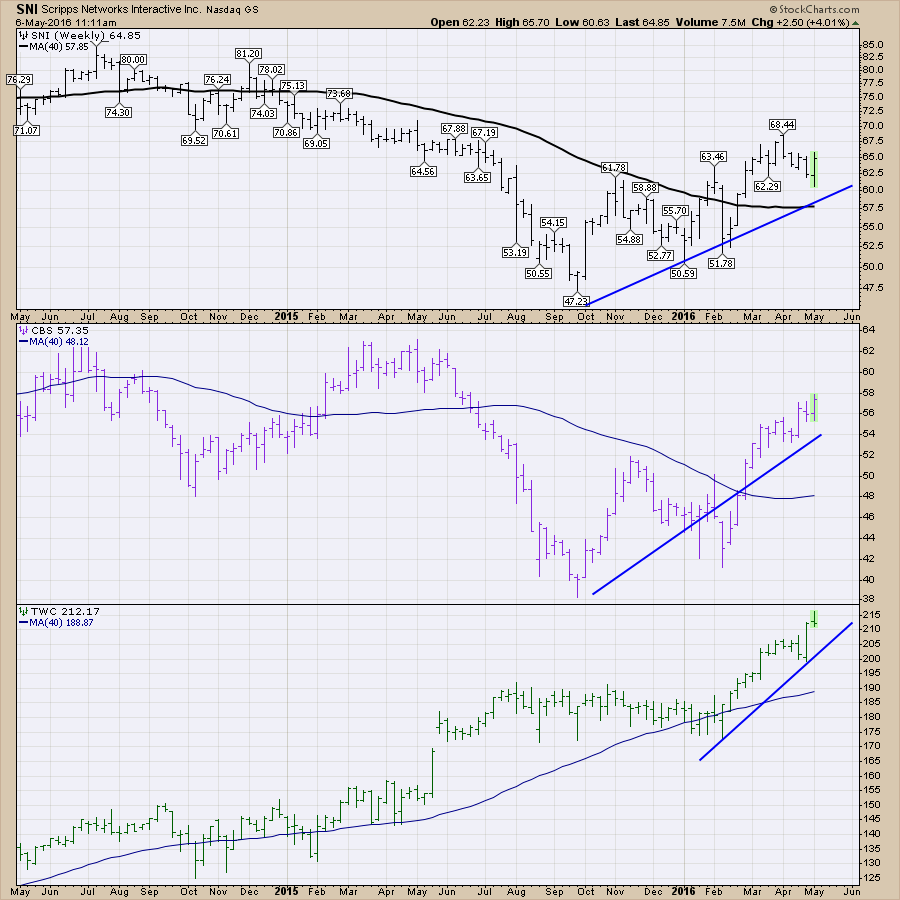
Entertainment is all about watching something exciting. With all the discussion of cord cutting for cable, multiple companies have discussed that they expect to make more money through direct subscription or skinny bundles... Read More
ChartWatchers May 06, 2016 at 09:31 PM
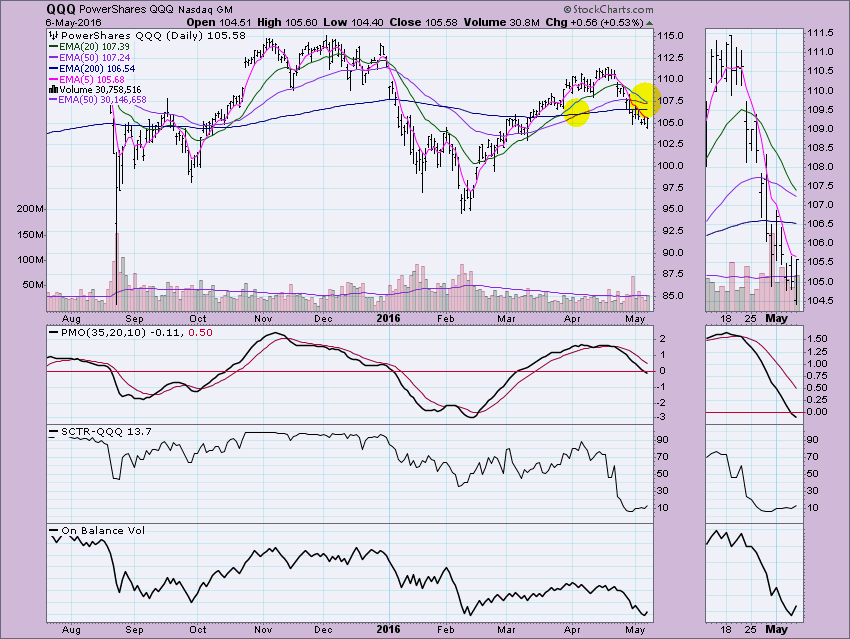
As I reviewed the charts of the Nasdaq 100 with my viewers during webinar today, I started to wonder how the equal-weight version was stacking up against the NDX ETF (QQQ). Typically the equal-weight versions do better over time than their cap-weighted counterparts... Read More