ChartWatchers May 31, 2019 at 07:58 PM
The market has been under fire for some time now as uncertainty abounds. Even a lot of stocks that had earlier reported strong earnings haven't been able to escape the recent market turmoil... Read More
ChartWatchers May 31, 2019 at 04:41 PM

The 200-day moving averages for the S&P Mid-Cap 400 and the S&P Small-Cap 600 are already trending lower and this key moving average for the S&P 500 turned lower over the past week. This puts all three indexes below their falling 200-day SMAs and in potential downtrends... Read More
ChartWatchers May 31, 2019 at 12:57 PM
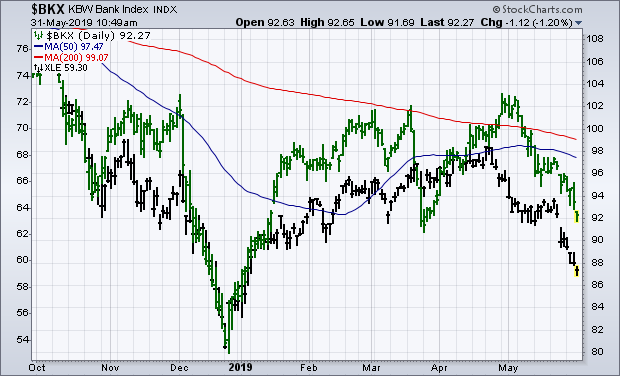
Editor's Note: This article was originally published in John Murphy's Market Message on Friday, May 31st at 11:14am ET. Energy stocks are one of the weakest parts of the market. So are bank stocks. There may be a reason why... Read More
ChartWatchers May 24, 2019 at 08:30 PM
We’re in a difficult period with the markets at the moment, as uncertainty surrounding U.S.- China trade talks is weighing heavily on stocks... Read More
ChartWatchers May 24, 2019 at 06:15 PM
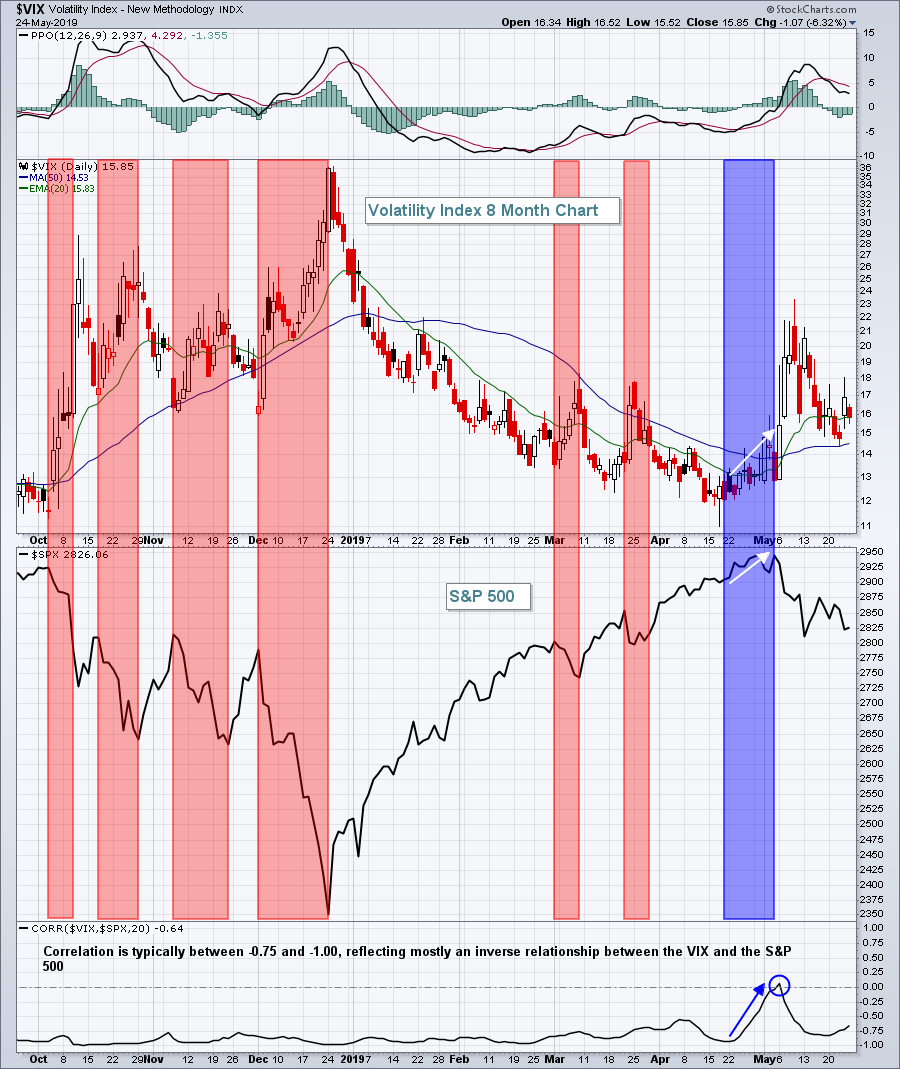
There are no perfect signals that scream "GET OUT" of equities, but there are warning signs.....so long as you know where to find them... Read More
ChartWatchers May 24, 2019 at 04:57 PM
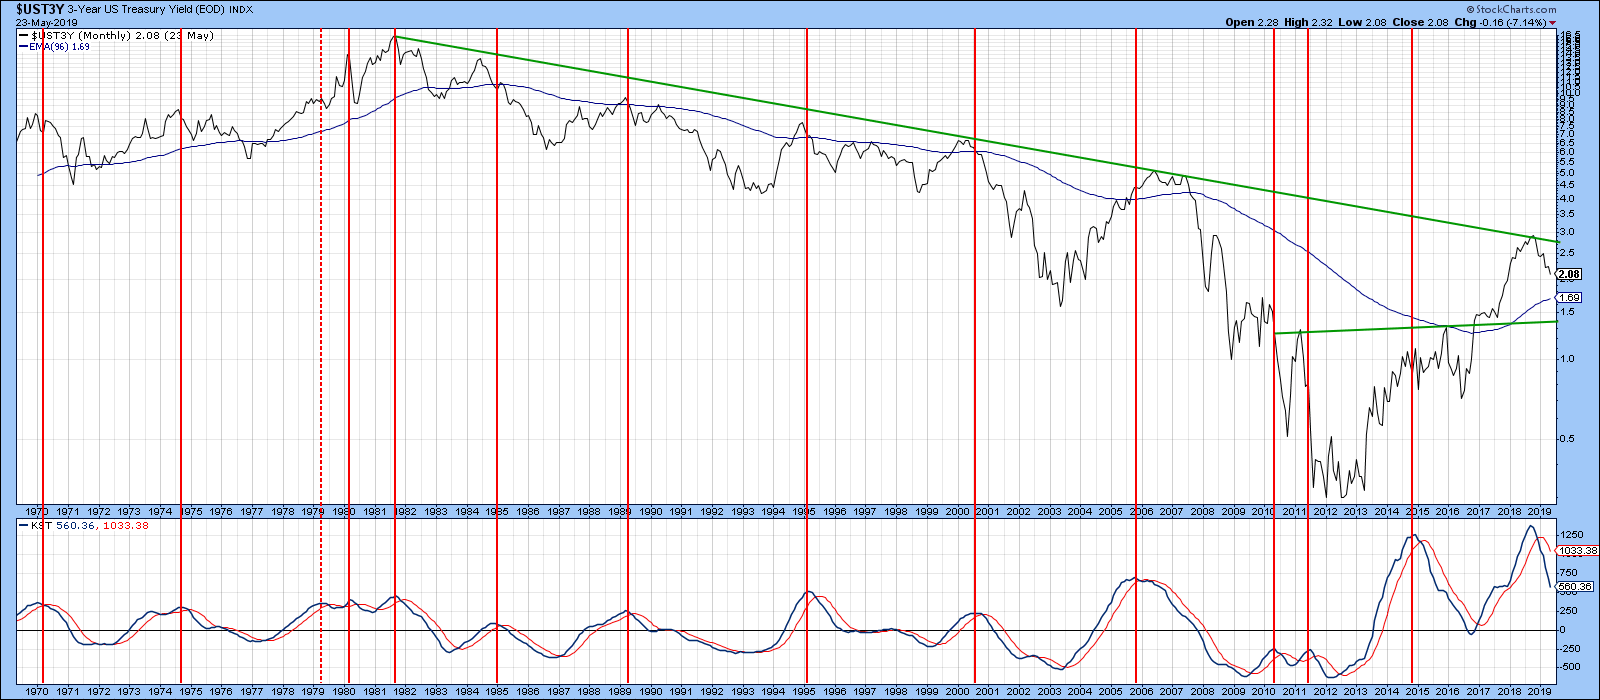
Editor's Note: This article was originally published in Martin Pring's Market Roundup on Friday, May 24th at 4:42pm ET. This week has seen many interest rate series, both in the US and around the world, breaking down from important trading ranges or reaffirming previous breaks... Read More
ChartWatchers May 24, 2019 at 01:42 PM
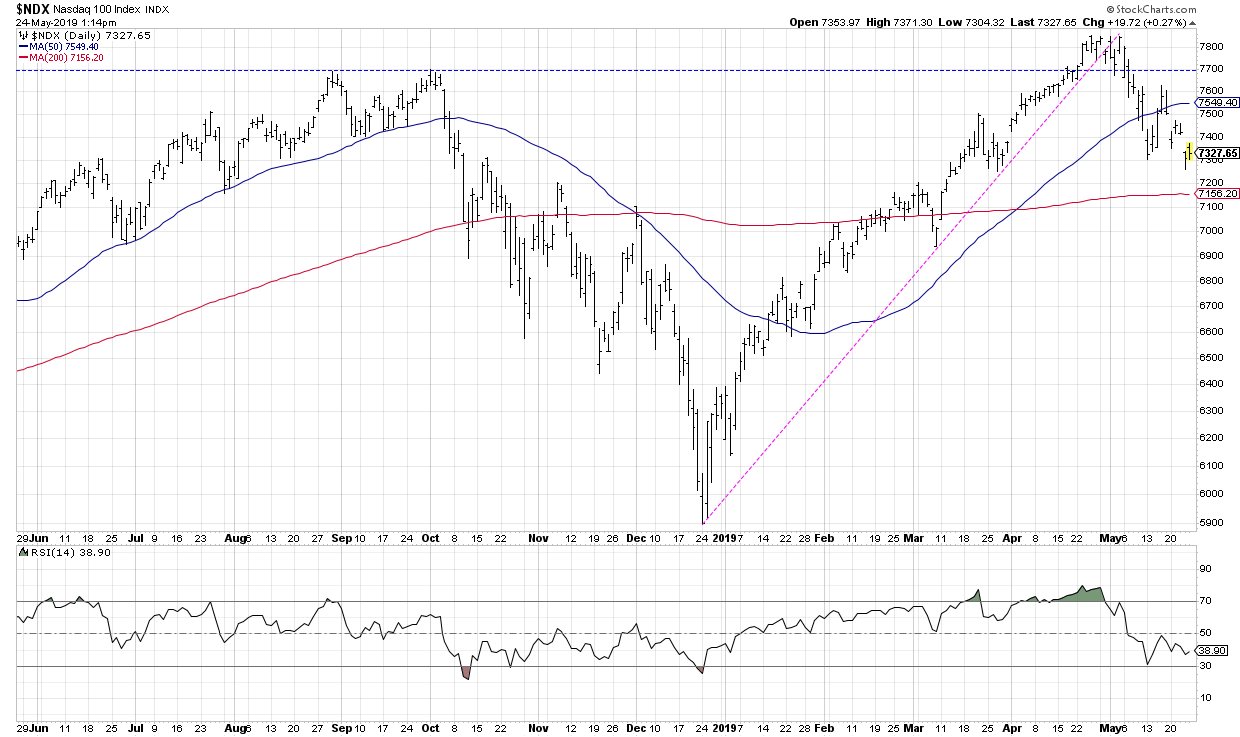
About a month ago, I wrote an article for ChartWatchers titled “Five Trendlines You Should Be Watching.” The general idea was that, as long as those five trend lines held, then the market was still most likely in a very constructive phase... Read More
ChartWatchers May 24, 2019 at 12:51 PM
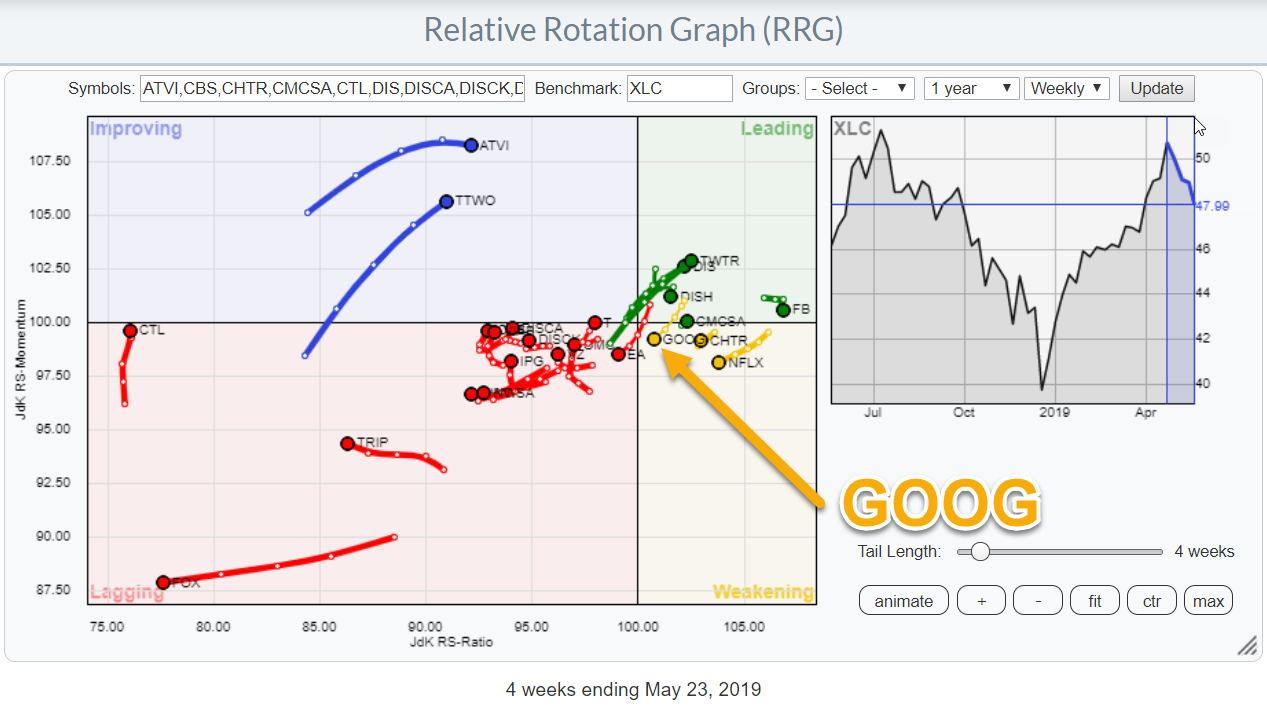
Relative Rotation Graphs can help to identify threats and opportunities within groups of securities... Read More
ChartWatchers May 17, 2019 at 06:54 PM
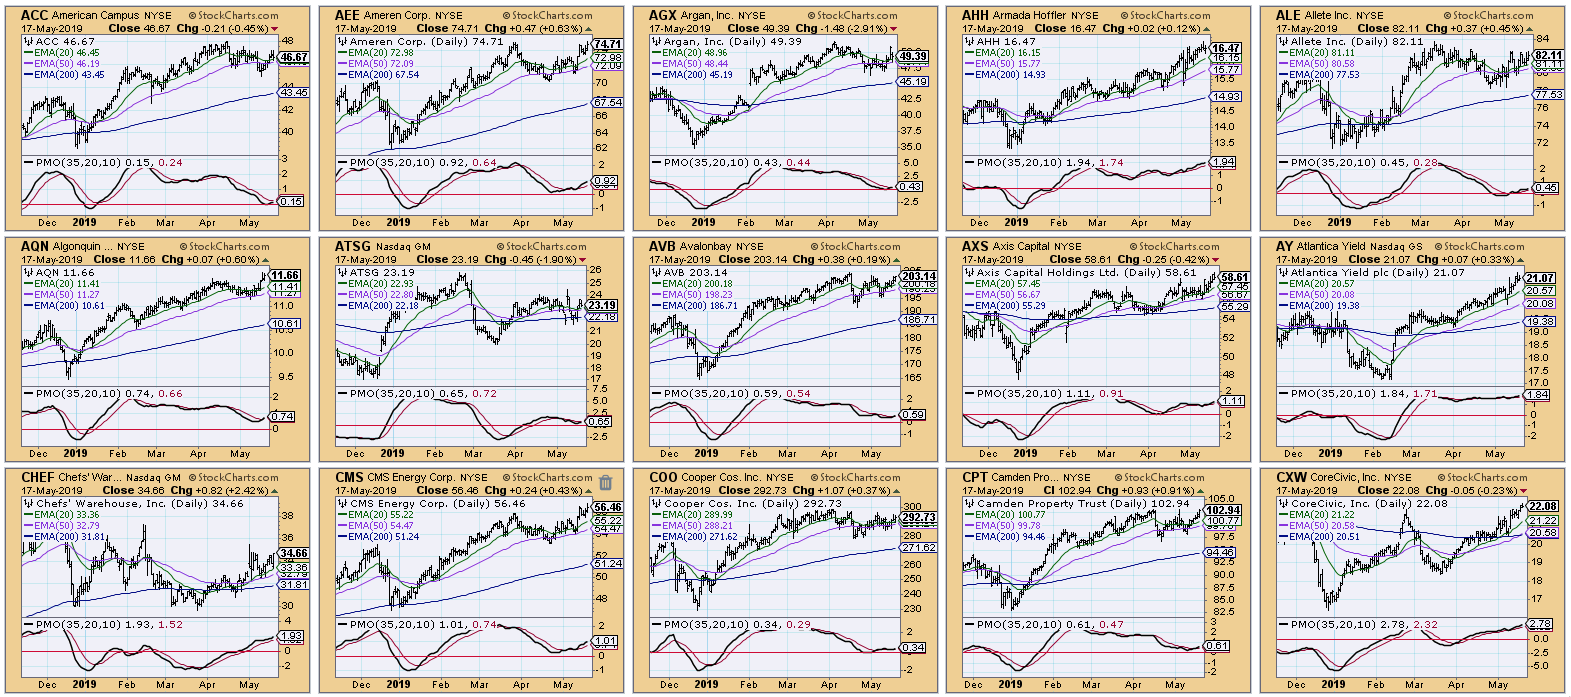
If you watch MarketWatchers LIVE regularly, you've probably heard about my new scan. I've found, especially when the market has a bearish bias, that my original Price Momentum Oscillator (PMO) scan wasn't producing any results... Read More
ChartWatchers May 17, 2019 at 05:56 PM
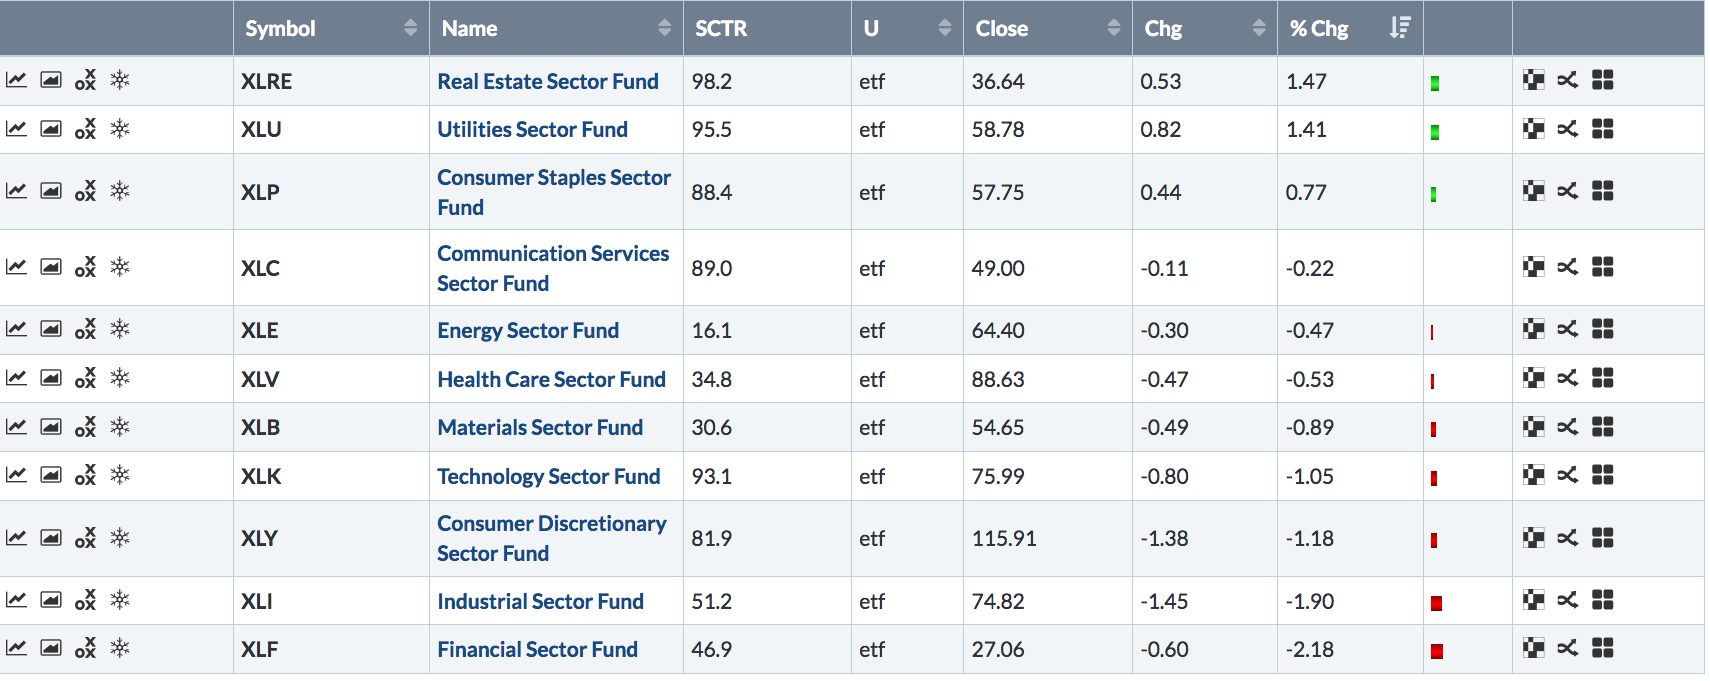
Editor's Note: This article was originally published in John Murphy's Market Message on Friday, May 17th at 4:49pm ET. The table in Chart 1 plots the relative performance of the eleven market sectors for the week. And they show a generally defensive market... Read More
ChartWatchers May 17, 2019 at 04:50 PM
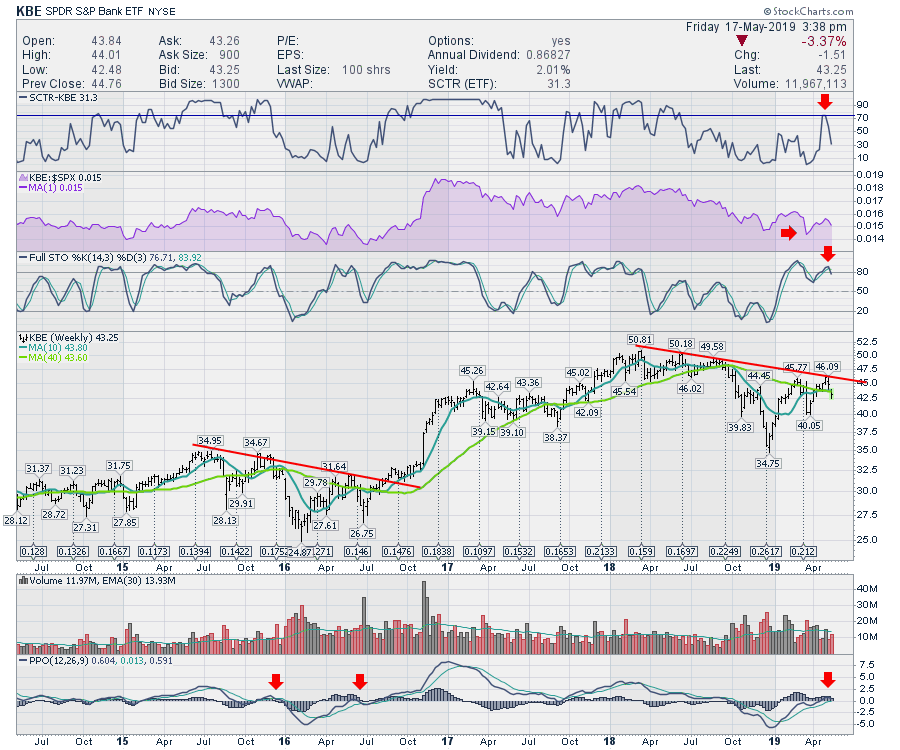
From what I can see, global bank charts are continuing to weaken. The banks as a whole have rolled over in the last two weeks, but we have some major banks around the world making new multi-year lows. This is problematic. First of all, we have the chart for KBE below... Read More
ChartWatchers May 17, 2019 at 04:20 PM

The bearish failure swing is a bearish RSI signal from Welles Wilder, creator of RSI. Note that this signal is NOT the same as a bearish divergence, even though a bearish divergence is also possible at the same time... Read More
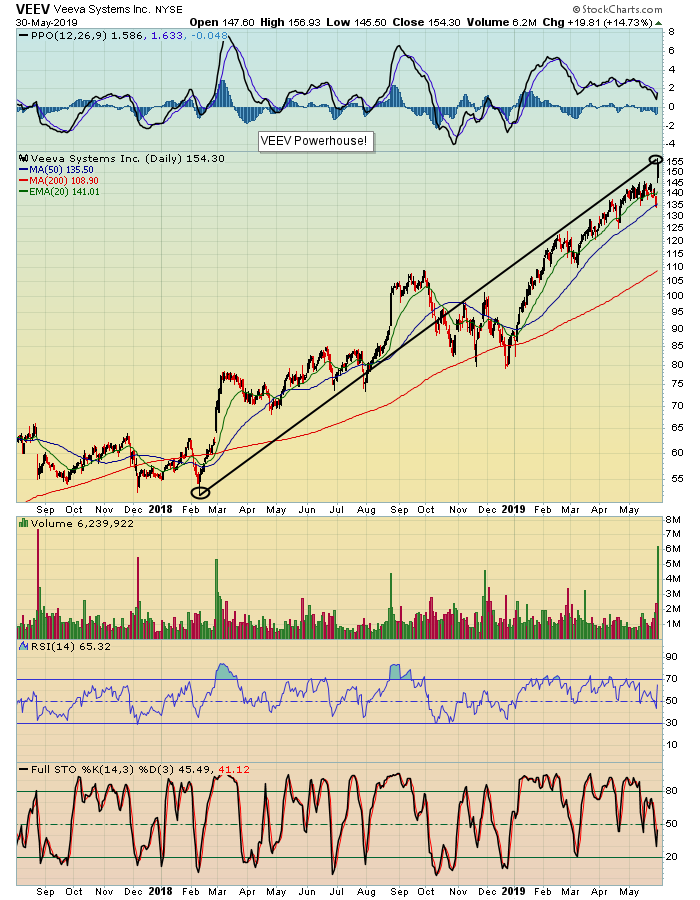
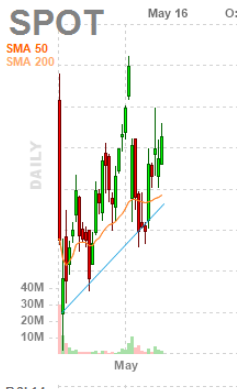
ChartWatchers May 17, 2019 at 12:36 PM
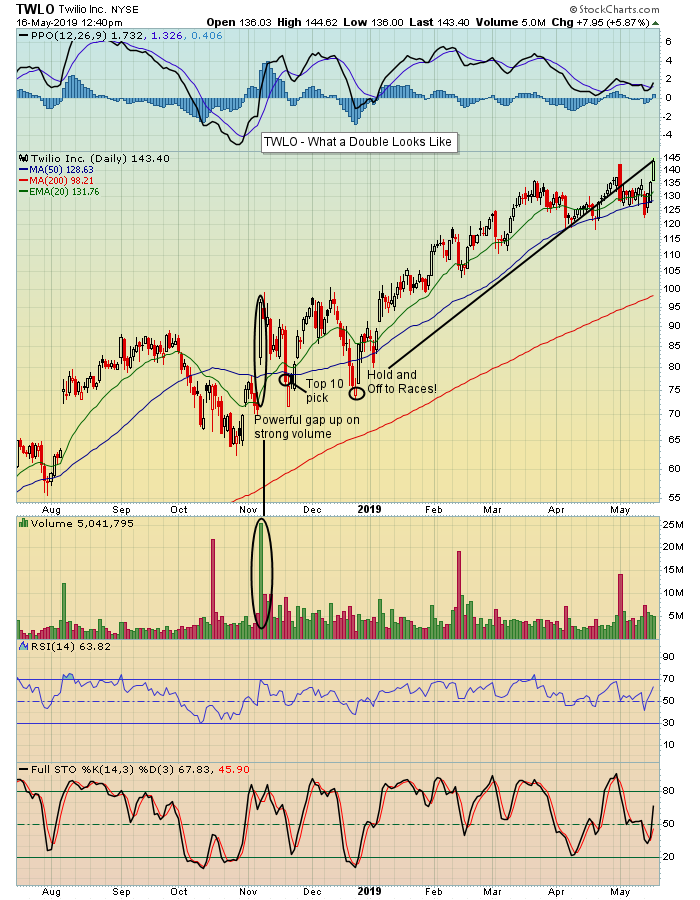
Every trader dreams of owning a stock that doubles. If it can happen in just six months, even better... Read More
ChartWatchers May 10, 2019 at 07:10 PM
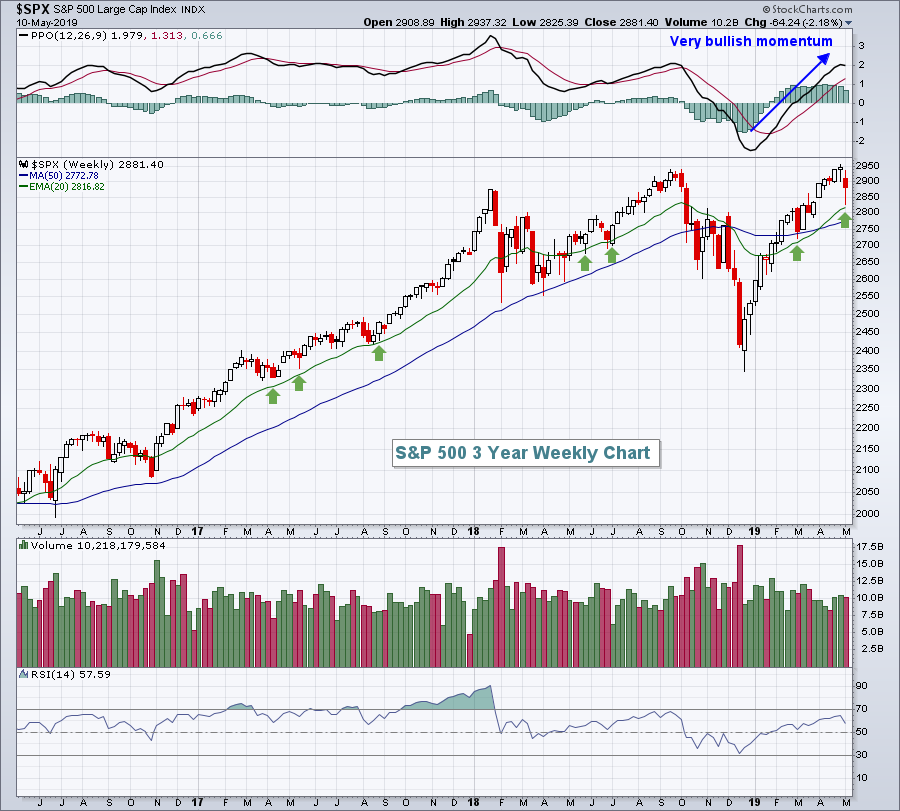
It was a brutal week, especially given the surging U.S. equity prices throughout 2019 thus far. The benchmark S&P 500 fell 2.18%, but intraweek losses were far steeper... Read More
ChartWatchers May 10, 2019 at 05:51 PM

“The world is a book, and those who do not travel read only a page.” - Saint Augustine I recently returned home after a 10-day trip to Scotland with my family for Spring Break... Read More
ChartWatchers May 10, 2019 at 03:31 PM
The number of IPOs listed in the U.S. has picked up this year. While some high-profile companies have already come public, there are more highly anticipated companies that are due to list shortly, such as the ride-share company Uber and workplace messaging app Slack... Read More
ChartWatchers May 10, 2019 at 01:35 PM
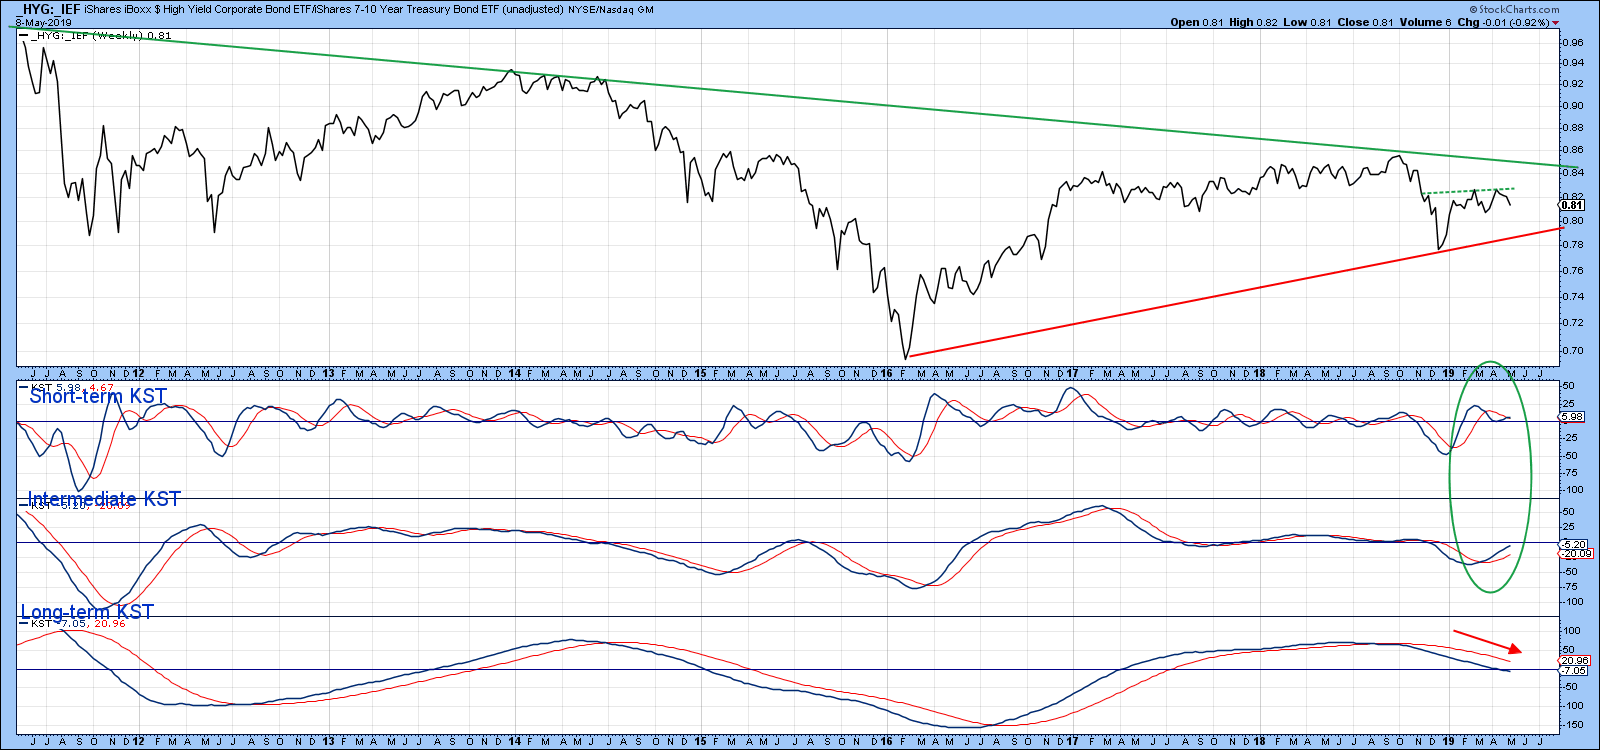
Editor's Note: This article was originally published in Martin Pring's Market Roundup on Wednesday, May 8th at 6:37pm ET. One area I monitor daily is the technical picture of bond spreads and other market relationships that reflect confidence... Read More
ChartWatchers May 10, 2019 at 12:49 PM
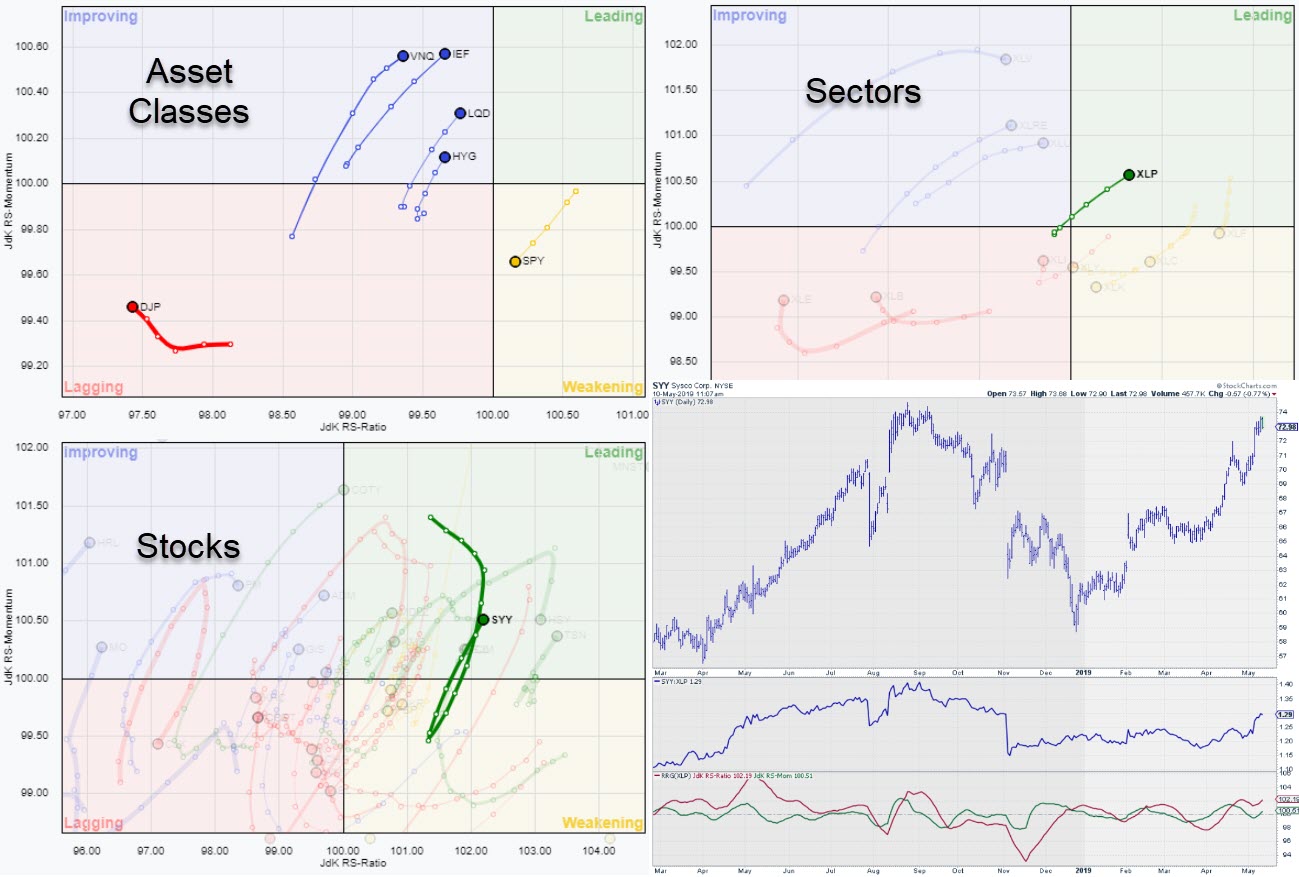
Relative Rotation Graphs can be a great asset in getting a high-level overview of what is going on in the markets and keeping an eye on the big picture. Beyond that, though, they can also help you to drill down to find new individual investment possibilities and trading ideas... Read More
ChartWatchers May 03, 2019 at 10:27 PM

Hello Fellow ChartWatchers! The springtime sun is shining bright here in the Pacific Northwest, and we think that's cause for celebration. So, I'm coming to you this week with a very special announcement... Read More
ChartWatchers May 03, 2019 at 10:07 PM
My dad, Carl Swenlin, was a guest on MarketWatchers LIVE last Wednesday (here is a link to that show)... Read More
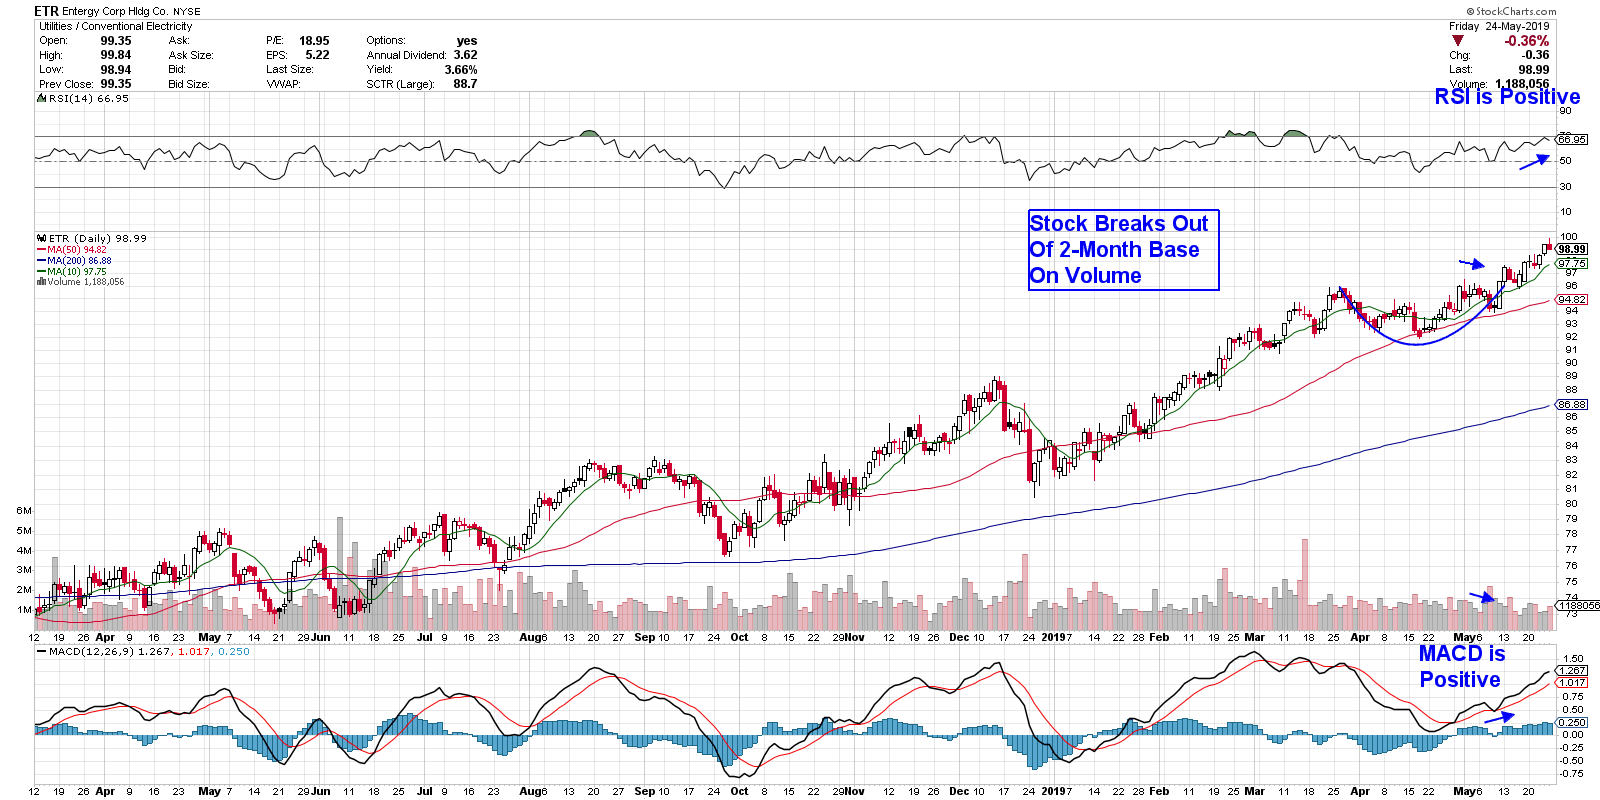
ChartWatchers May 03, 2019 at 06:18 PM
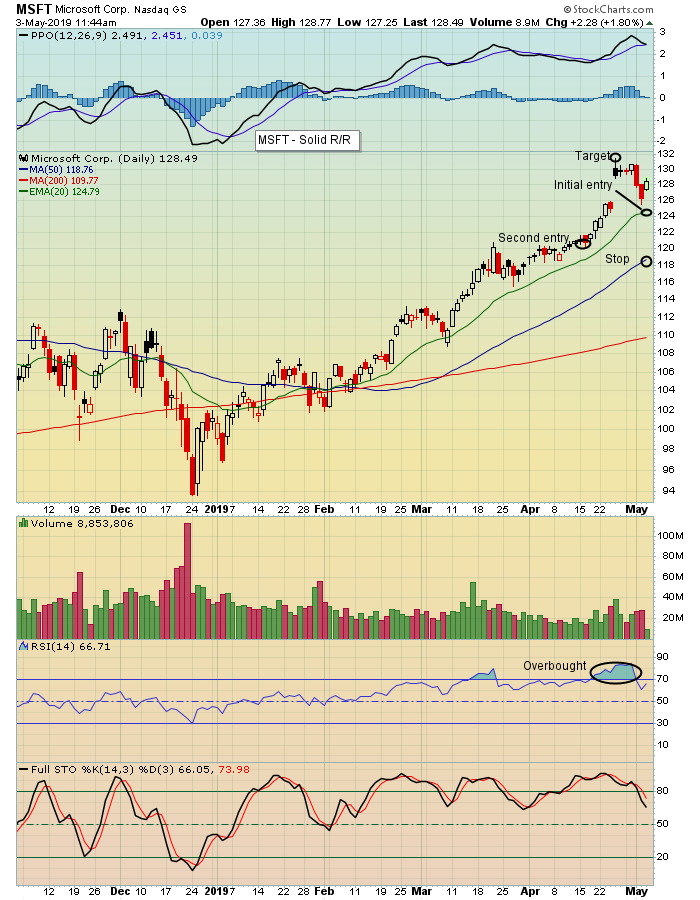
When you're a bull, the last thing you want to see is a pullback in stocks you own... Read More
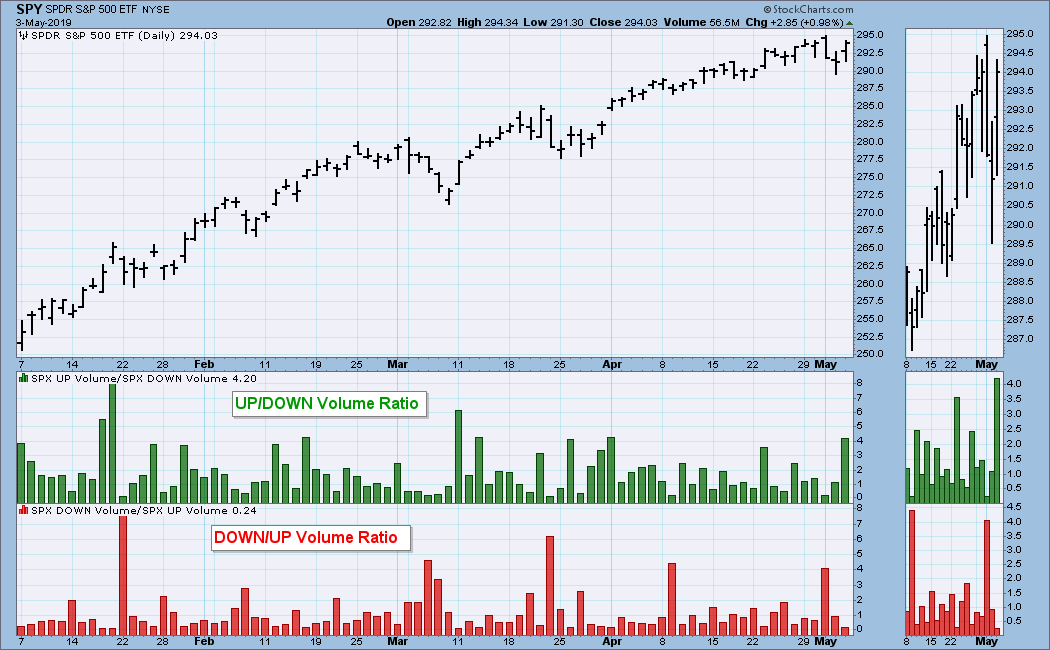
ChartWatchers May 03, 2019 at 01:44 PM
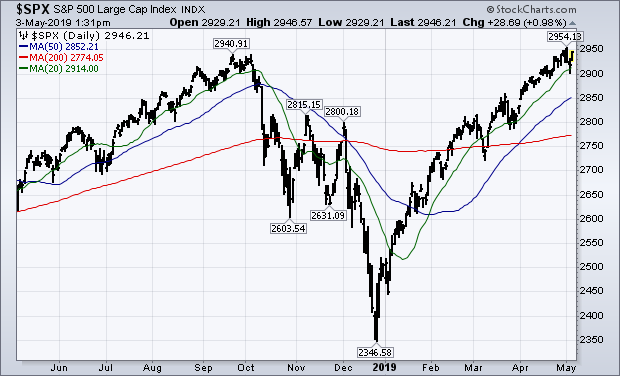
Editor's Note: This article was originally published in John Murphy's Market Message on Friday, May 3rd at 1:34pm ET. A surprisingly strong jobs report this morning has given stocks a big boost today... Read More
ChartWatchers May 03, 2019 at 01:38 PM
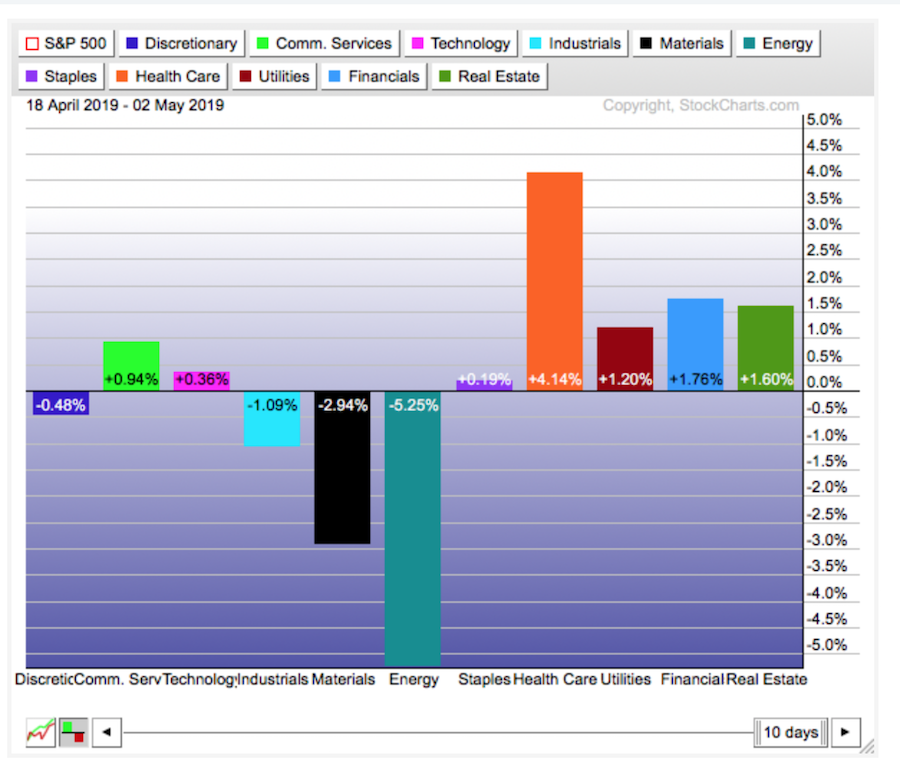
With most of the large caps finished reporting, it's a good time to take a look and see what is working. Over the last two weeks, Health Care, Utilities, Financials and Real Estate have outperformed the big growth sectors of Communications and Technology... Read More
ChartWatchers May 03, 2019 at 10:40 AM
The "Best Six Months" strategy suggests that the best time to own stocks is from November to April, and the worst time is from May to October... Read More