ChartWatchers February 27, 2021 at 12:32 AM
Every bull market cycle has its set of big, winning stocks – companies with strong fundamentals and increasing mutual fund sponsorship which helps propel these select stocks higher for huge gains... Read More
ChartWatchers February 26, 2021 at 11:25 PM
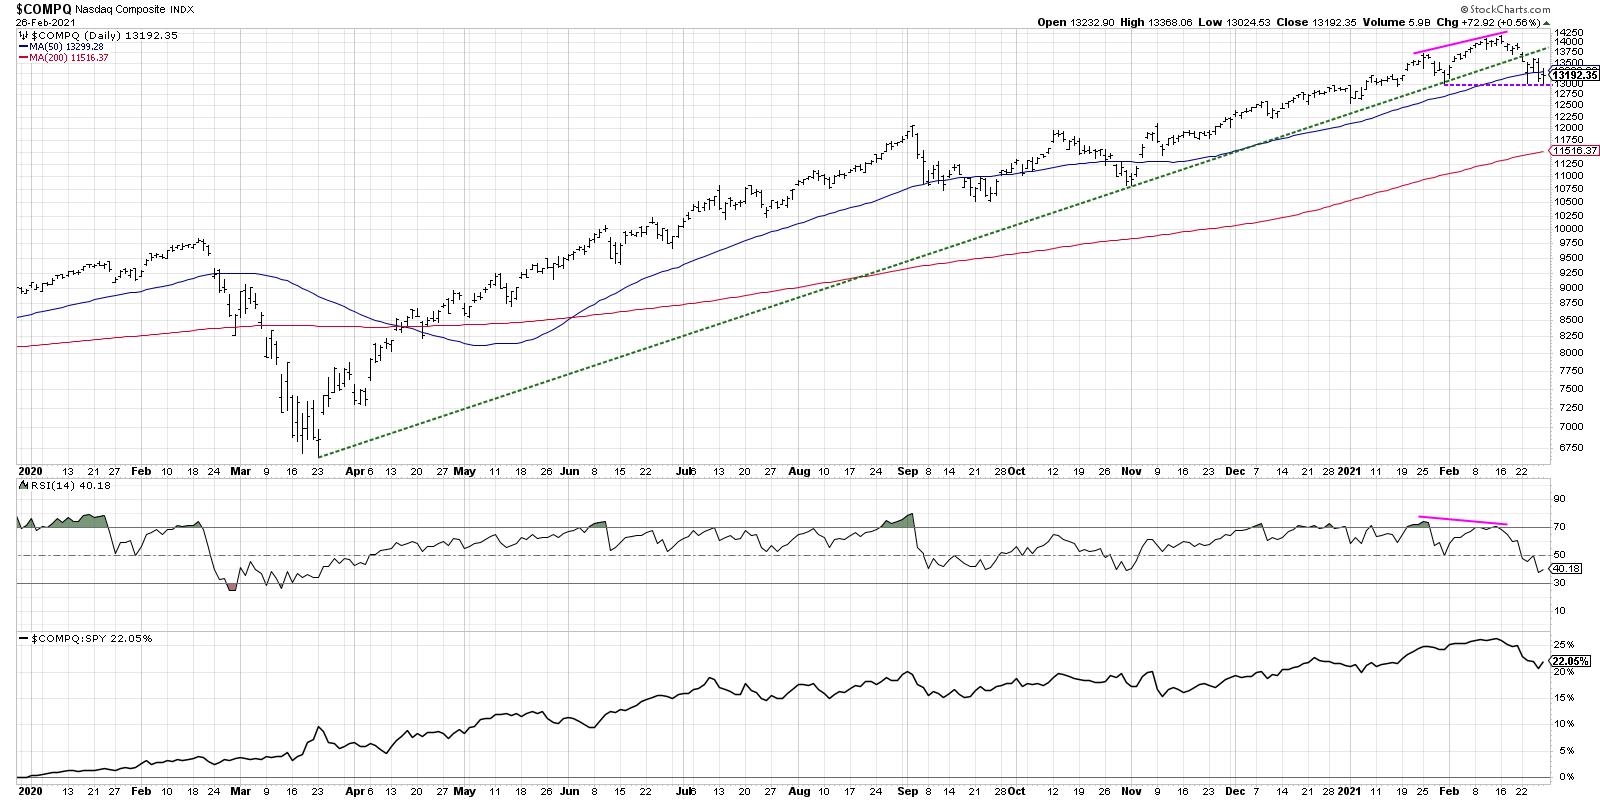
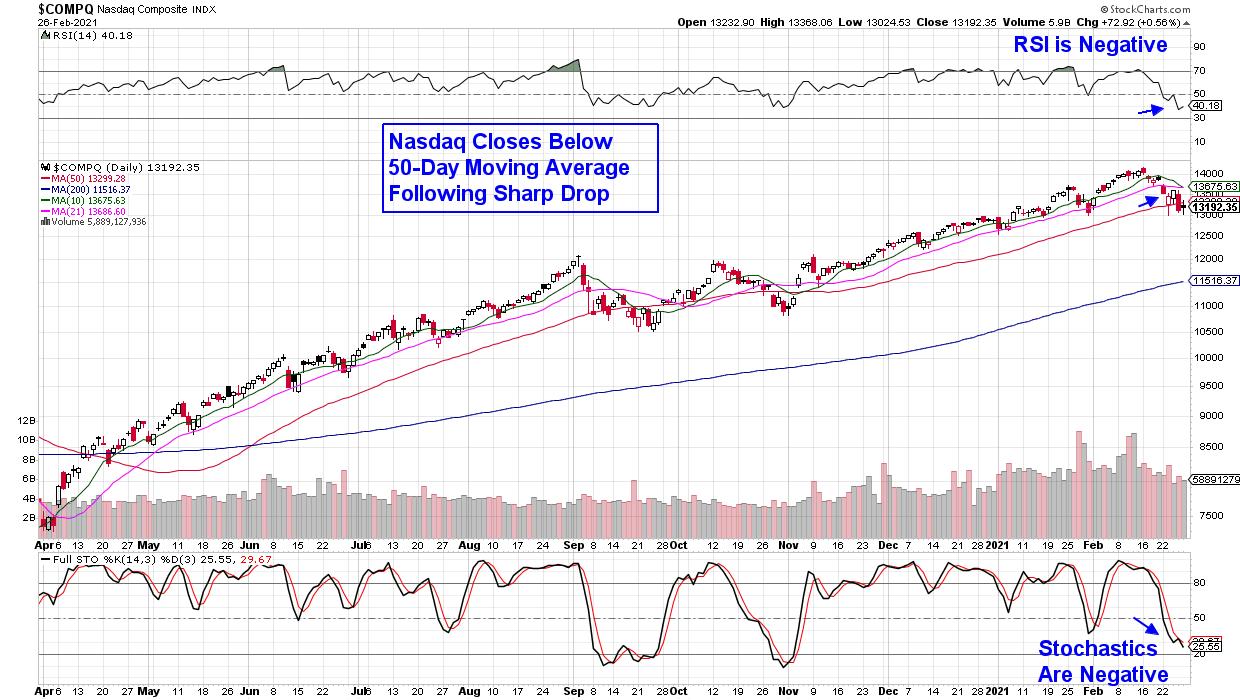
I recently tweeted the three steps for the S&P to signal a rotation from bullish phase to bearish phase, especially on the tactical time frame... Read More
ChartWatchers February 26, 2021 at 09:58 PM
I know it was a rough week last week; I only need to take one look at my own portfolio to figure that out. But the stock market doesn't go up in a straight line. There will ALWAYS be pullbacks. But be careful which "stories" you listen to... Read More
ChartWatchers February 26, 2021 at 05:42 PM
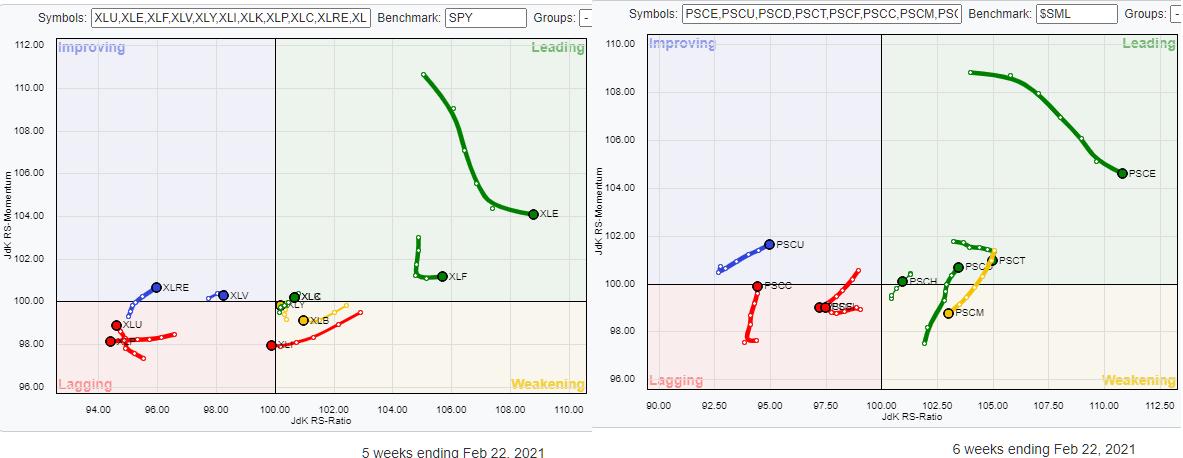
Last week, Friday 2/19, Tom Bowley invited me to be his guest in a webinar he did with EarningsBeats.com. Of course, I talked about RRG in general and we applied it to international markets, crypto-currencies and US sectors. All good fun... Read More
ChartWatchers February 19, 2021 at 09:14 PM
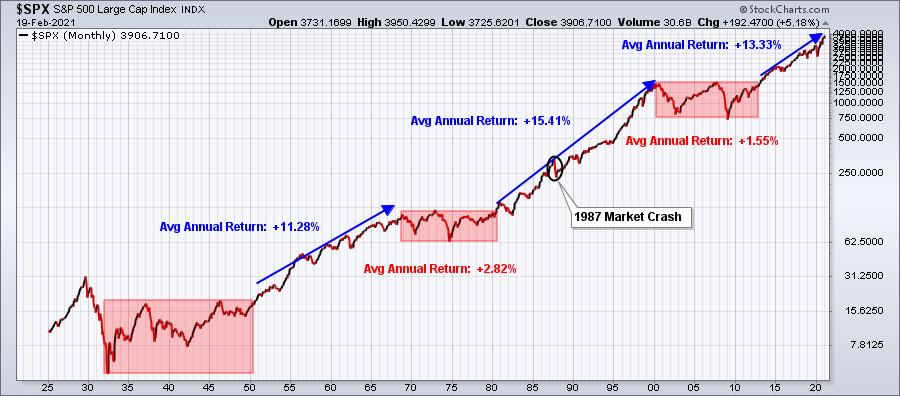
I believe the bull market vs. bear market debate has ended. We've been through a trade war, 100-year pandemic, an economic shutdown, a very divisive political battle, mountains of debt, etc., and where do we stand? At an all-time high... Read More
ChartWatchers February 19, 2021 at 05:27 PM
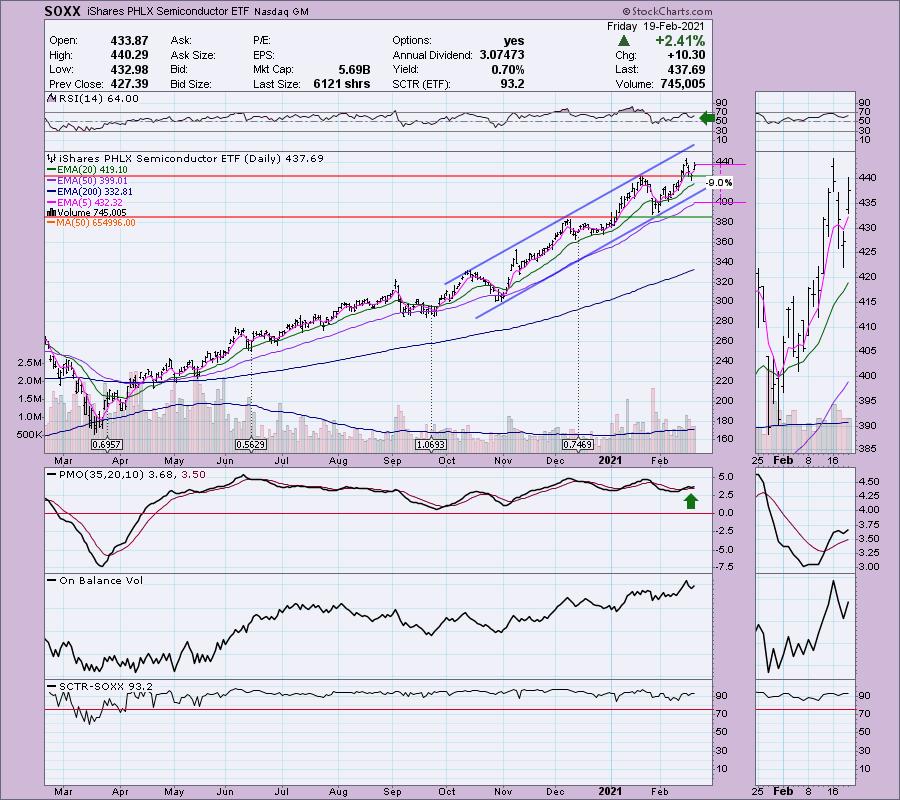
Semiconductors are outperforming the market, but not all Semiconductors are enjoying the strong rally that's been ongoing since September. Some of the more popular names have underperformed within their industry group and against the SPX... Read More
ChartWatchers February 19, 2021 at 04:40 PM
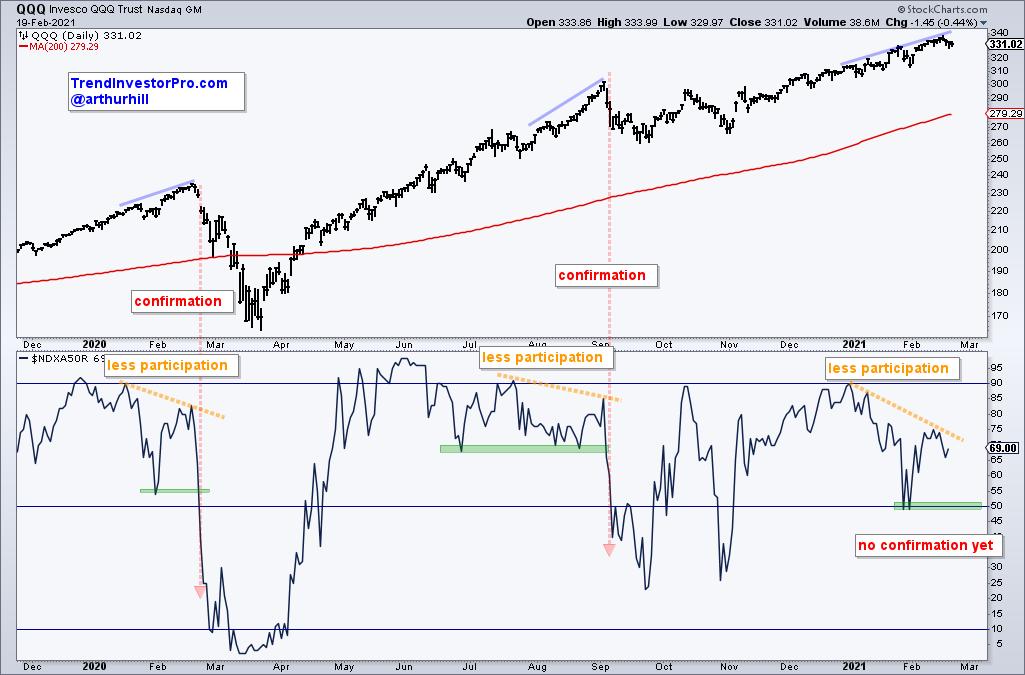
The Nasdaq 100 has been on a tear the last few months with a move to new highs, but a medium-term breadth indicator is not keeping pace here in February... Read More
ChartWatchers February 19, 2021 at 12:20 PM
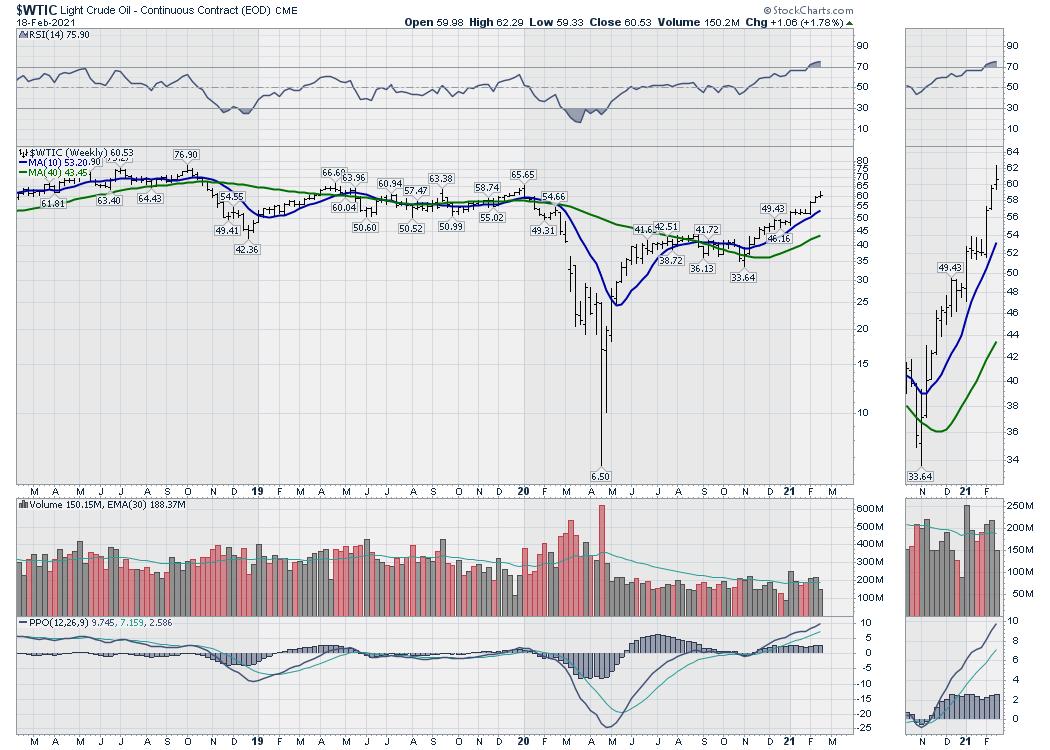
This week, the liquid energy markets exhibited some serious stress. Oil surged in both $WTIC (North America benchmark) and $BRENT, an international benchmark to levels not expected even one or two months ago. Natural Gas also soared in some regions... Read More
ChartWatchers February 13, 2021 at 12:22 AM
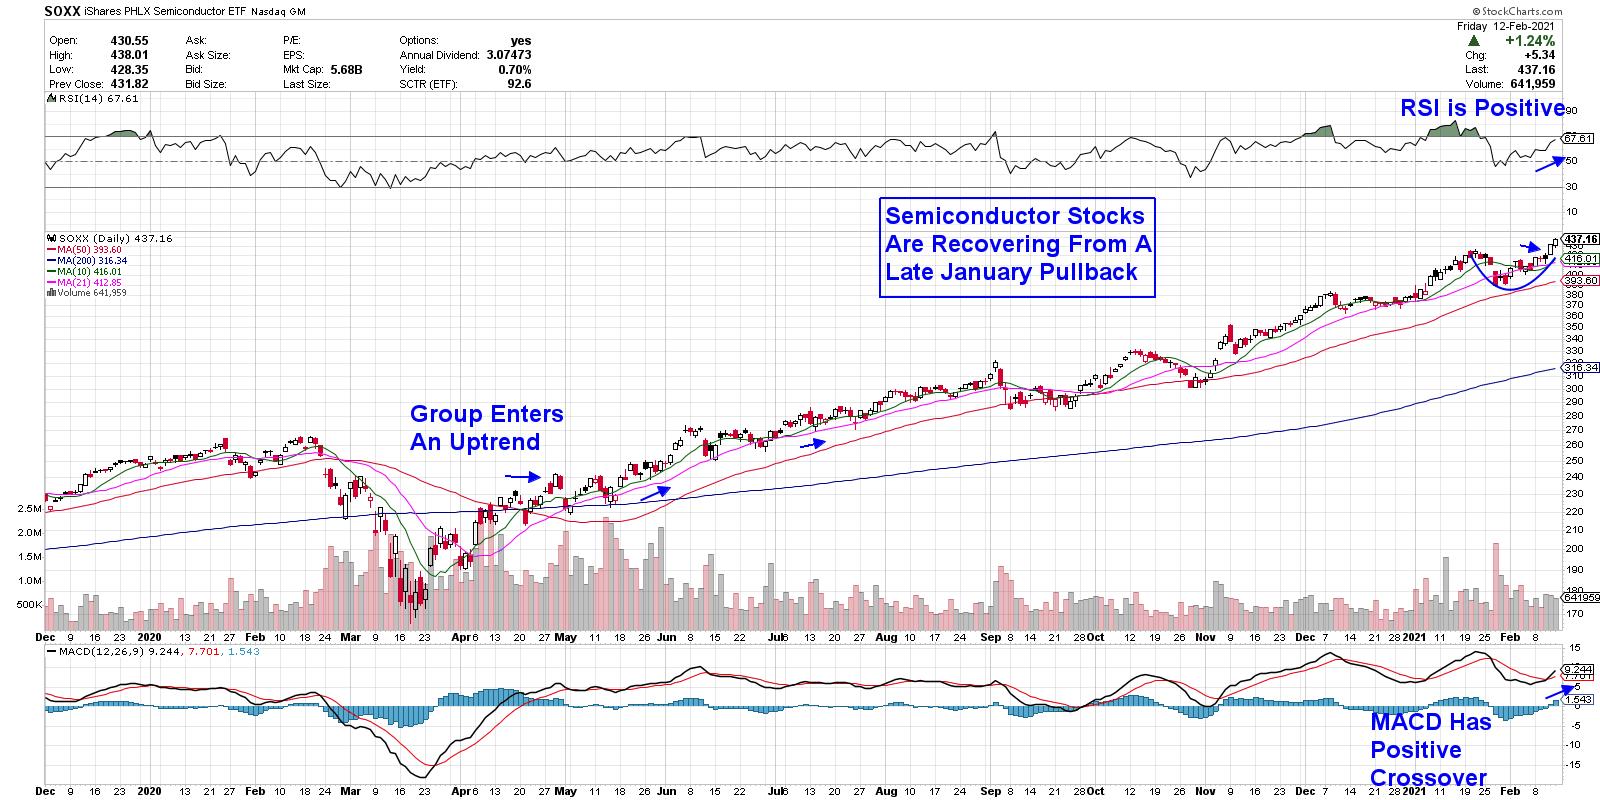
The markets are continuing to hit a new high amid stimulus hopes and a slowly improving economy. Add an accommodative Federal Reserve and the rolling out of a Covid-19 vaccine worldwide, and it's certainly easy to make a case for this bull market... Read More
ChartWatchers February 12, 2021 at 08:19 PM
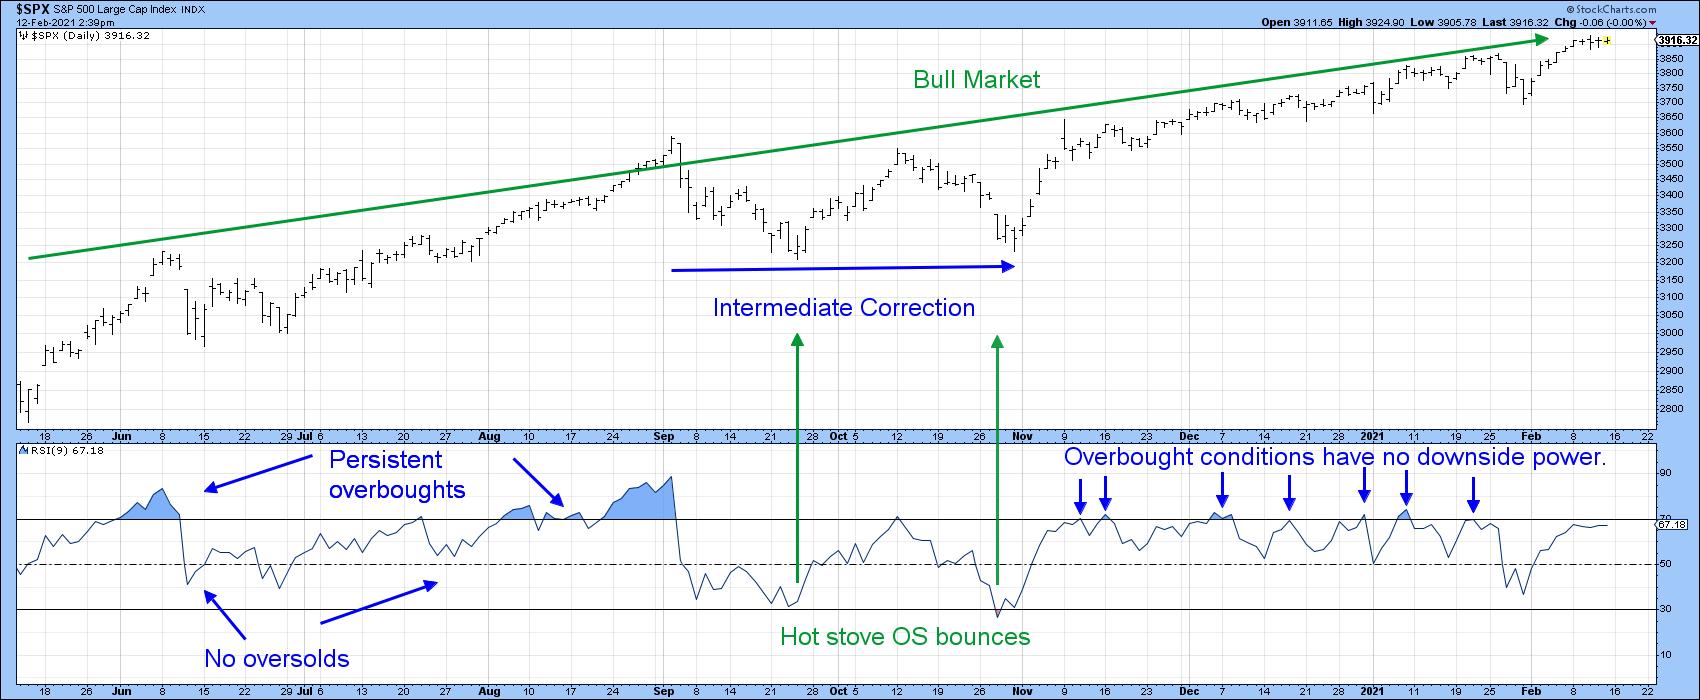
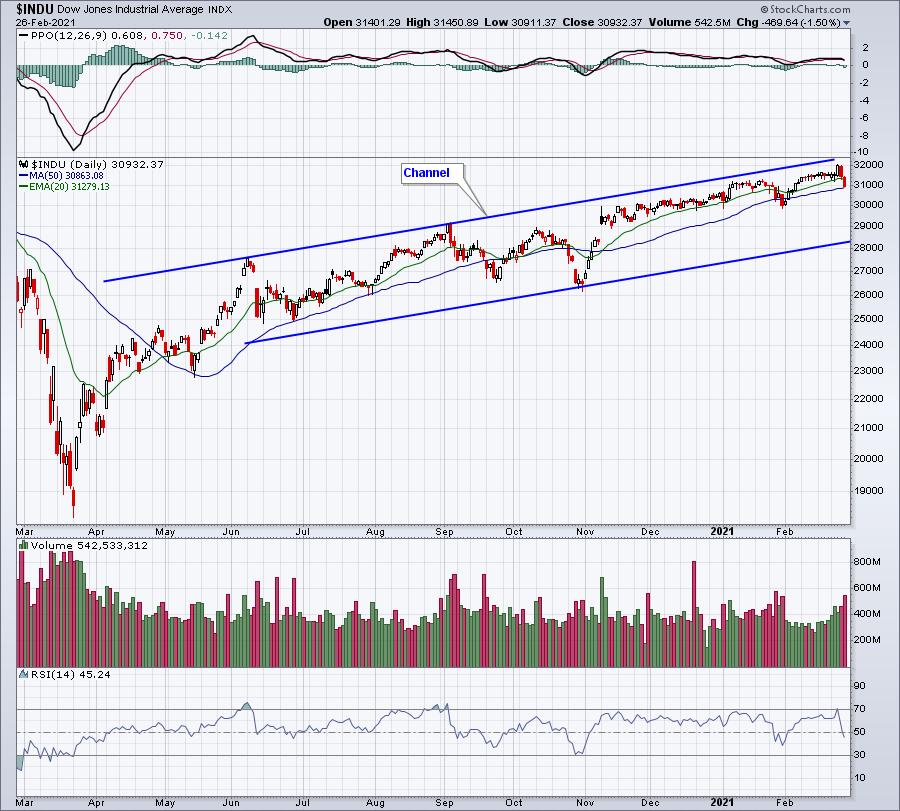
They say that a rising tide lifts all boats, and so it is with freely traded markets. In the boating world, you can spot a rising tide with a steadily rising boat, but, with markets, the simplest approach is to observe a series of rising peaks and troughs... Read More
ChartWatchers February 12, 2021 at 04:24 PM
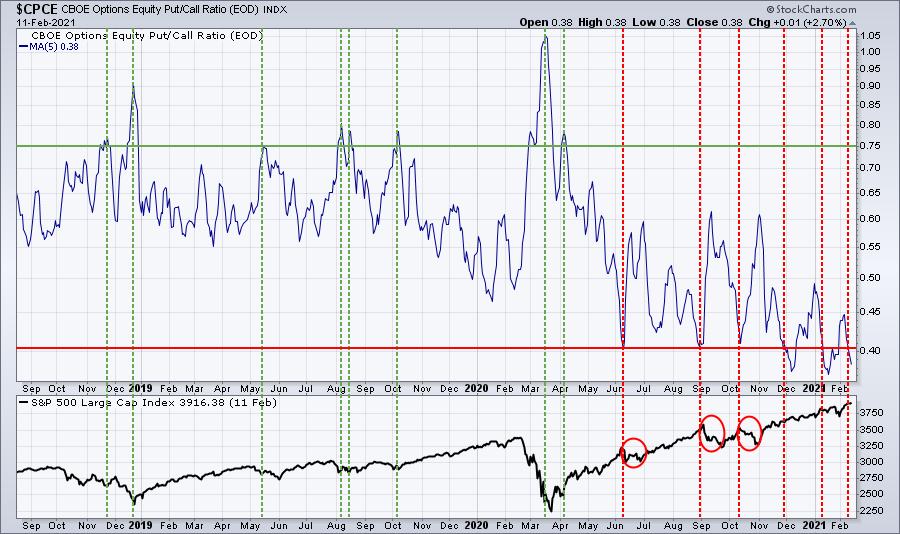
The quarterly earnings that have poured out are utterly amazing. We're not just talking slight beats; Corporate America is CRUSHING it and the pent up demand hasn't even kicked in yet... Read More
ChartWatchers February 12, 2021 at 12:32 PM
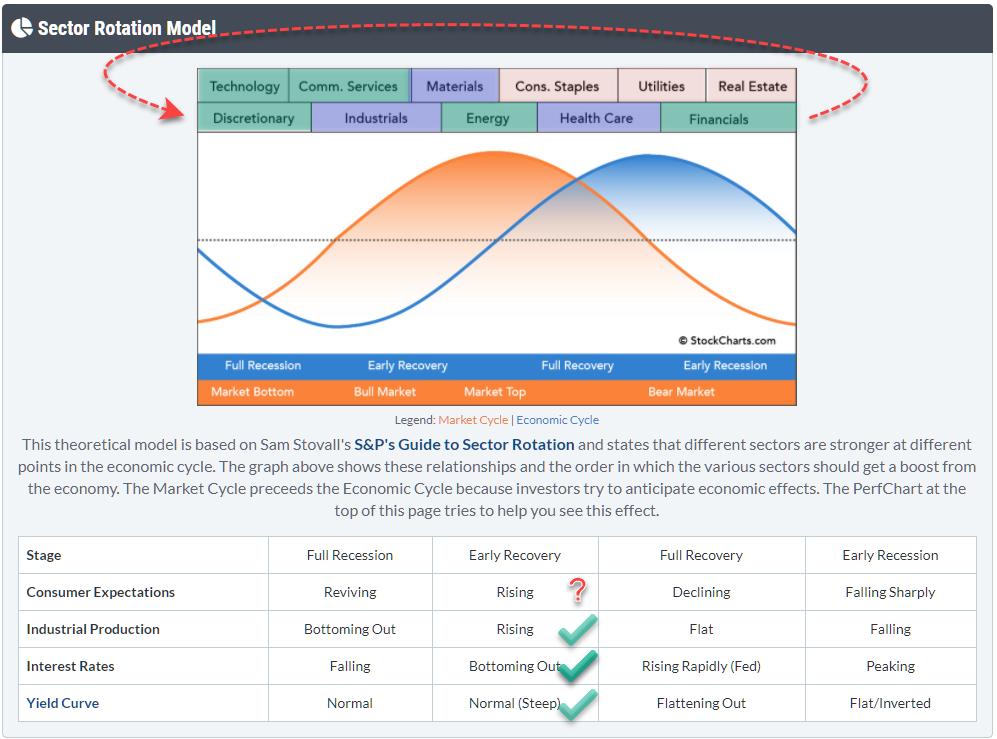
From time to time, I like to check the macro environment and try to see if I can find meaningful clues to draw conclusions from generally accepted theories/models. The Sector Rotation Model (From Sam Stovall's guide to sector rotation) is one of those models that I like to track... Read More
ChartWatchers February 05, 2021 at 10:00 PM
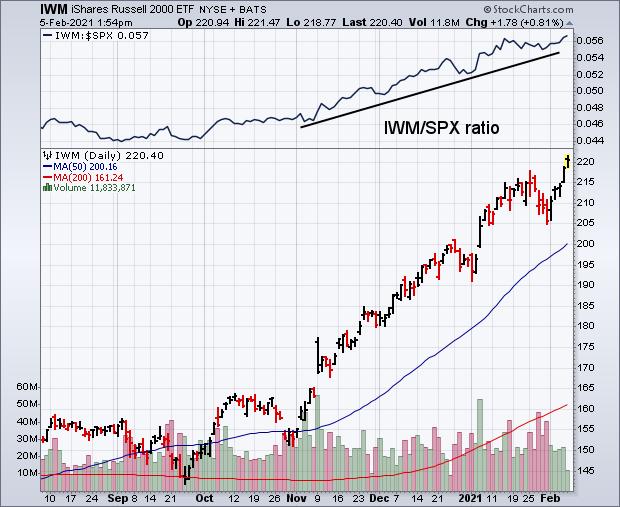
Stocks are ending the week on a firm note with the S&P 500 and Nasdaq trading in record territory. The Dow isn't far behind. Small cap stocks, however, continue to lead the market higher. The daily bars in Chart 1 show the Russell 2000 iShares (IWM) hitting a new record... Read More
ChartWatchers February 05, 2021 at 08:50 PM
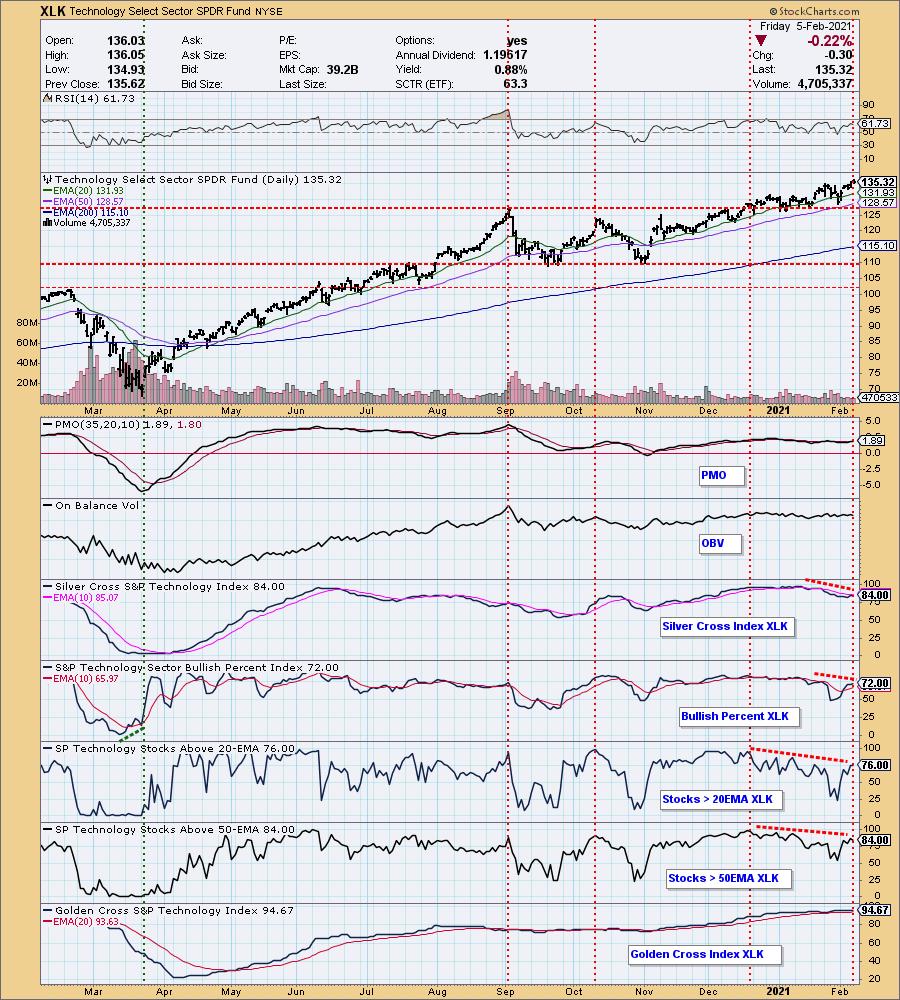
Today, I will weave a technical analysis tale of two sectors--one of the popular star that is beginning to lose its shine, the other about a possible Cinderella story sector. The popular star and doted-upon sector is Technology (XLK)... Read More
ChartWatchers February 05, 2021 at 07:41 PM
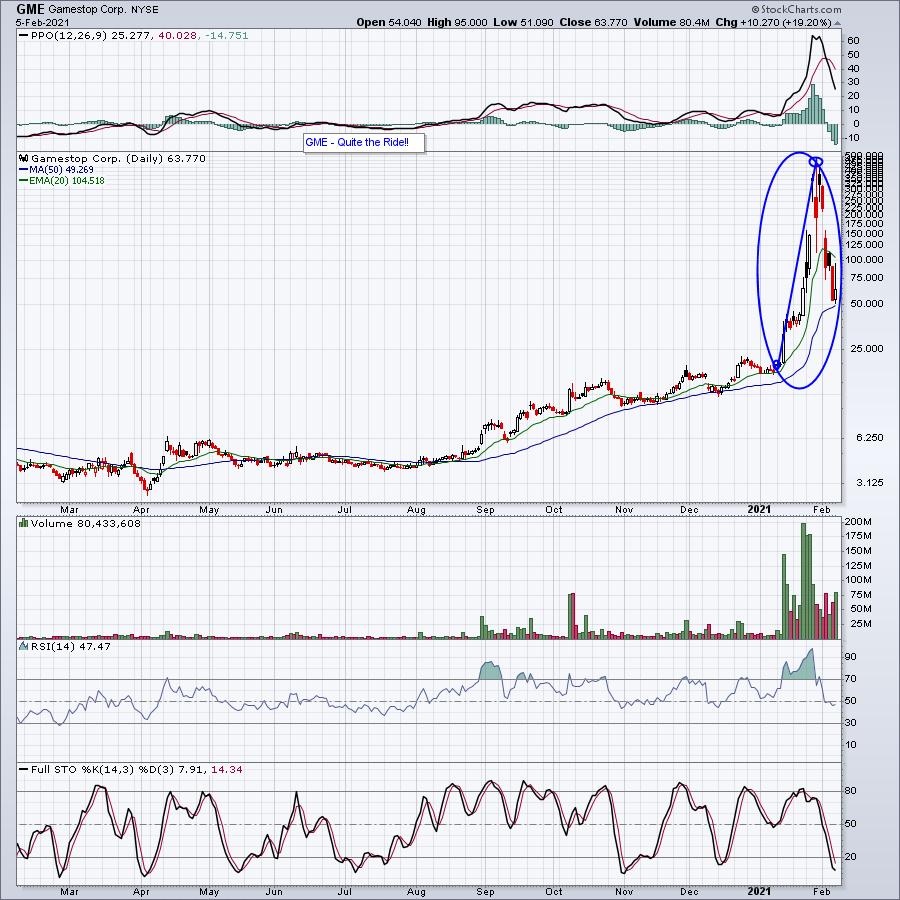
While the overall market was working its way to new highs, the entire investing world (and many who had never been involved in the market before) was tuning in daily to see what the price of Gamestop (GME) was... Read More
ChartWatchers February 05, 2021 at 06:51 PM
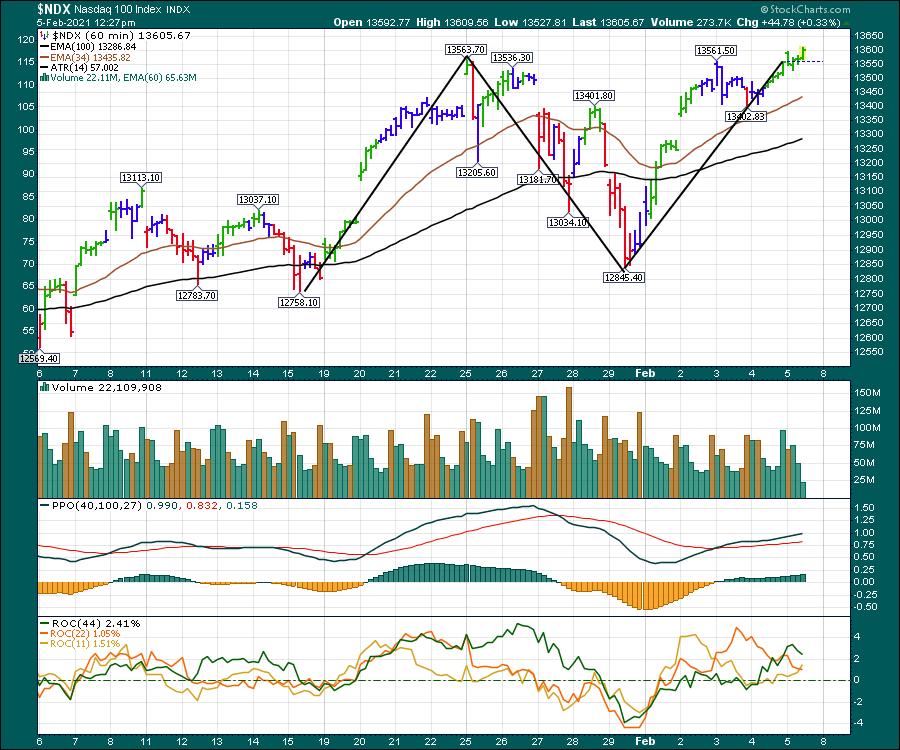
It has been a wobbly few weeks as the market has swung back and forth. The indexes are at their highs and mega-cap tech has reported strong numbers. The Nasdaq is looking to close out Friday at all-time highs... Read More
ChartWatchers February 05, 2021 at 11:44 AM
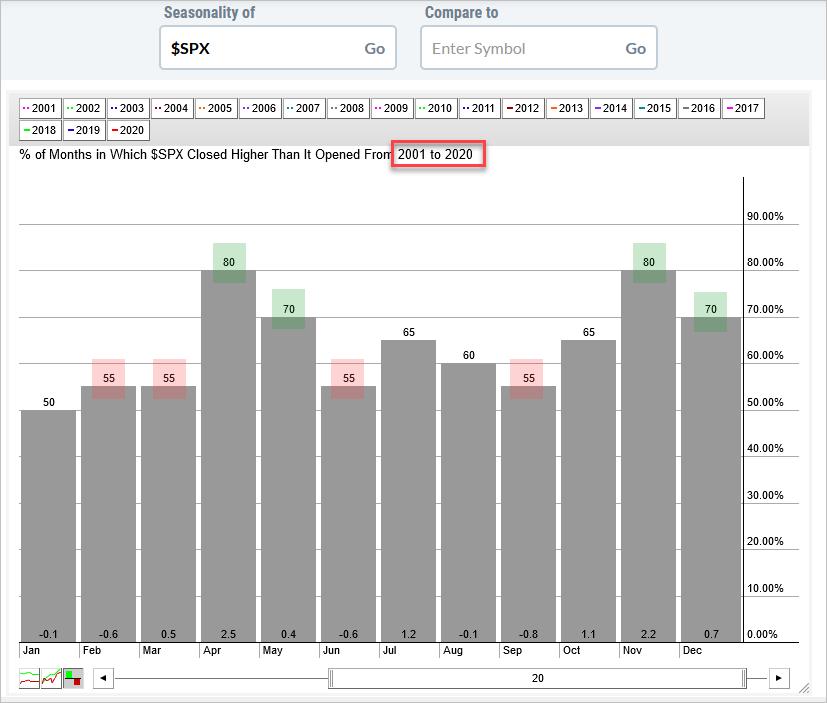
The seasonal patterns over the next two months are not very strong, but price action is strong with the S&P 500 hitting a new high. Price action is more important than the seasonal pattern because profits and losses are driven by price changes, not seasonal tendencies... Read More