Chip Anderson September 02, 2015 at 02:59 PM
First off, what do you think about the new look for our blogs? We are moving to a "cleaner" look that works better on mobile devices and still prints well. Currently, the new look is only available on a couple of our many blogs. Over the next couple of weeks, we'll migrate all of the blogs over to this new design. Please let us know your thoughts in the comments area below. Second off, thanks to everyone that participated in our recent webinar surveys. Your feedback was invaluable. Congrats to Thomas Wycker, the random survey participant whose name Read More
Chip Anderson July 15, 2015 at 10:00 AM
During last Saturday's webinar, I talked about how I customize my version of GalleryView by using three different ChartStyles. GalleryView is our tool for looking at the same symbol using several different timeframes. The default settings are fine, but StockCharts members can customize things using ChartStyles as shown below. Here are the three ChartStyles that I am (currently) using for my GalleryView: GalleryIntraday GalleryDaily GalleryWeekly Read More
Chip Anderson July 06, 2015 at 06:48 PM
Ever have a power outage that wasn't a power outage? Me neither, at least not until this morning at 8:16am (5:16am Pacific time). At that moment, for reasons that have not been explained, there was a local power outage here in the north side of Redmond that only affected "large" equipment like chillers, air conditioning units and server rooms. Basically, the stuff that we use here to keep StockCharts.com working (of course!). As we learned later, the outage only affected one of the three "phases" of power going to all of the buildings in our area. What Read More
Chip Anderson April 21, 2015 at 11:05 PM
It's amazing to me that one person could cause such behavior in the market. While his behavior appears to be criminal, the system(s) that allowed this behavior are also to blame. http://www.justice.gov/opa/pr/futures-trader-charged-illegally-manipulating-stock-market-contributing-may-2010-market-flash - Chip Read More
Chip Anderson April 14, 2015 at 05:00 PM
Greg Morris and I are on the hunt and we are hunting rare, exotic game that is elusive, difficult to spot and even harder to capture - chart patterns. Not just any chart patterns either. Not your run of the mill Double Top or Rounding Bottom pattern for us. No sir. We are hunting the legendary "Perfect" Head and Shoulders Reversal. Now, before you scoff, note that I said "Perfect." By "Perfect" I mean "Edwards & Magee" perfect. The gold standard of H&S reversals. Pure not only in its symmetry and in its predictive outcome, but also Read More
Chip Anderson March 17, 2015 at 01:41 PM
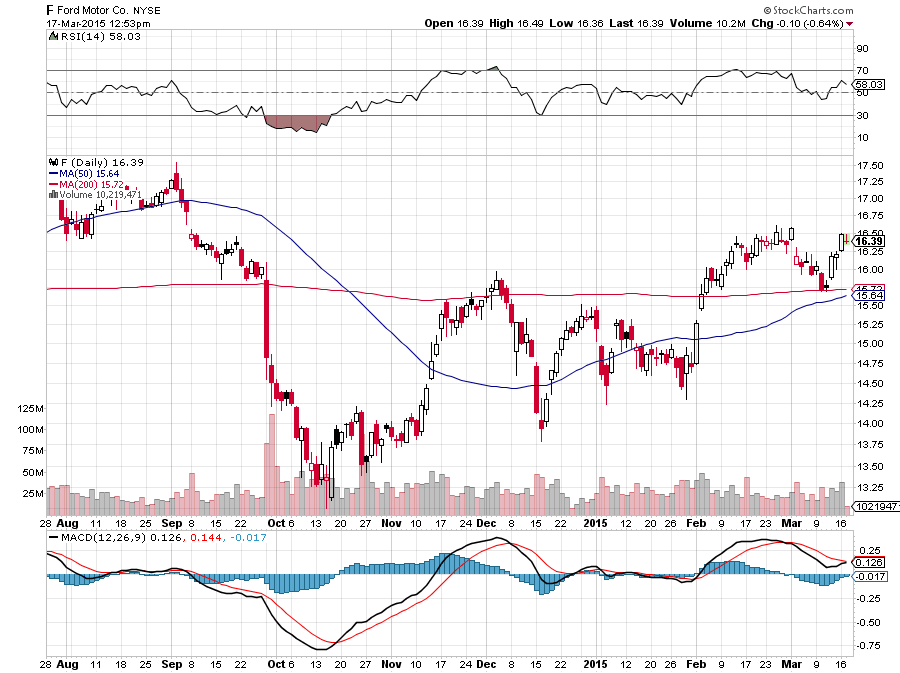
After 13+ years, we've finally gotten around to updating our Predefined ChartStyles. These are the styles that members see at the bottom of the ChartStyles dropdown on the SharpCharts workbench. They are always available regardless of what other styles you've stored in your account. We use to have 5 styles that were all rather limited in their look and capabilities. Now we have ten updated styles that you can use to quickly analyze stocks using whichever style you prefer. Below are all of the new styles using Ford (F) as the example stock. Read More
Chip Anderson January 22, 2015 at 12:20 PM
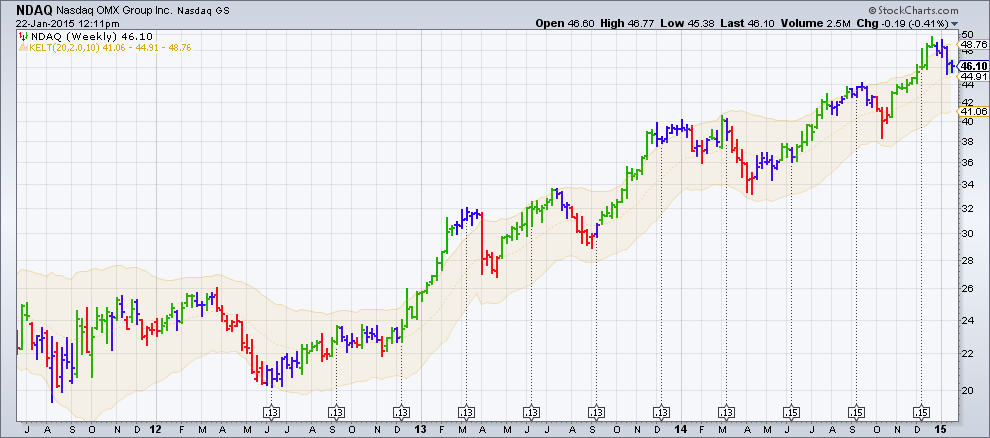
Nasdaq recently dropped six popular industry indexes for no reason. We had no choice but to drop them from our system as well. We apologize for whatever inconvenience that caused. Depressingly, this kind of thing is becoming more and more common. Here's the announcement from Nasdaq: http://www.nasdaqtrader.com/TraderNews.aspx?id=fpnews2014-65 Do you see any actual reason given? Neither do I. And here's the kicker: Later this year - as they always do - Nasdaq will send me a letter telling me that they have "improved" Read More
Chip Anderson January 20, 2015 at 07:23 PM
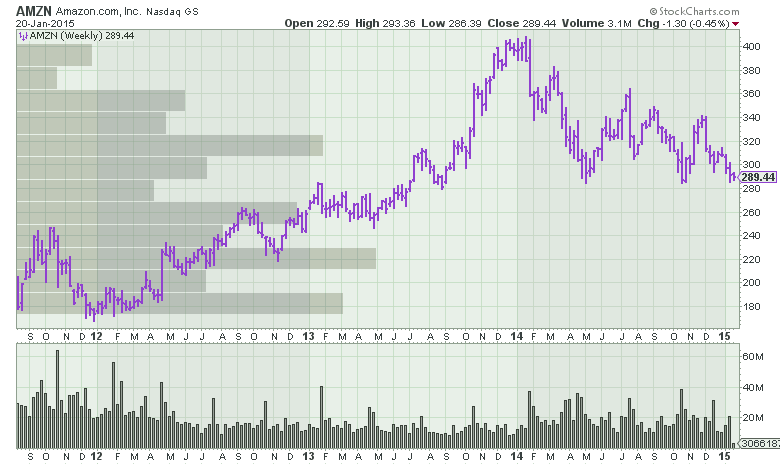
We've just added a parameter to our "Volume by Price" overlay - it didn't have any before now - that allows you to set the number of horizontal histogram bars on the overlay. In case you haven't used it before, the Volume by Price overlay is a collection of horizontal histogram bars that show you how much volume has accumulated at different price levels on your chart. It is great for finding and confirming support/resistance zones. Here's a traditional, "old-school" Volume by Price chart: (Yes, you can click on the chart to see a live version.) Read More
Chip Anderson January 15, 2015 at 04:49 PM
Hey there, blog authors! Welcome to our Sample Article. I've put this hidden article together to help make sure you're fully aware of all that Composer (our blogging system) can do, and perhaps to remind you of some of the features that are available through the platform. I'll provide a number of examples, specify some guidelines and share our blogging best practices for you here. As things change over time, I'll make updates to this sample article re-share the link so that you can take a look. Alright, let's dive in. For starters, let's talk about the image I Read More
Chip Anderson January 05, 2015 at 09:42 AM
Happy New Year everybody! In case you missed them, I wrote two important end-of-the-year articles for ChartWatchers recently. Here are the links: Why a StockCharts.com Membership is More Valuable in 2014 Than It Has Ever Been which talks about all the things we added to the website in 2014, and Looking Forward to 2015 which talks about things we hope to add to the website in 2015. Enjoy! - Chip Read More
