Don't Ignore This Chart! December 30, 2015 at 02:42 PM
2015 has been about as mixed as a market can get. This split market can be seen by looking at two versions of the S&P 500. The Large-cap S&P 500 SPDR (SPY) is up around 2.5% over the past year and the Equal-weight S&P 500 ETF (RSP) is down around 1.5%... Read More
Don't Ignore This Chart! December 29, 2015 at 08:38 AM
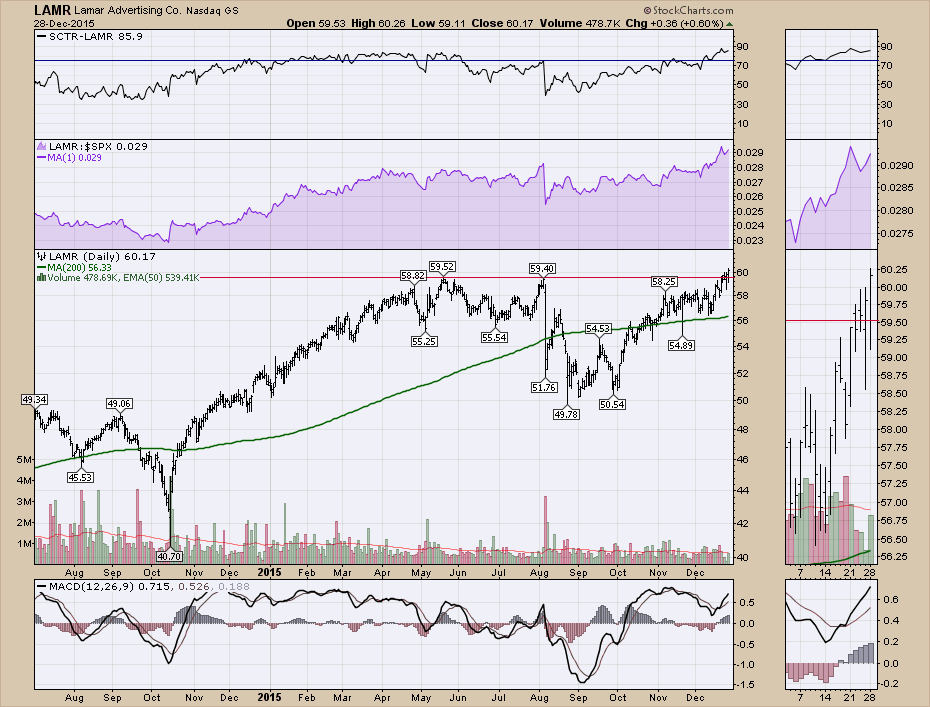
As we set the stage for the next battle of Republicans vs. Democrats, the advertising world sets its sights on getting a piece of the action... Read More
Don't Ignore This Chart! December 28, 2015 at 12:01 PM
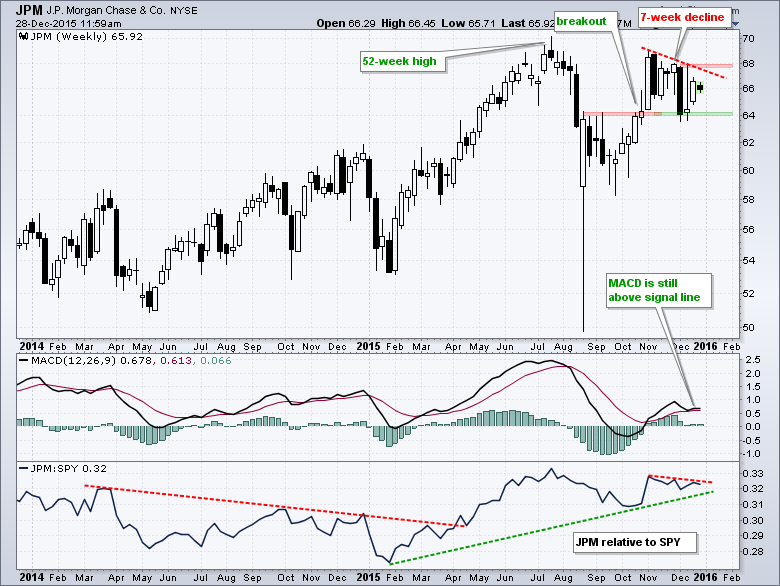
The Finance SPDR (XLF) and big banks led the market surge from late September to early November, but turned into laggards over the last seven weeks... Read More
Don't Ignore This Chart! December 26, 2015 at 10:48 AM
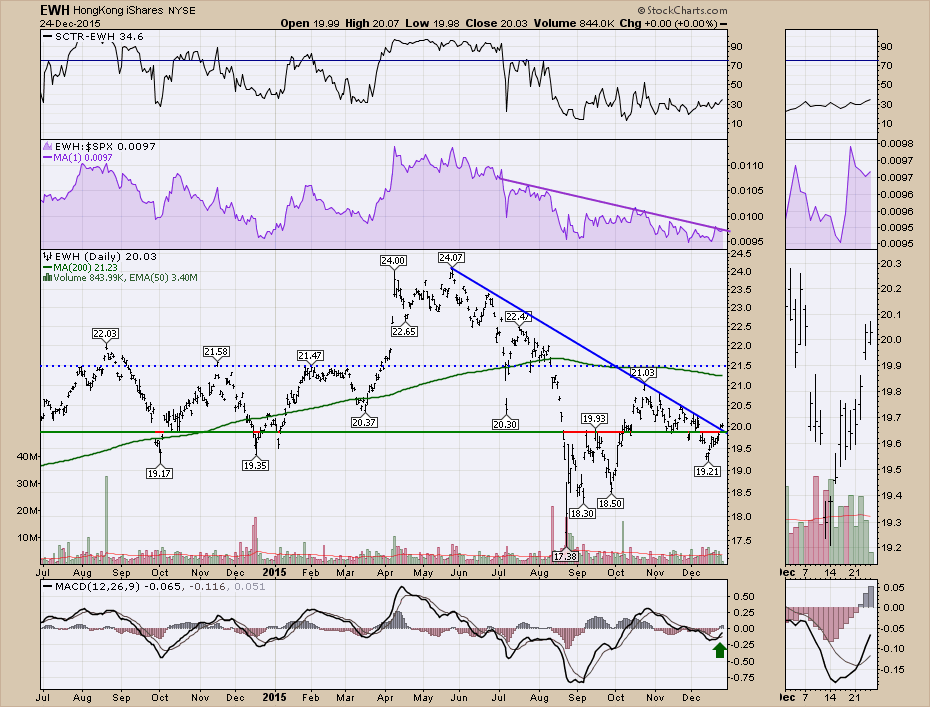
The Hong Kong tracking ETF (EWH) has been immersed in a downtrend for a while. It moved above a 7-month trend line on Wednesday which makes it a very interesting candidate for review. The EWH also moved above a support/resistance line around $19.90... Read More
Don't Ignore This Chart! December 24, 2015 at 02:44 PM
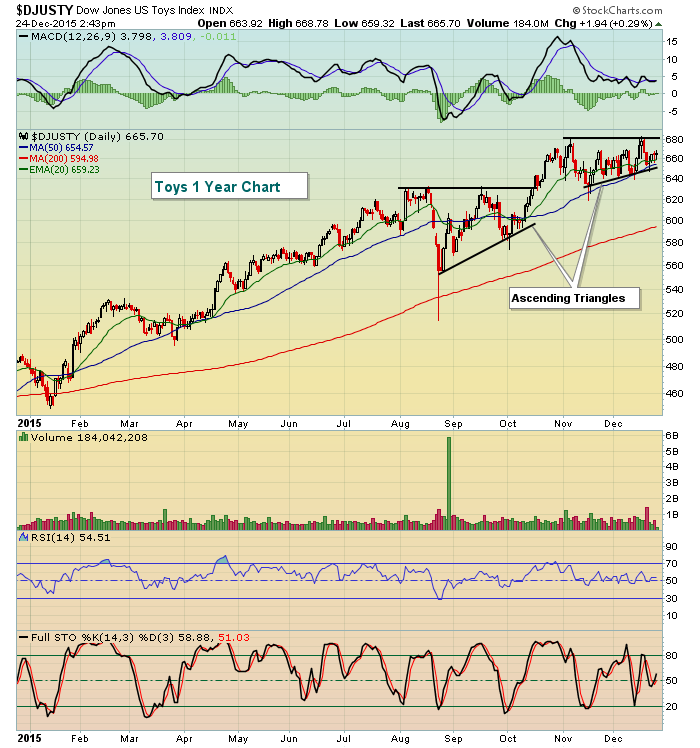
The Dow Jones U.S. Toys Index ($DJUSTY) is ending the year just about the same way it began - on a very bullish note. Recently, the DJUSTY completed a bullish ascending triangle pattern in August and September before breaking out in October... Read More
Don't Ignore This Chart! December 23, 2015 at 09:58 AM
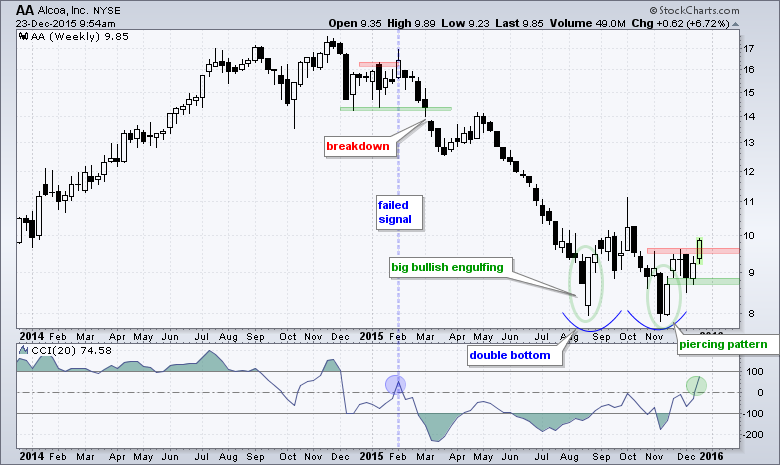
Alcoa is showing early signs of relative strength and momentum is improving as the Commodity Channel Index (CCI) breaks into positive territory for the first time since February. 2015 was clearly a rough year as the stock fell over 35% from January to August... Read More
Don't Ignore This Chart! December 22, 2015 at 11:20 PM
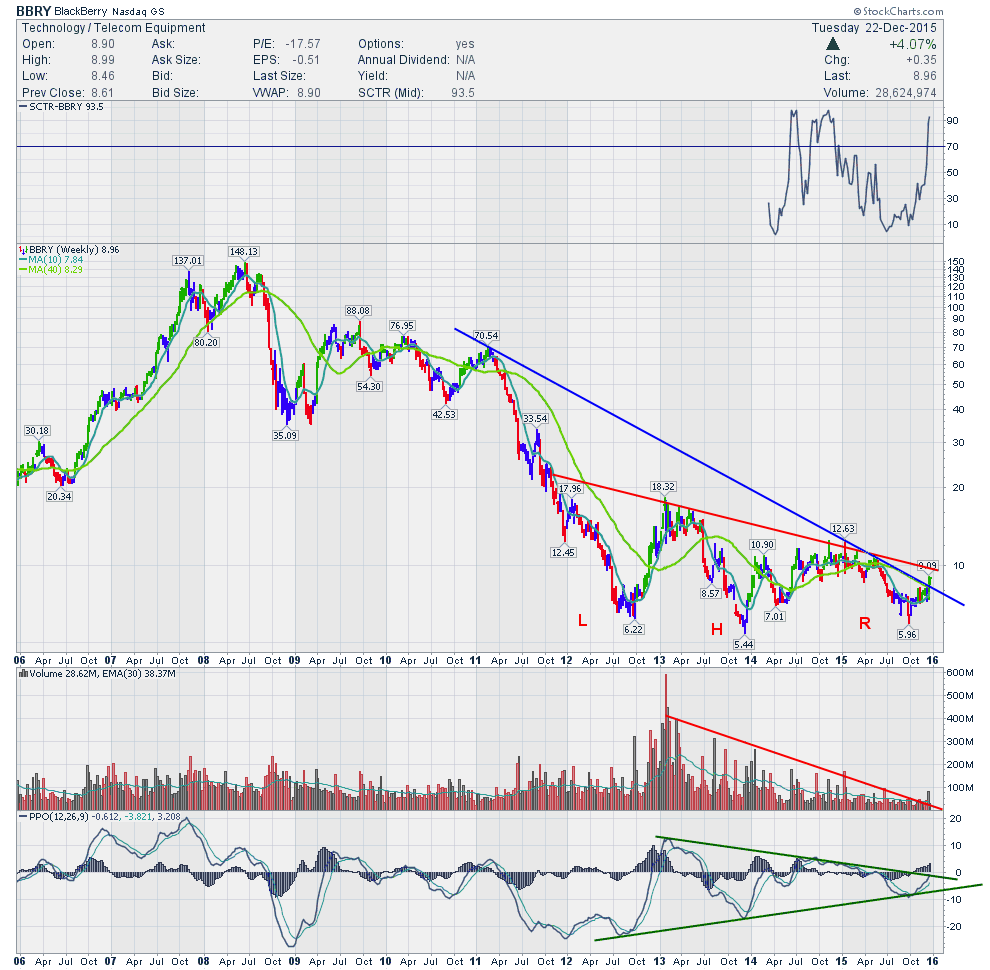
Blackberry (BBRY) has been the most unloved tech stock in a cradle of optimism. After living in a massive downtrend for the last 7 years, Blackberry started to perk up recently. While there have been a few bear market bounces for Blackberry, this looks different this time... Read More
Don't Ignore This Chart! December 21, 2015 at 08:06 AM
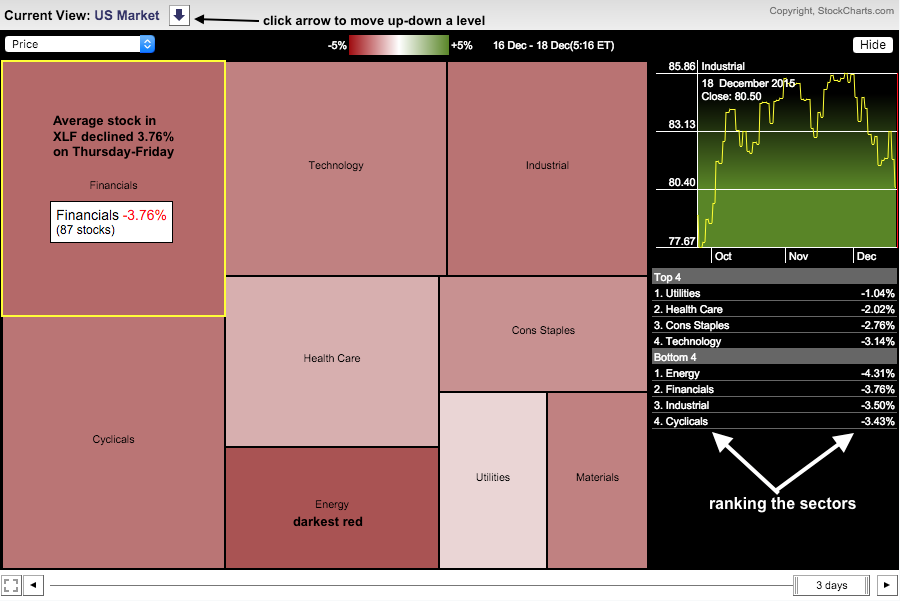
Stocks were hit hard on Thursday and Friday with most closing down sharply. There were a few gainers amongst the carnage and chartists can use the MarketCarpet to find such stocks. First, note that the S&P 500 was down 3.26% on Thursday-Friday and down .34% for the week... Read More
Don't Ignore This Chart! December 20, 2015 at 08:54 AM
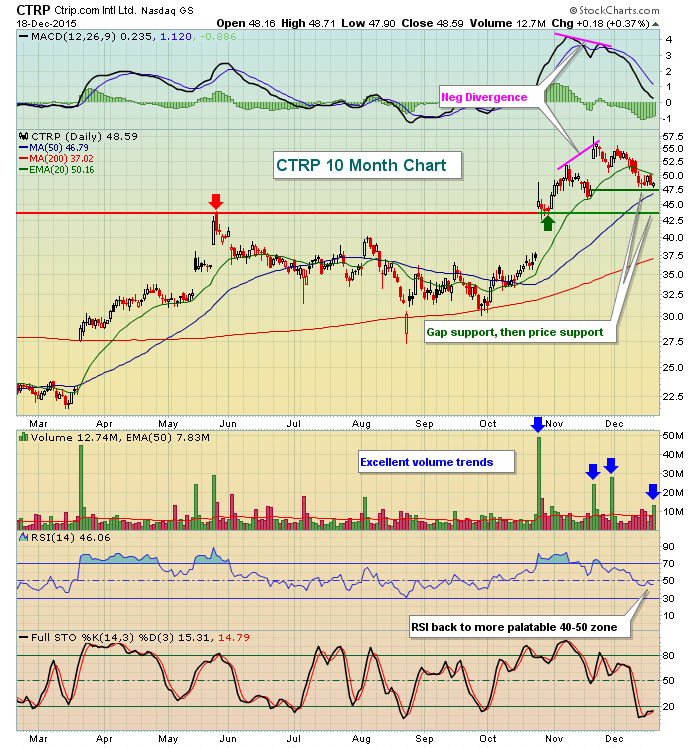
Last month, Ctrip... Read More
Don't Ignore This Chart! December 18, 2015 at 01:48 PM
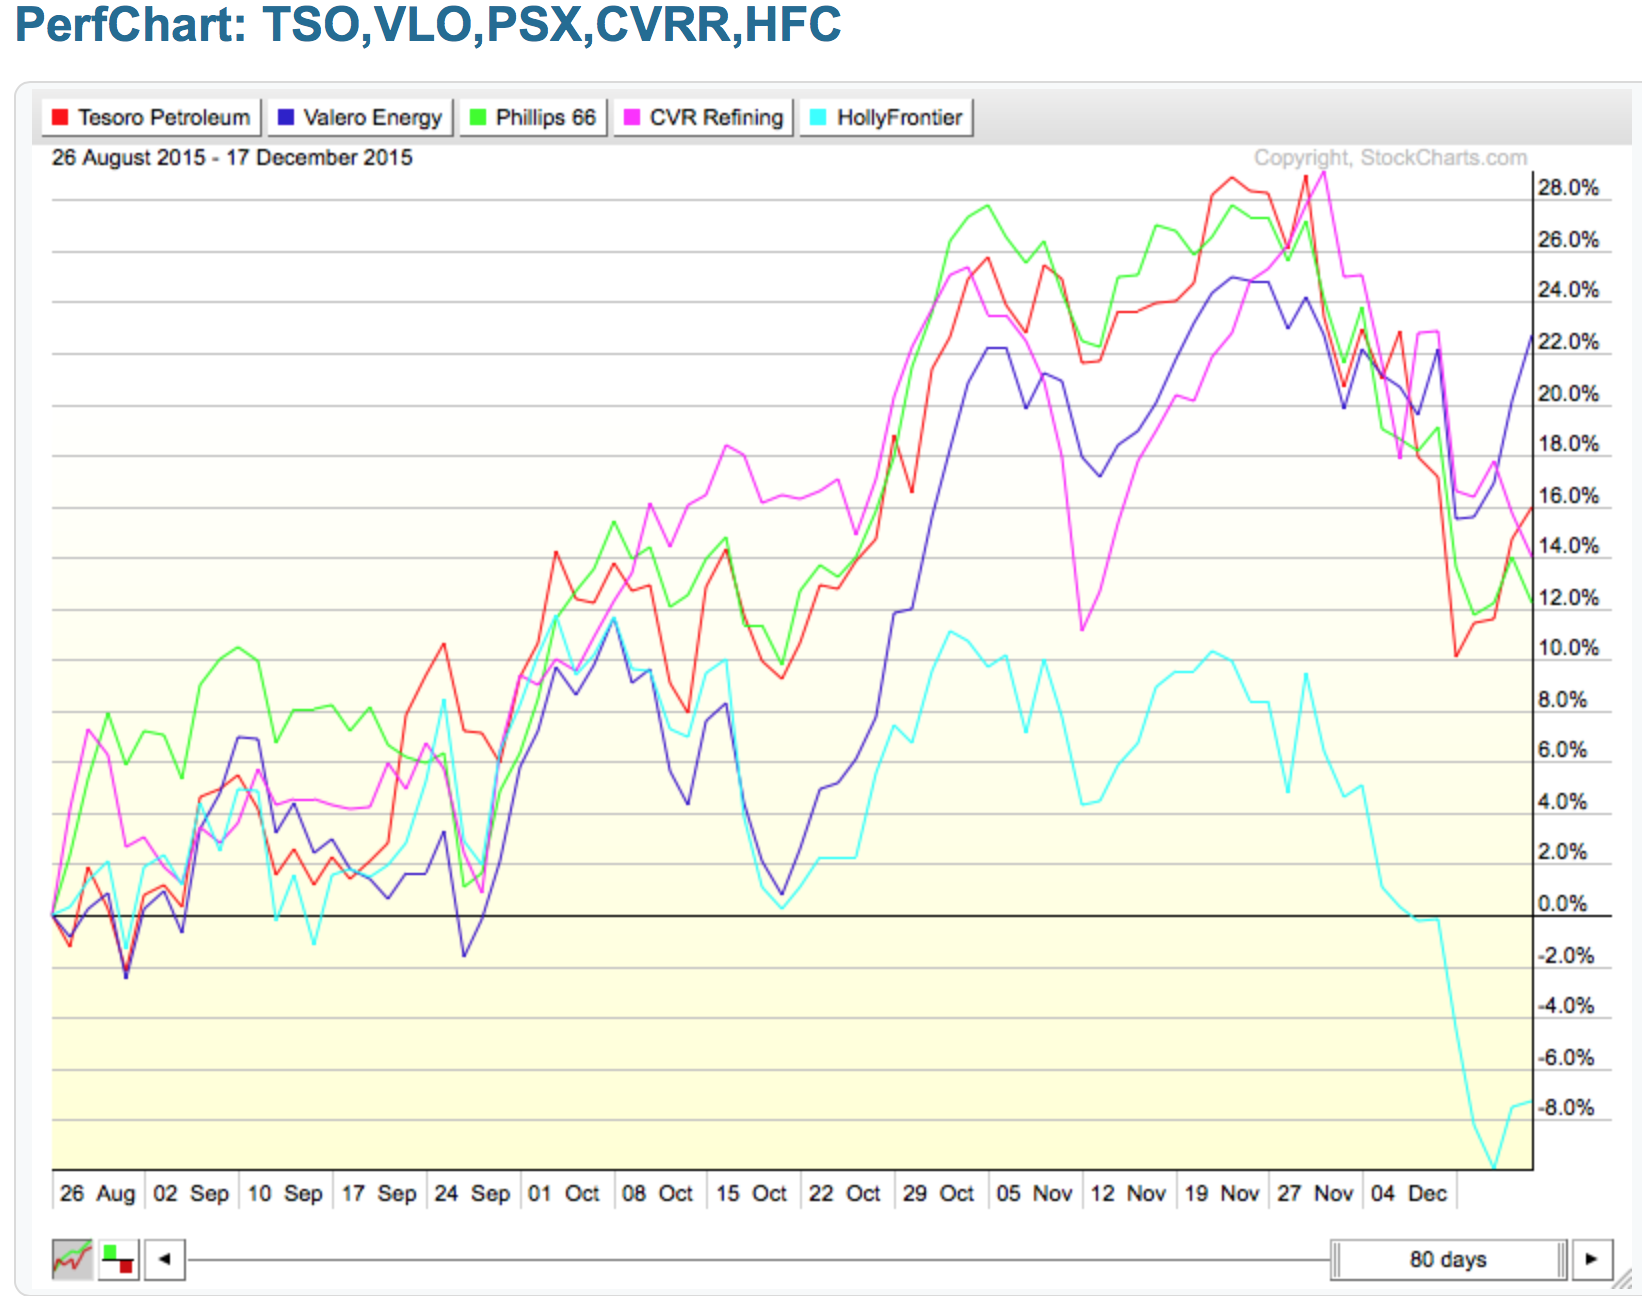
US Distillate demand is down over 8% this year. That is huge. Gasoline Demand is up 0.7% Total Product inventories (Page 3) are eyeballed about 15% above the 5-year range for this time of year while product demand is inside the normal 5-year range and consistent with 2014... Read More
Don't Ignore This Chart! December 17, 2015 at 04:00 PM
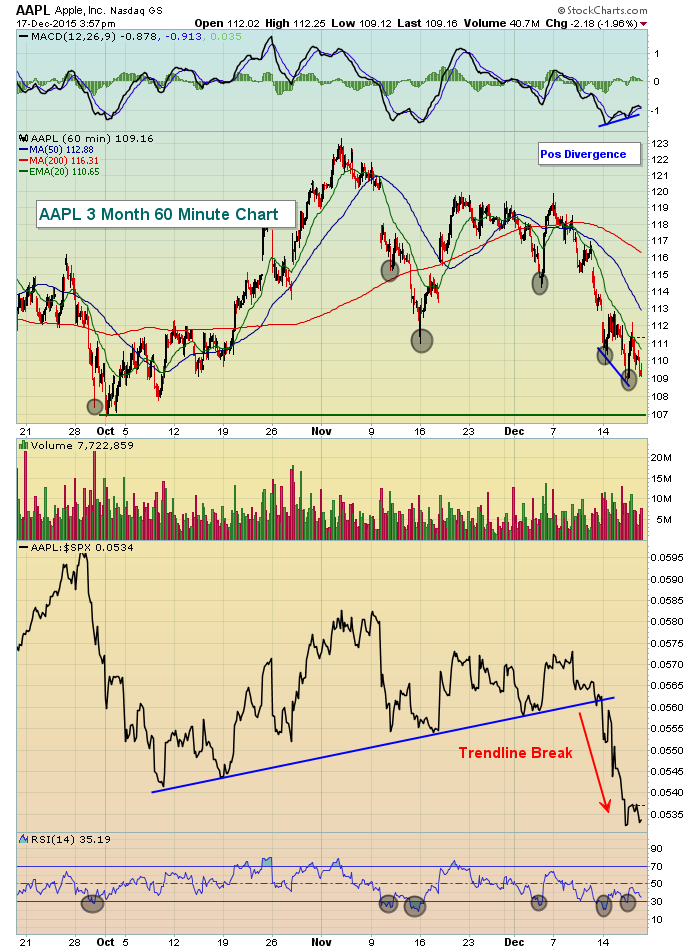
Apple (AAPL) is breaking down beneath its November low and on the surface appears to be a broken stock, but its intraday 60 minute chart is telling a much different story... Read More
Don't Ignore This Chart! December 16, 2015 at 05:32 PM
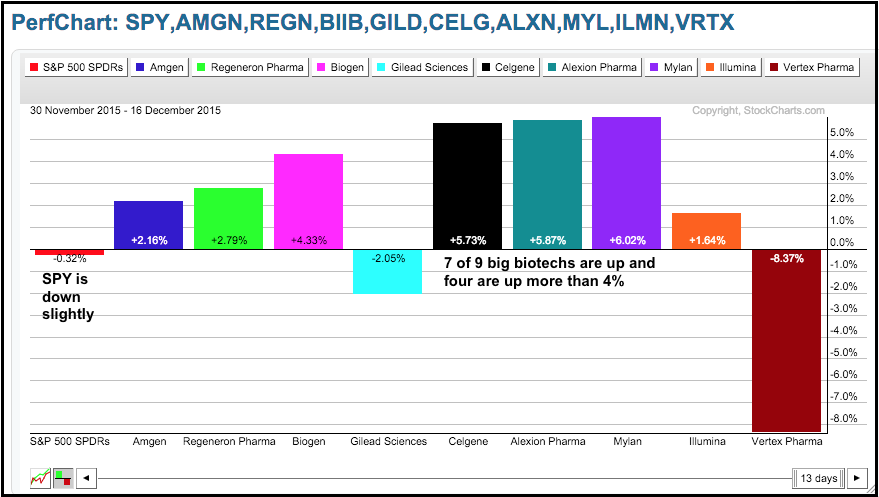
December got off to a rough start for the broader market, but several big biotechs bucked the selling pressure and moved higher. The Perfchart below shows December performance for SPY and the nine biggest biotechs in the Biotech iShares (IBB)... Read More
Don't Ignore This Chart! December 15, 2015 at 03:04 PM
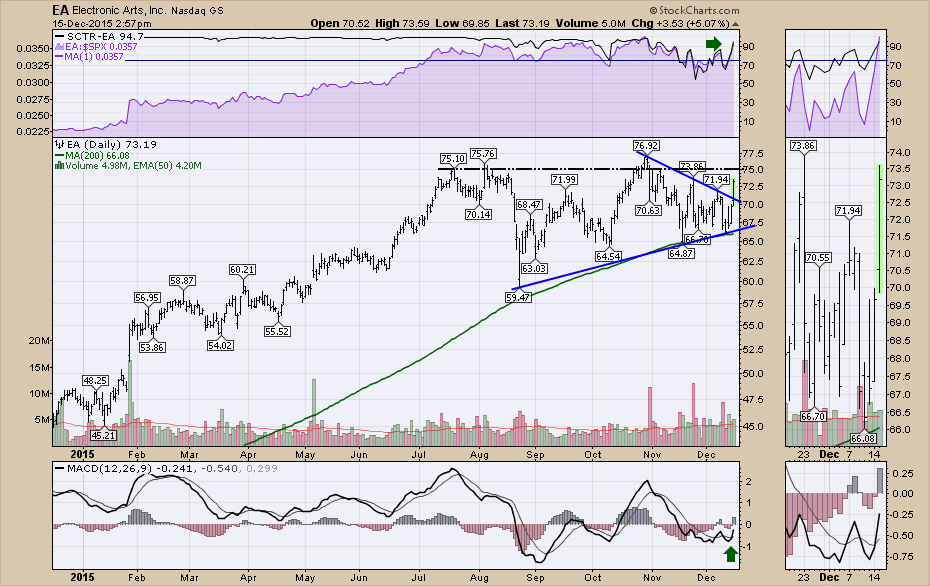
The Electronic Arts Company (EA) has really been on a roll the last few years. Recently the stock started to consolidate in a tight range sideways. But this week, the momentum looks higher again. Today, it is outpacing the broader indexes and is on its way to the $75 level... Read More
Don't Ignore This Chart! December 14, 2015 at 11:02 AM
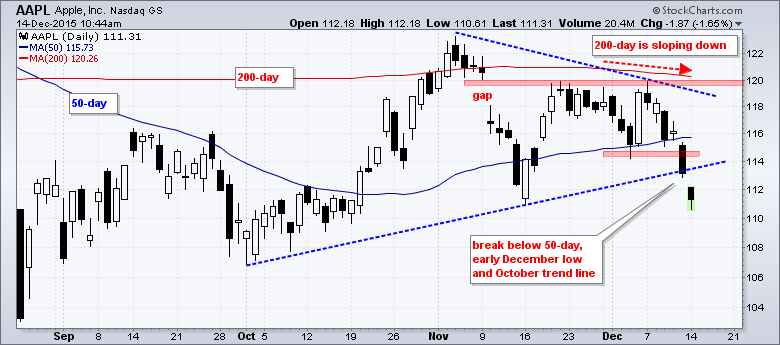
Apple shows signs of a long-term downtrend because it failed at a key long-term moving average and just broke a medium-term moving average... Read More
Don't Ignore This Chart! December 13, 2015 at 08:21 AM
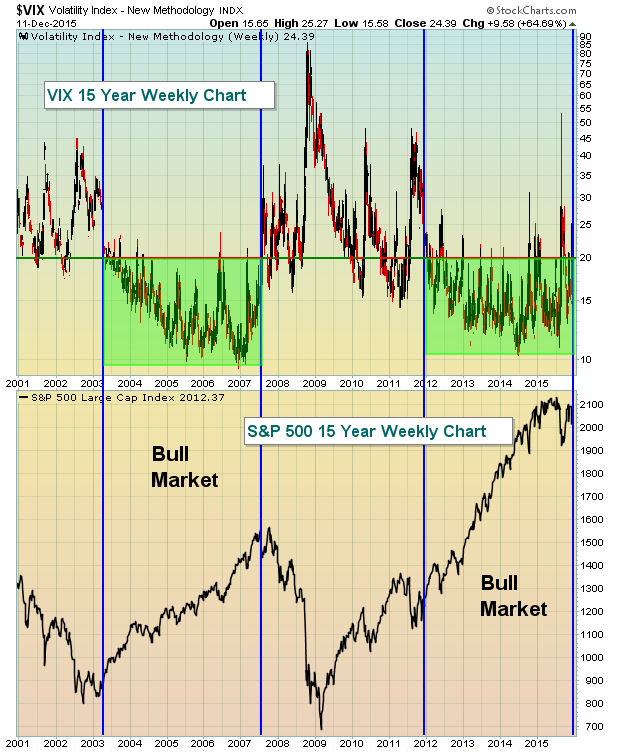
Conditions changed on Friday and the short-term market prospects grew significantly riskier. Why? Because in addition to price support breakdowns across many key indices, sectors and industry groups, the volatility index ($VIX) spiked 26% on Friday to close at 24.39... Read More
Don't Ignore This Chart! December 11, 2015 at 12:20 PM
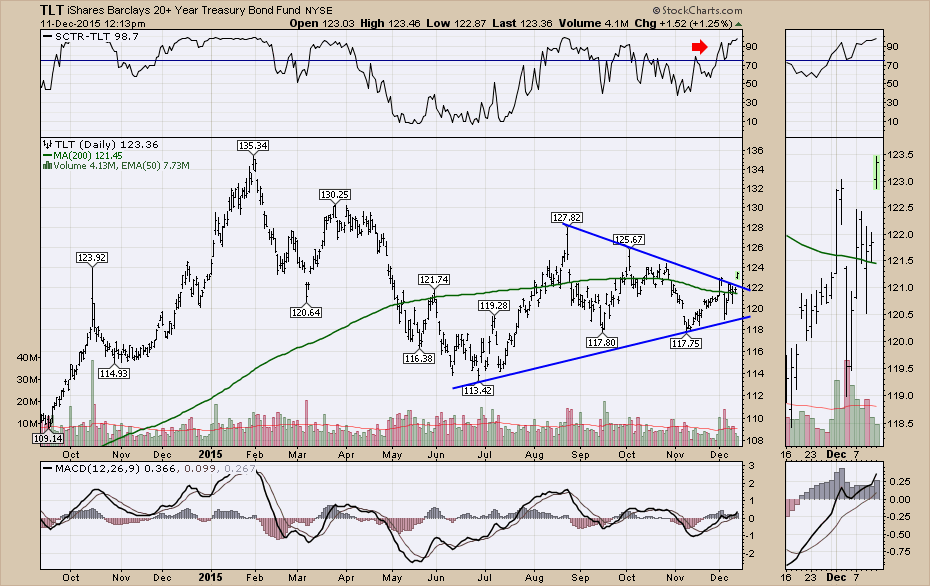
The long bond market (TLT) continues to climb higher in price, but today marks a move outside the trend. The long bond is breaking out to the upside and recently crossed above the 200 DMA. We are seeing the other bond ETF's like IEF moving above the 200 DMA... Read More
Don't Ignore This Chart! December 10, 2015 at 04:56 PM
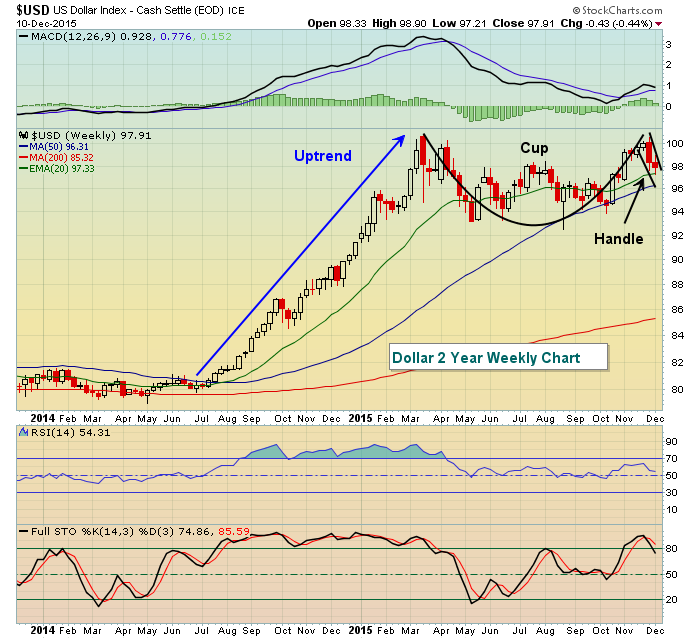
The U.S. Dollar index ($USD) saw a parabolic rise from mid-2014 through March 2015 and has been consolidating since in a classic cup with handle pattern... Read More
Don't Ignore This Chart! December 09, 2015 at 10:22 AM
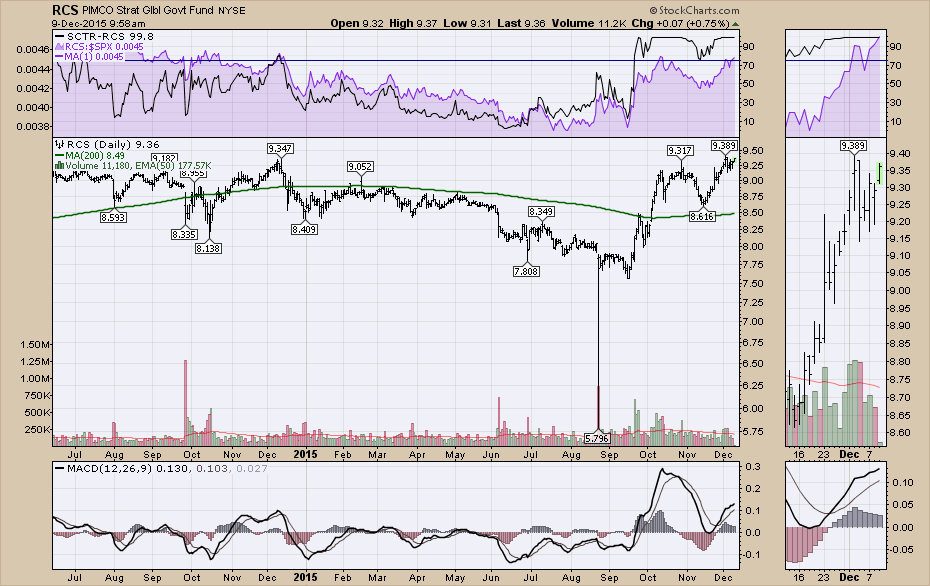
From a chartlist of ETF's that I have built, the vast majority of the list is led by different bond/fixed income/income strategies currently. Currently, the PIMCO Strategic Global Government Fund ETF (RCS) has an SCTR of 99.8 and the ETF is breaking out to new 52 week highs... Read More
Don't Ignore This Chart! December 07, 2015 at 10:01 AM
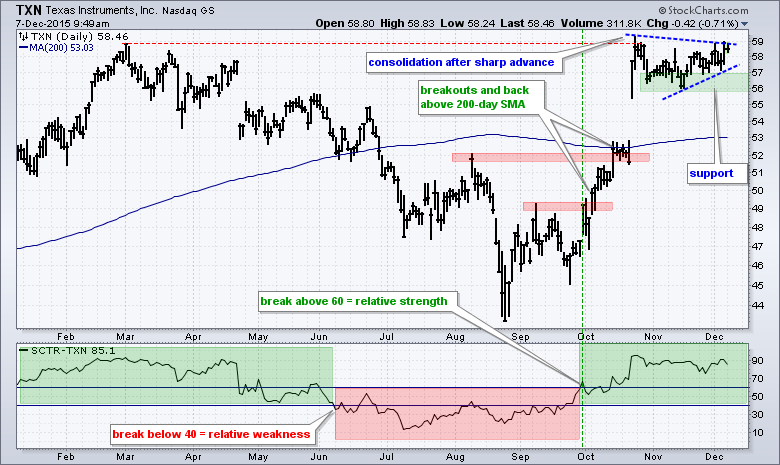
Texas Instruments (TXN) is leading the market with a strong StockCharts Technical Rank (SCTR) and the stock is consolidating near its 52-week high. TXN is part of the semiconductor industry group and the technology sector, both of which have been leading the market lately... Read More
Don't Ignore This Chart! December 05, 2015 at 09:31 AM
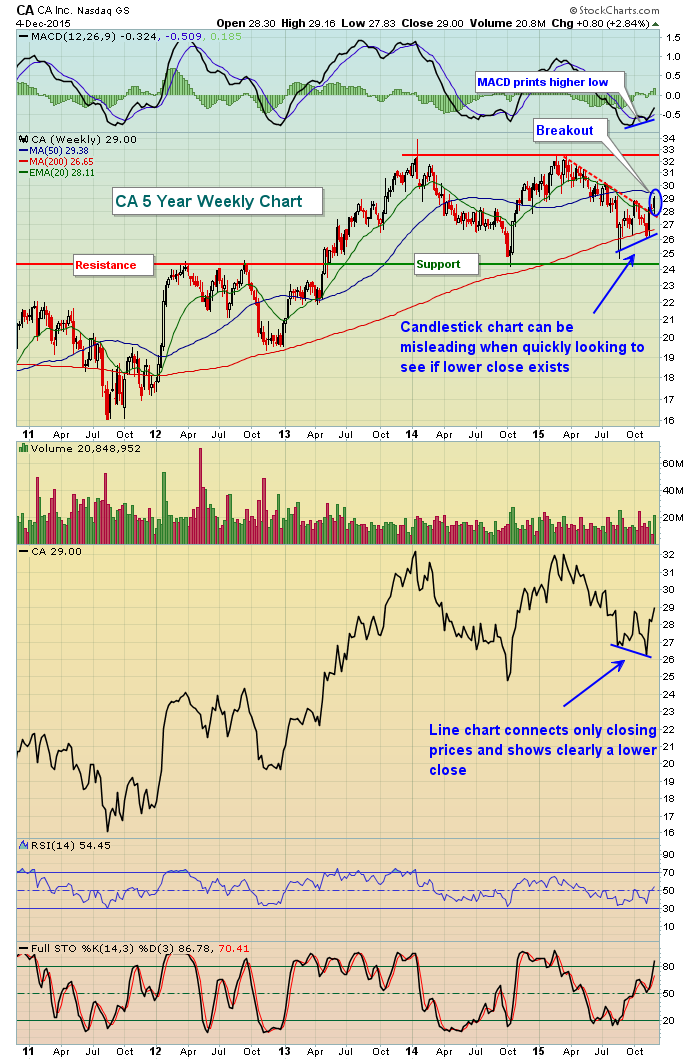
CA Inc (CA) topped in March 2015 and was in the midst of an 8 month downtrend - until last week's action... Read More
Don't Ignore This Chart! December 04, 2015 at 10:21 AM
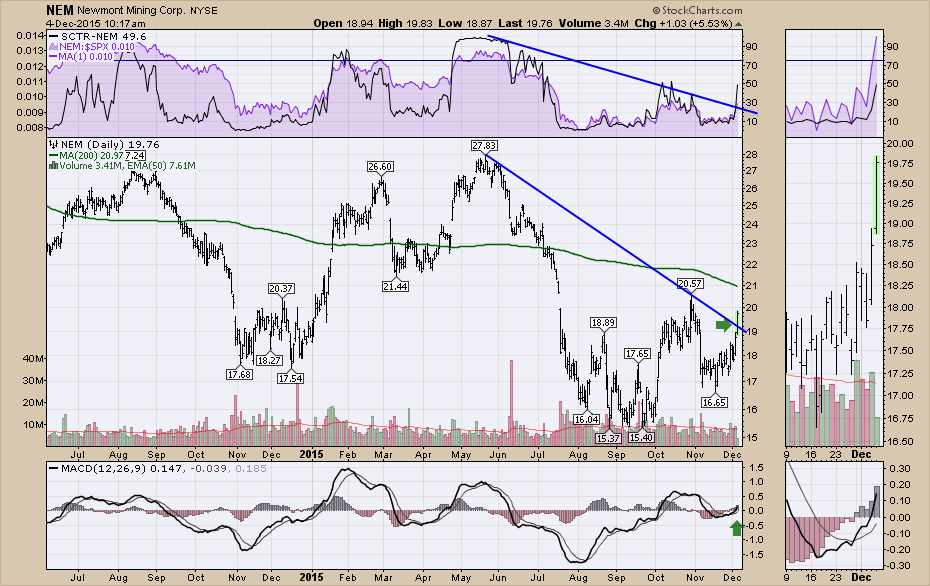
The miners have been outperforming the gold bullion for a few weeks now. They really started to move in the last few days. Newmont Mining (NEM) is one of those. The gold mining stocks started to rally in December of last year as well... Read More
Don't Ignore This Chart! December 03, 2015 at 01:39 PM
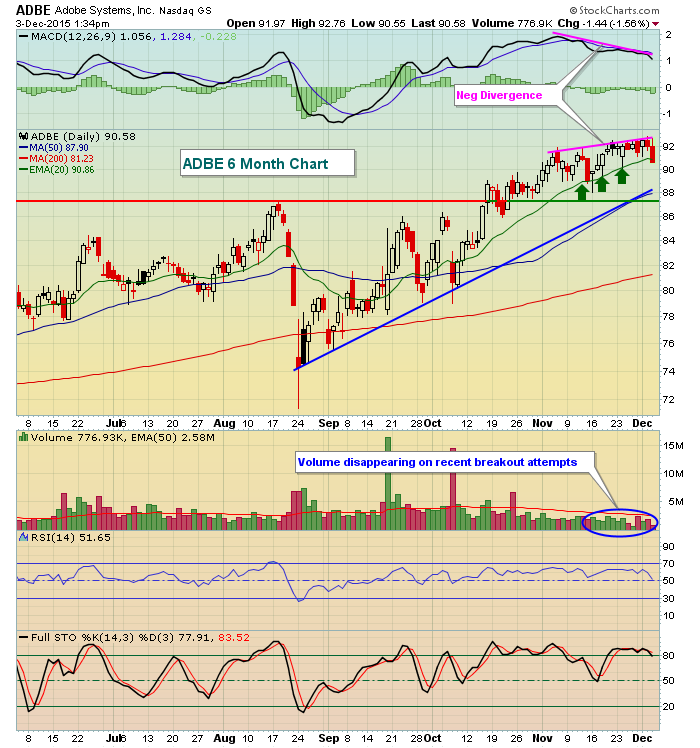
Negative divergences on the MACD and light volume on breakouts are two important criteria in identifying a possible top. Accumulation requires volume so I'm always suspicious if advances begin to run out of it... Read More
Don't Ignore This Chart! December 02, 2015 at 09:17 AM
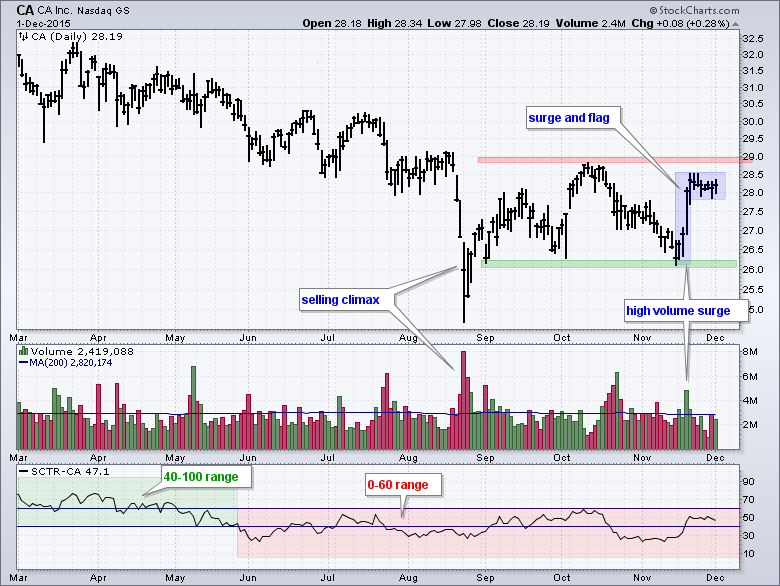
CA Inc (CA) remains in a downtrend, but a reversal could be brewing as the stock forms a high and tight flag just below key resistance. CA was trending down most of the year and then formed a selling climax with a sharp decline on high volume in August... Read More
Don't Ignore This Chart! December 01, 2015 at 03:05 PM
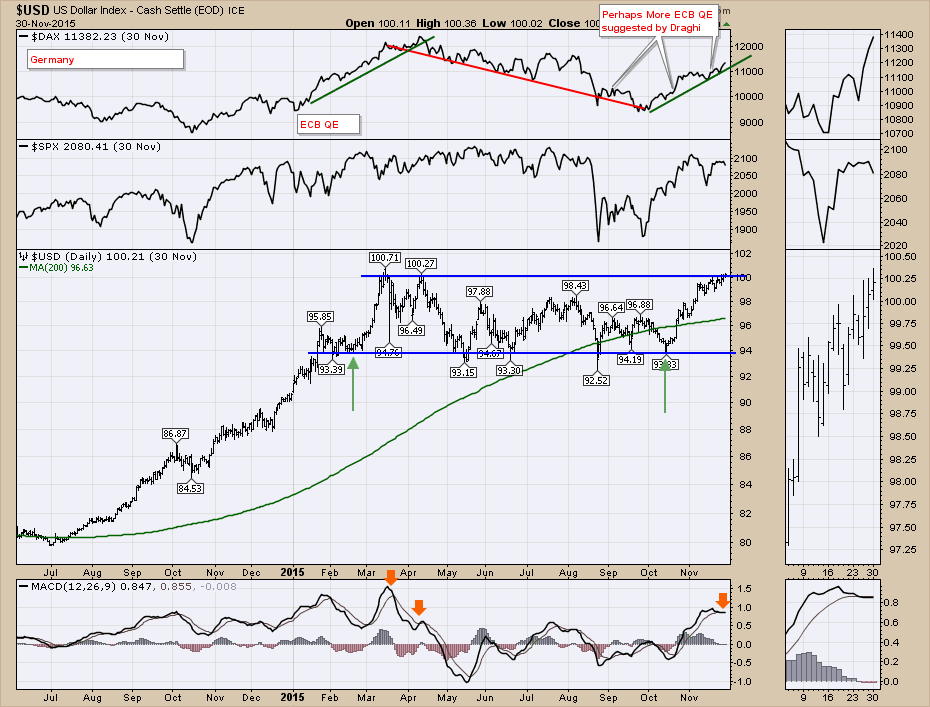
The US Dollar ($USD) is always one of the most important factors in the world markets. A strong dollar has been a major headwind for commodities and emerging markets since the 2011 lows... Read More