Don't Ignore This Chart! February 29, 2016 at 12:14 PM
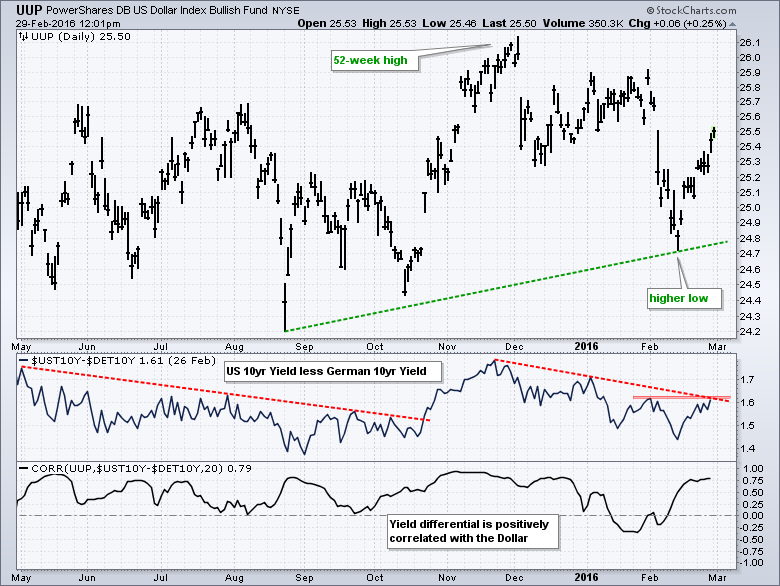
The chart for the US Dollar ETF (UUP) is bit of a mess, but I think the overall trend is up and the US-German yield differential looks poised to move higher. The main chart window shows UUP hitting a multi-month high with the October-November surge... Read More
Don't Ignore This Chart! February 27, 2016 at 11:03 AM
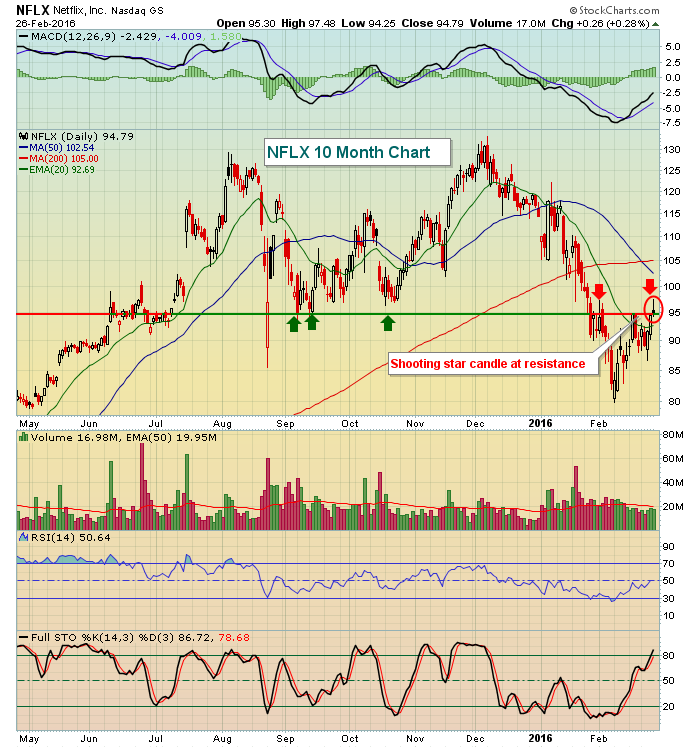
Over the past few months, traders have shunned risk and we've seen many high flyers begin to take big hits. Netflix (NFLX) certainly fits that category and hasn't been immune to the selling. Recently, NFLX traded at a high of 133.27, but has since fallen to a near-term low of 79... Read More
Don't Ignore This Chart! February 26, 2016 at 12:58 PM
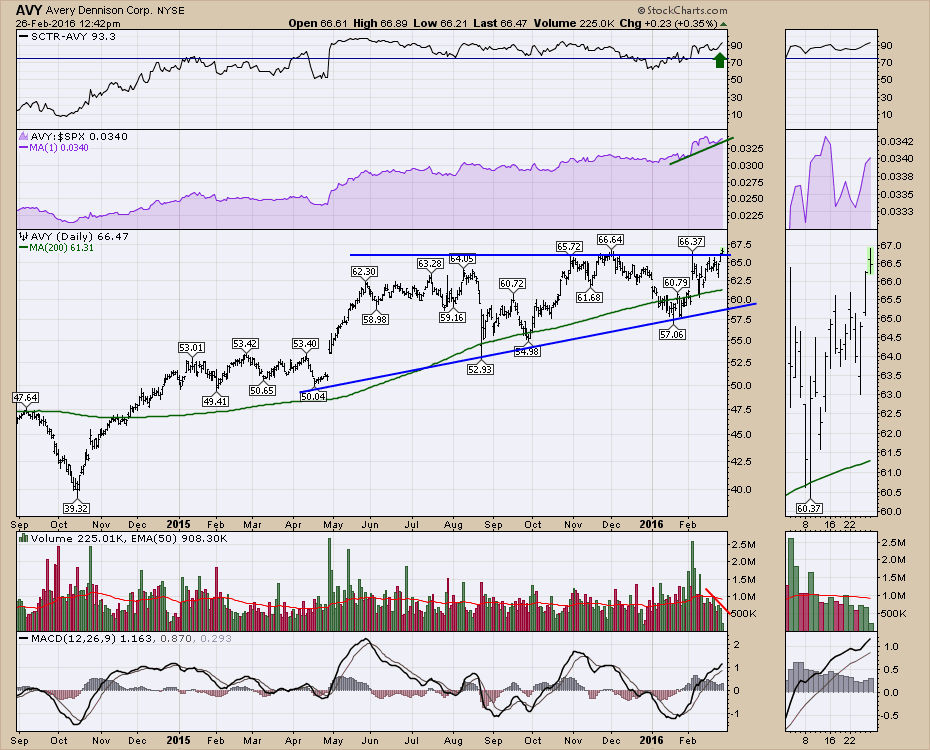
Avery Dennison (AVY) continues to be sticky to the upside. The label maker and specialty chemical company is one of the few to make higher lows and made a new 52-week high today. Every new high is a good thing, but it needs to show some conviction to the upside... Read More
Don't Ignore This Chart! February 25, 2016 at 10:43 AM
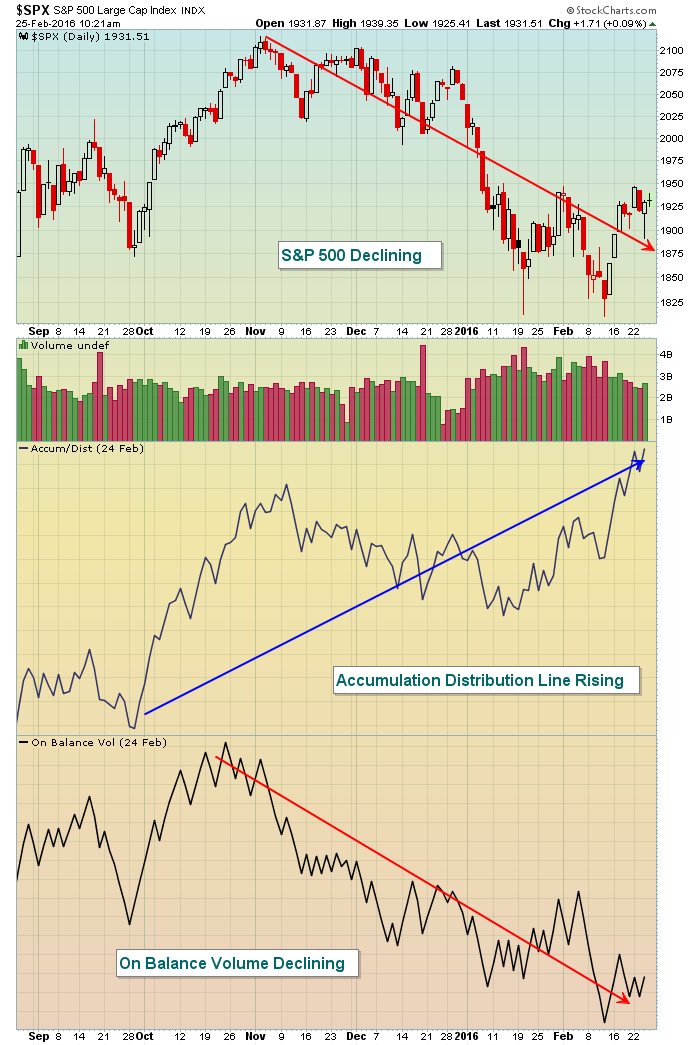
Everyone is trying to evaluate the strength and sustainability of the current U.S. equity rally. StockCharts.com provides us the tools to do just that. But not every indicator tells us the complete truth... Read More
Don't Ignore This Chart! February 24, 2016 at 10:52 AM
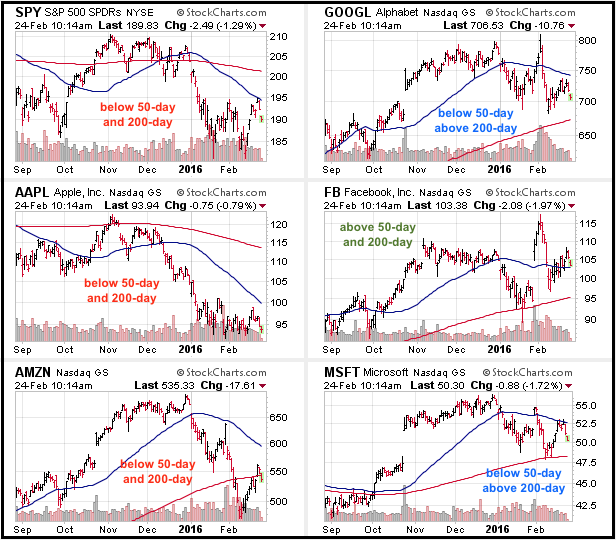
Five stocks dominate the Nasdaq 100 ETF (QQQ) and traders should keep a close eye on these when trading or investing in QQQ. Apple (10.97%), Alphabet (9.34%), Microsoft (8.5%), Amazon (5.39%) and Facebook (4.98%) account for almost 40% of QQQ... Read More
Don't Ignore This Chart! February 22, 2016 at 02:38 PM
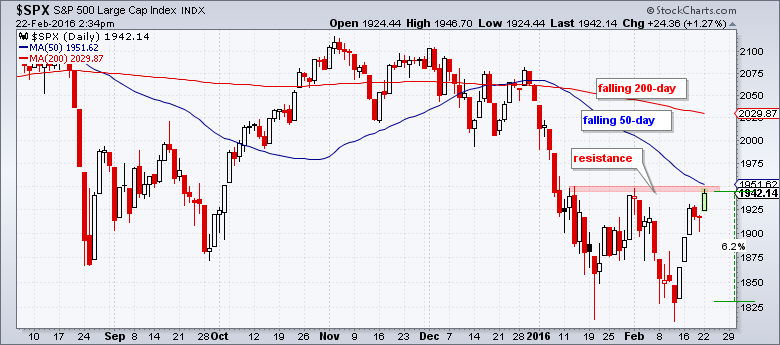
The S&P 500 is setting up for its first test as it nears resistance in the 1950 area. The chart below shows the index below the falling 200-day SMA and the 50-day SMA below the 200-day SMA... Read More
Don't Ignore This Chart! February 21, 2016 at 12:43 PM
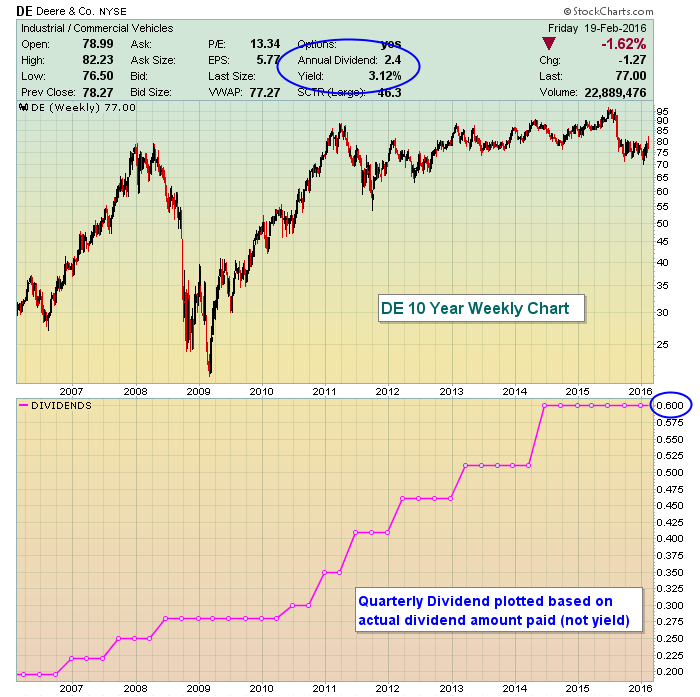
Just about one year ago, StockCharts.com unveiled a "dividend indicator" to allow you to plot the history of dividends on a particular U.S. or Canadian stock. For those who are income-oriented, it's a great way to review the history of dividends that a company has paid... Read More
Don't Ignore This Chart! February 19, 2016 at 12:34 PM
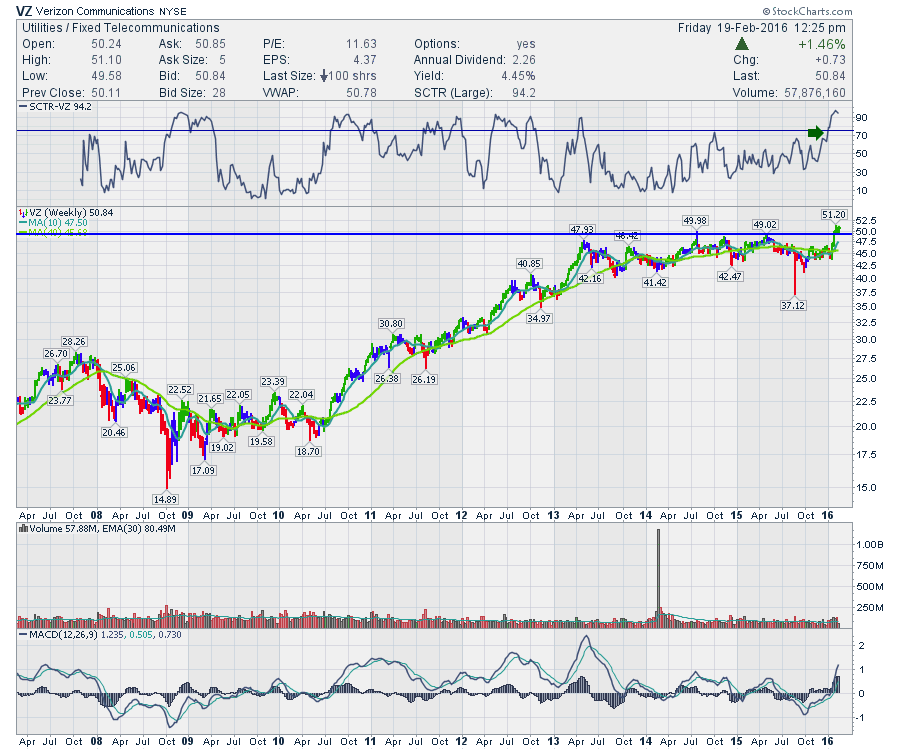
In this primary bear market, finding rising stock prices is a difficult task. Verizon (VZ) recently moved up aggressively. With a 4% yield and impressive momentum, Verizon is holding up well against broader market weakness. The price action has sent the SCTR to above 94... Read More
Don't Ignore This Chart! February 18, 2016 at 07:29 PM
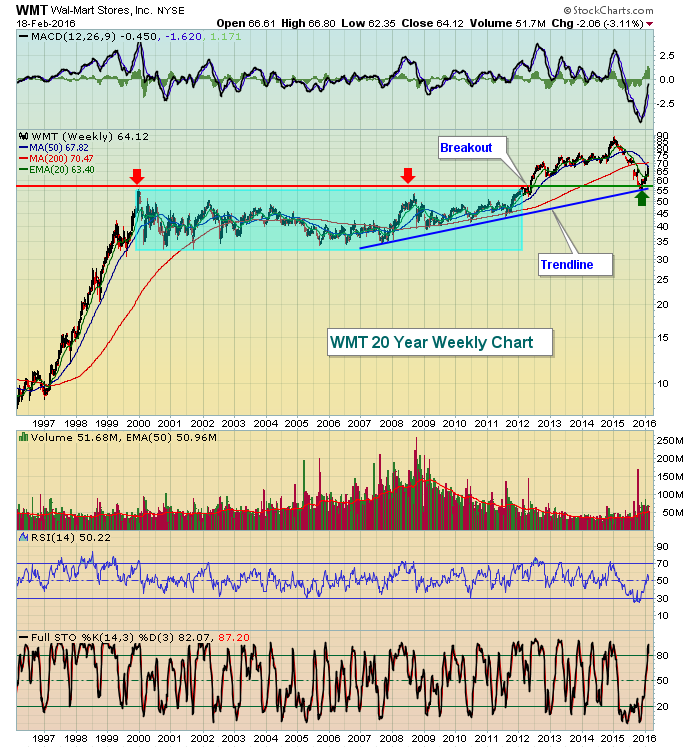
Wal-Mart (WMT) based for more than a decade beginning in 2000 before it finally made a significant technical breakout in 2012. WMT then nearly tripled over the next three years before stumbling over the past year... Read More
Don't Ignore This Chart! February 17, 2016 at 04:52 PM
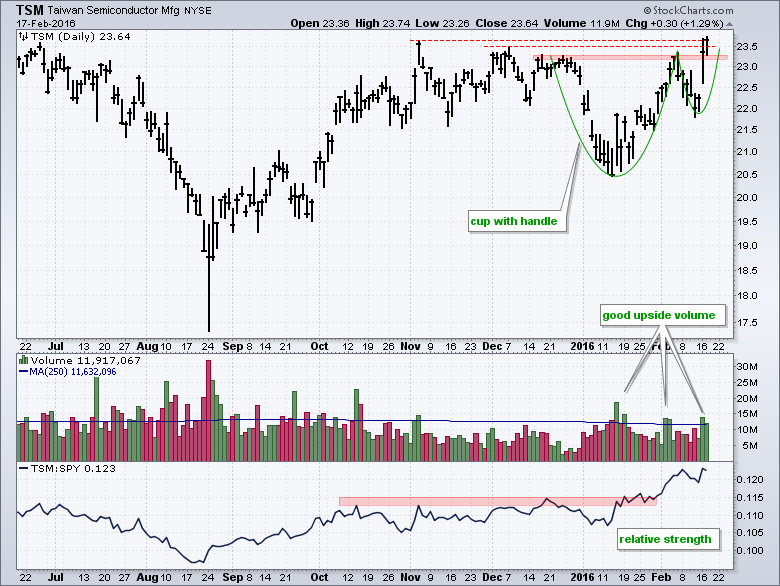
Taiwan Semiconductor is breaking out of a bullish pattern with good volume and the stock is showing relative strength. The price chart shows a cup-with-handle forming from December to mid-February. This is a bullish continuation pattern that was popularized by William O'Neil... Read More
Don't Ignore This Chart! February 16, 2016 at 12:04 PM
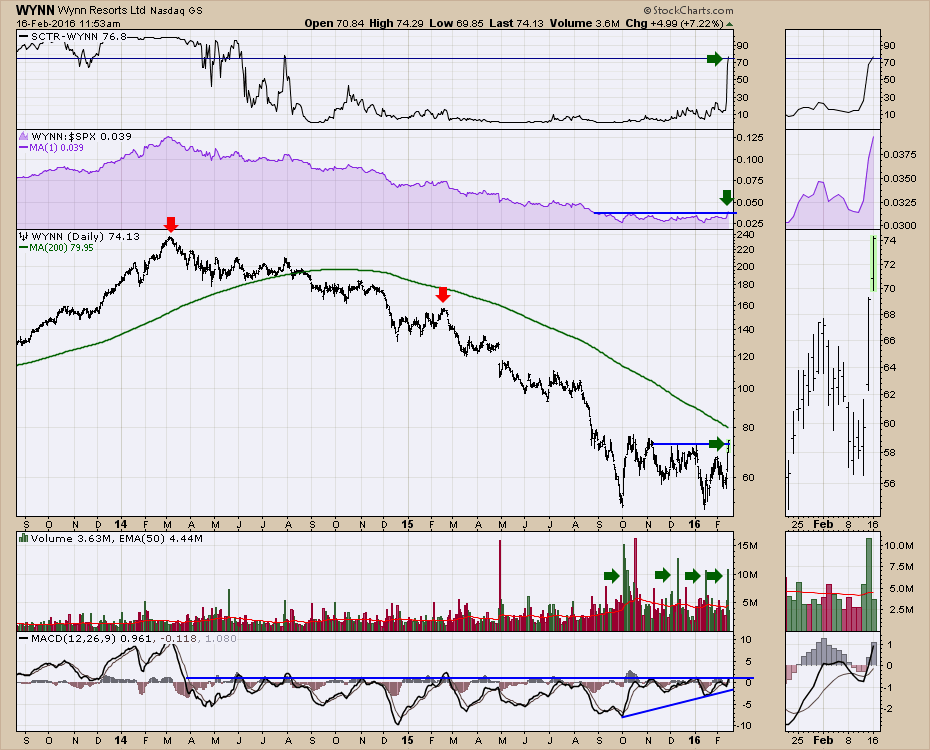
Wynn Resorts has been on a train out of town for a while. After making a major high just under $250 back in 2014, WYNN has been the casino stock that continually cleaned money out of your wallet. However, some things have changed this year... Read More
Don't Ignore This Chart! February 13, 2016 at 05:48 PM
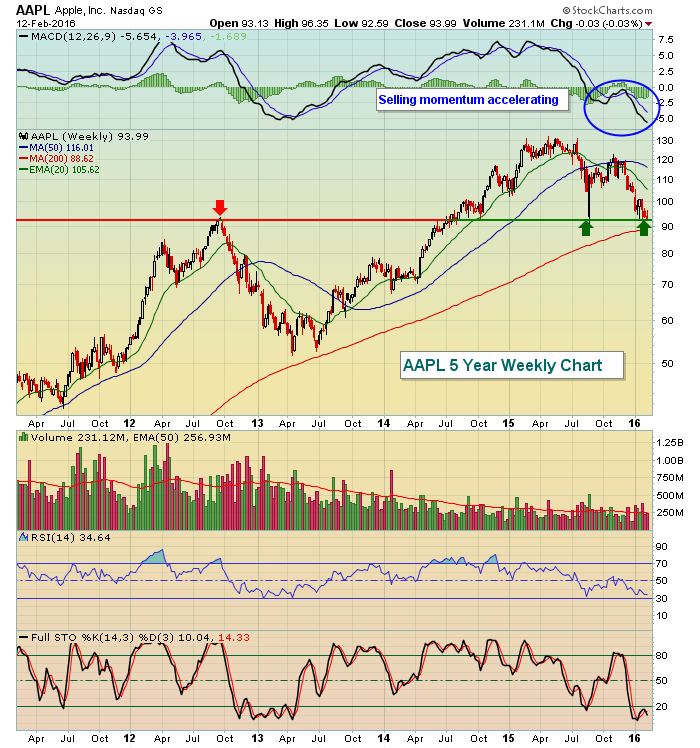
It's difficult to argue that Apple has been one of the best performing stocks - if not the best - in the 21st century. But every stock has its limitations and a good question is whether AAPL has reached its top. AAPL has fallen 30% from its peak in May 2015... Read More
Don't Ignore This Chart! February 12, 2016 at 09:28 AM
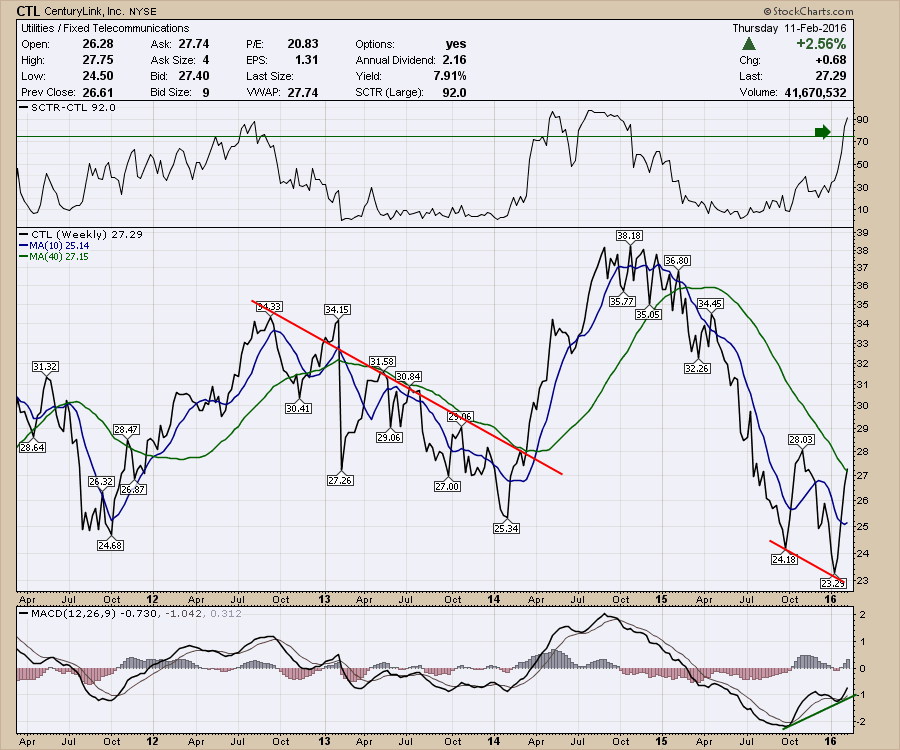
Centurylink (CTL) is in the Utility Sector as a fixed communication broadband provider. While they have other operations, the chart is interesting today for a few reasons... Read More
Don't Ignore This Chart! February 11, 2016 at 12:57 PM
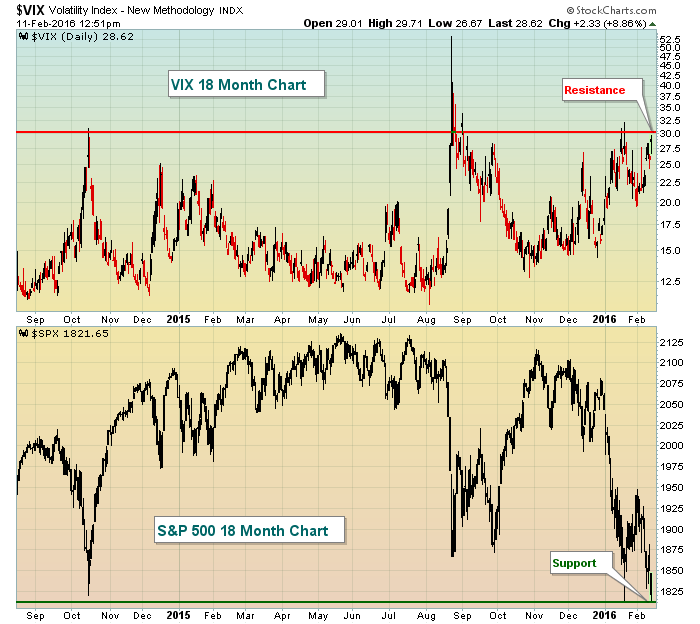
Volatility and S&P 500 performance tend to move in opposite directions. As fear escalates and the VIX prices in higher expected volatility, equity markets sell off... Read More
Don't Ignore This Chart! February 10, 2016 at 12:23 PM
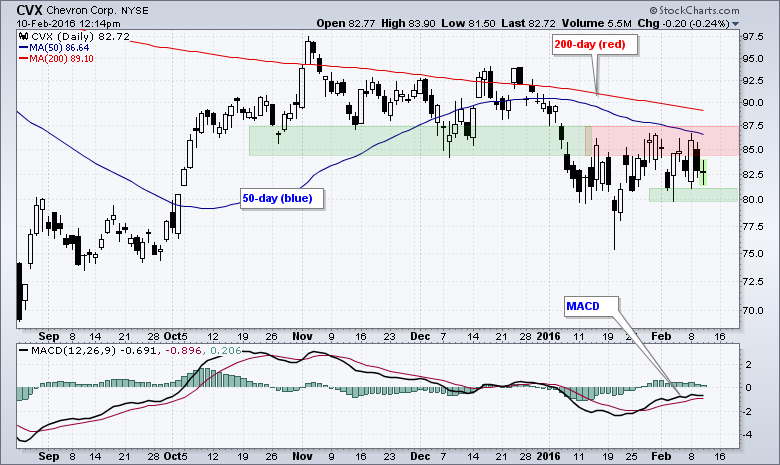
Chevron (CVX) is a long-term downtrend and looks vulnerable to another leg lower. The price chart shows CVX trading below the falling 200-day moving average and below the 50-day moving average. Also notice that the 50-day is below the 200-day... Read More
Don't Ignore This Chart! February 10, 2016 at 01:11 AM
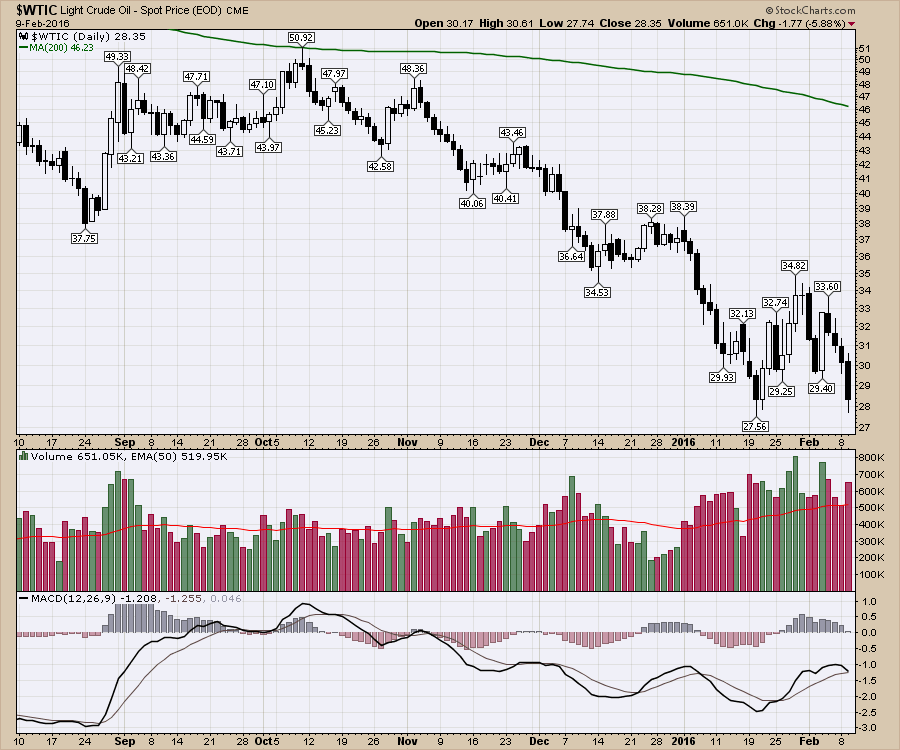
West Texas Intermediate Crude ($WTIC) fell back under $28 to retest the lows of January. So far, the trend in price still has a pattern of lower highs and lower lows... Read More
Don't Ignore This Chart! February 08, 2016 at 10:39 AM
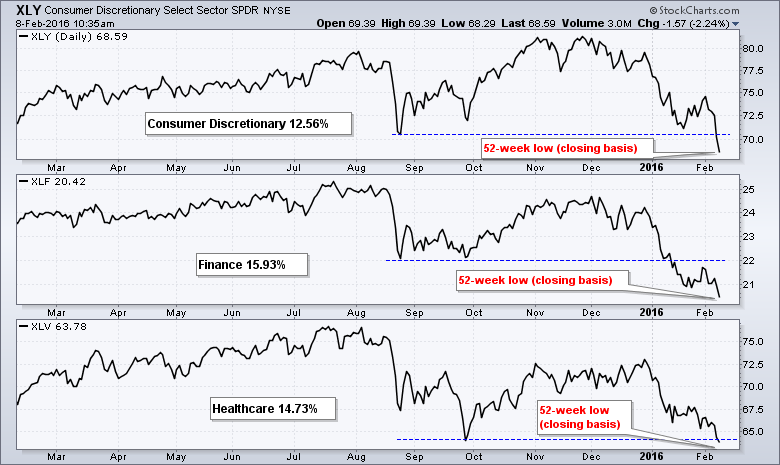
There are nine sectors in the S&P 500 SPDR (SPY) and their weights range from 2.82% (materials) to 20.17% (technology). The technology sector is around seven times bigger than the materials sector and this means that not all sectors affect the S&P 500 the same... Read More
Don't Ignore This Chart! February 07, 2016 at 11:13 PM
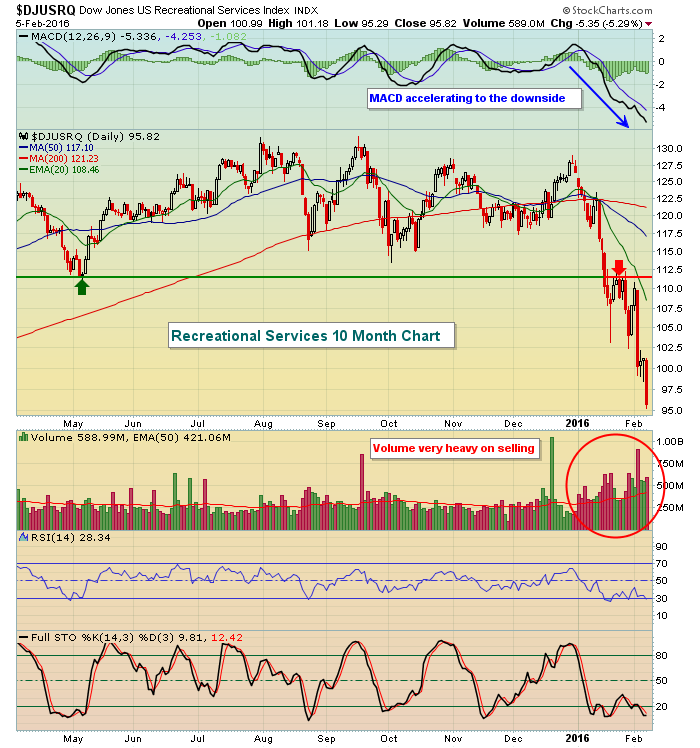
The Dow Jones U.S. Recreational Services Index ($DJUSRQ) fell more than 11% last week as traders completely ignored the consumer discretionary space (XLY)... Read More
Don't Ignore This Chart! February 05, 2016 at 09:19 AM
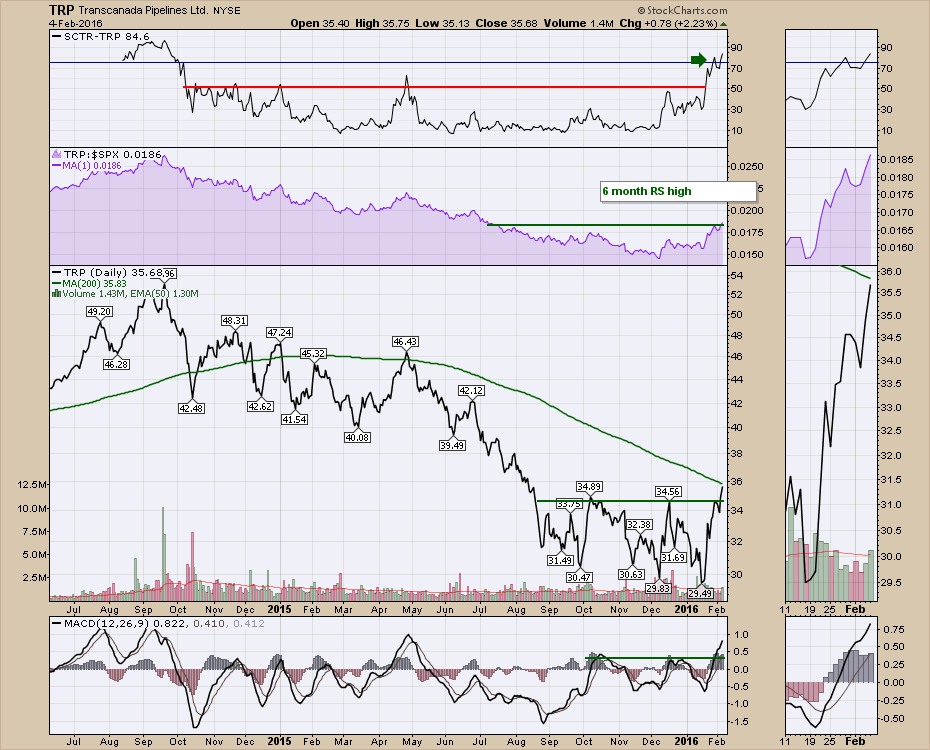
After a brutal beatdown from the politicians about pipelines, TransCanada Pipelines (TRP) stock has started to demonstrate a change in trend. From a continuous decline starting in September 2014 (near oil's high), TransCanada has recently made a 5-month high... Read More
Don't Ignore This Chart! February 04, 2016 at 07:15 PM
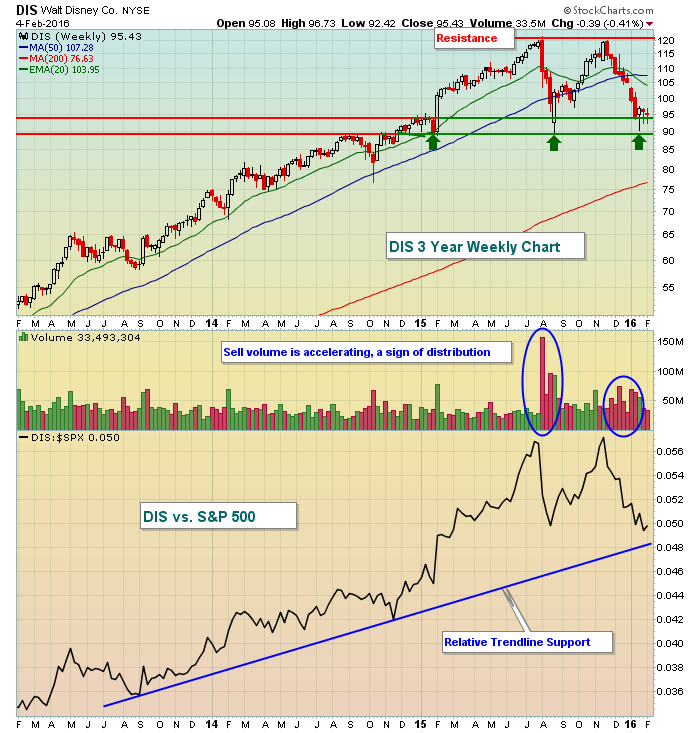
First, it's not helping that the consumer discretionary sector is down more than 10% over the past three months. This sector weakness has manifested itself in a very weak three month performance in Walt Disney (DIS) shares, which have fallen more than 15%... Read More
Don't Ignore This Chart! February 03, 2016 at 11:09 AM
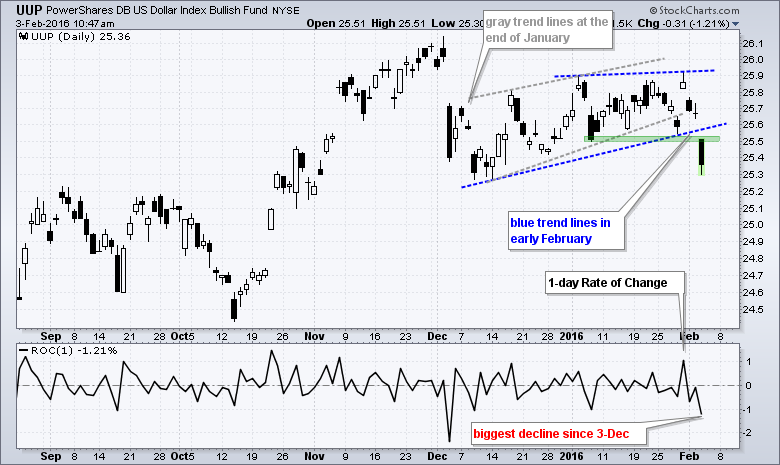
The US Dollar ETF (UUP) is getting whacked on Wednesday and breaking its January lows. The trading day is not over yet, but the Dollar is on pace for its biggest daily decline since early December... Read More
Don't Ignore This Chart! February 02, 2016 at 02:09 PM
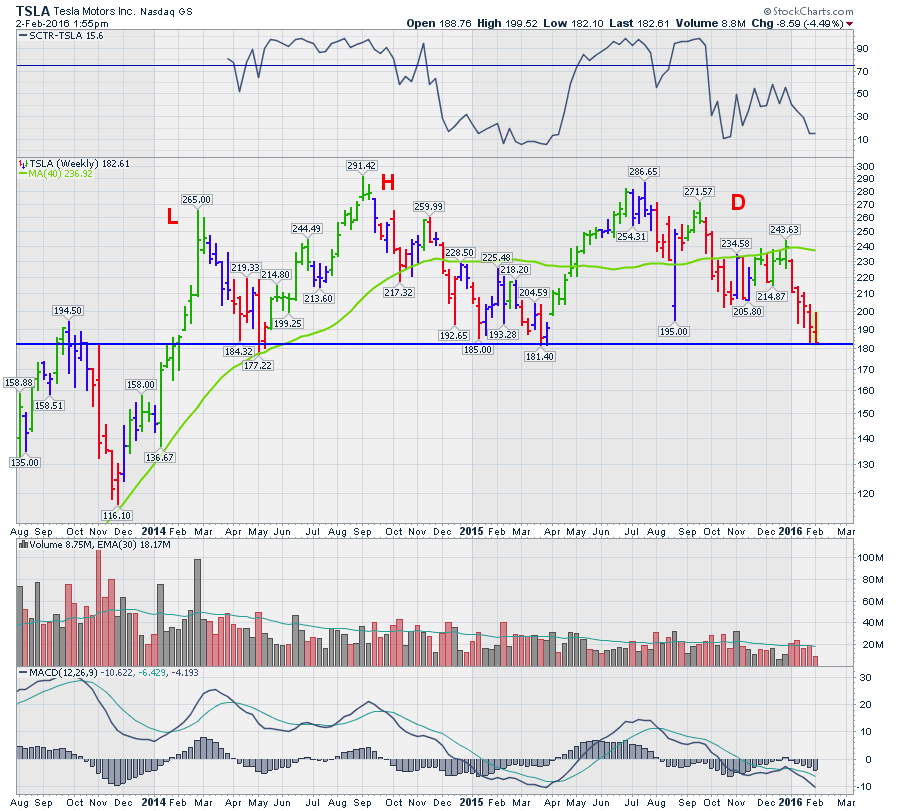
Tesla (TSLA) seems capable of staying in the headlines almost every day. While the other car manufacturers have drizzled below some trendlines on the price charts, Tesla has been able to hold above. Today, the optimism towards Tesla is being tested... Read More
Don't Ignore This Chart! February 01, 2016 at 12:11 PM
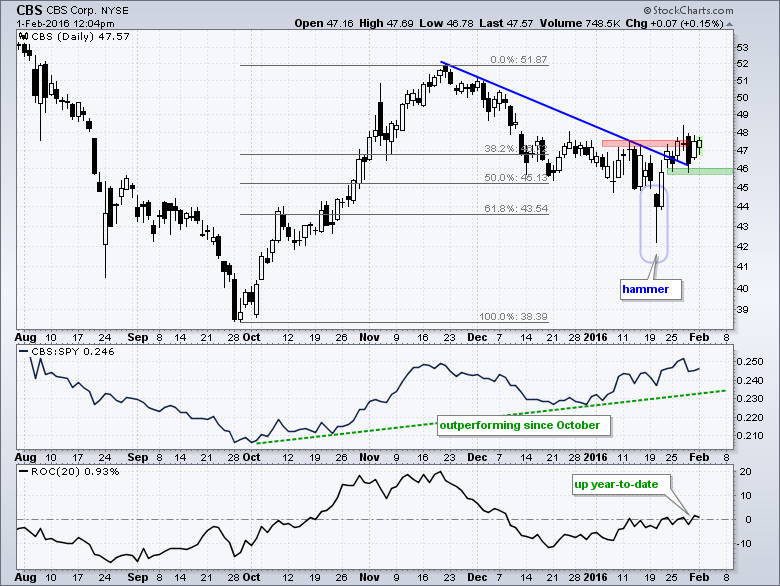
It was a rough January for stocks, but CBS held up quite well and shows a bullish looking chart. On the price chart, CBS sports a classic surge-correct-breakout sequence. First, the stock advanced over 20% with a move from ~39 to ~52... Read More