Don't Ignore This Chart! August 31, 2018 at 01:00 PM
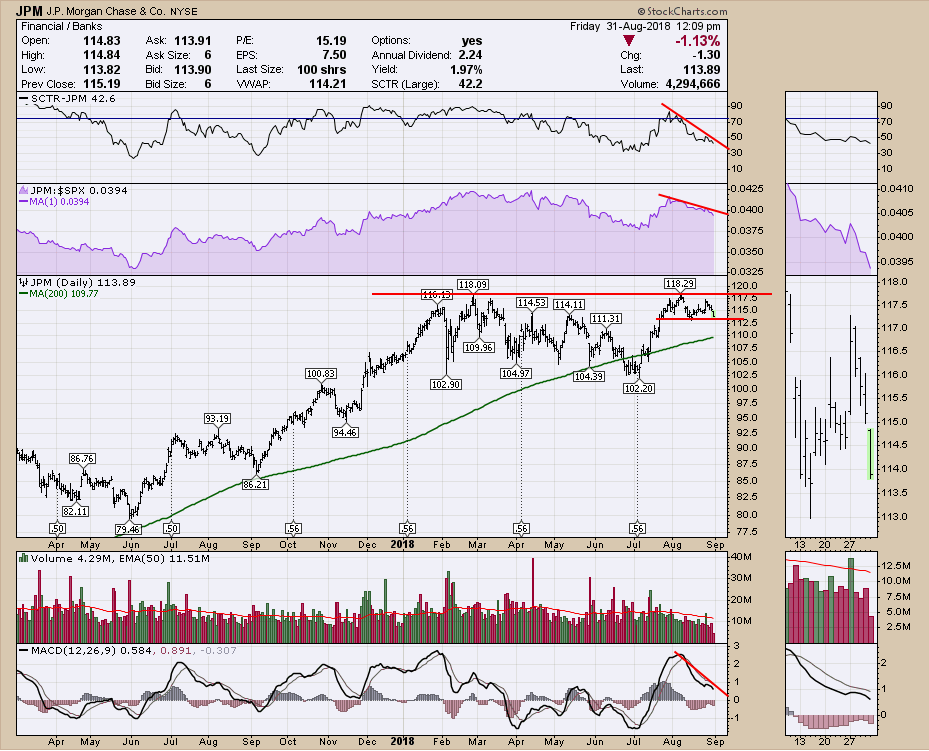
The big banks have been wandering sideways lately. JP Morgan (JPM) spent the month trying to push to new highs. Today's price action looks a little tepid to close out the month. To review the indicators, there is a downtrend in relative strength in the shaded area... Read More
Don't Ignore This Chart! August 29, 2018 at 05:45 AM

Chips are leading the market again as the broad-based Semiconductor SPDR (XSD) broke out of a triangle consolidation and hit a new high. A new high in this cyclical group is positive for the technology sector, the Nasdaq and the broader market... Read More
Don't Ignore This Chart! August 28, 2018 at 12:47 PM
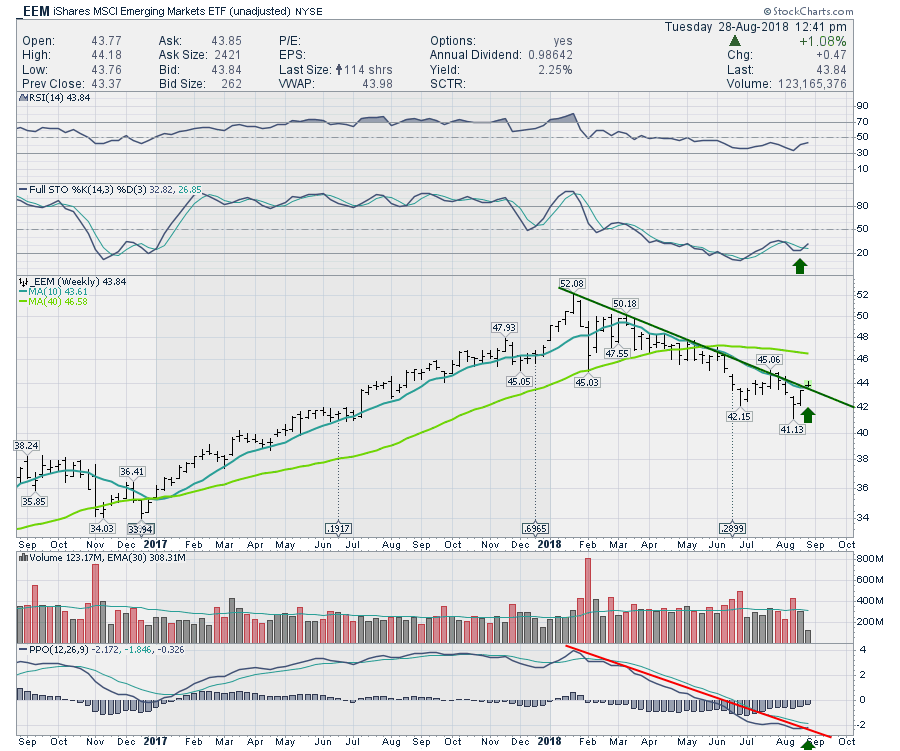
The emerging markets have been falling as the US Dollar was rising. With the sudden reversal on the $USD there are some charts shaping up nicely. The EEM chart has nice positive divergence on the Full Stochastic... Read More
Don't Ignore This Chart! August 27, 2018 at 11:58 AM

The unadjusted 20+ YR T-Bond ETF (_TLT) surged to resistance on Friday and backed off on Monday. The long-term trend is down and this resistance level could mark a near term top... Read More
Don't Ignore This Chart! August 27, 2018 at 02:07 AM
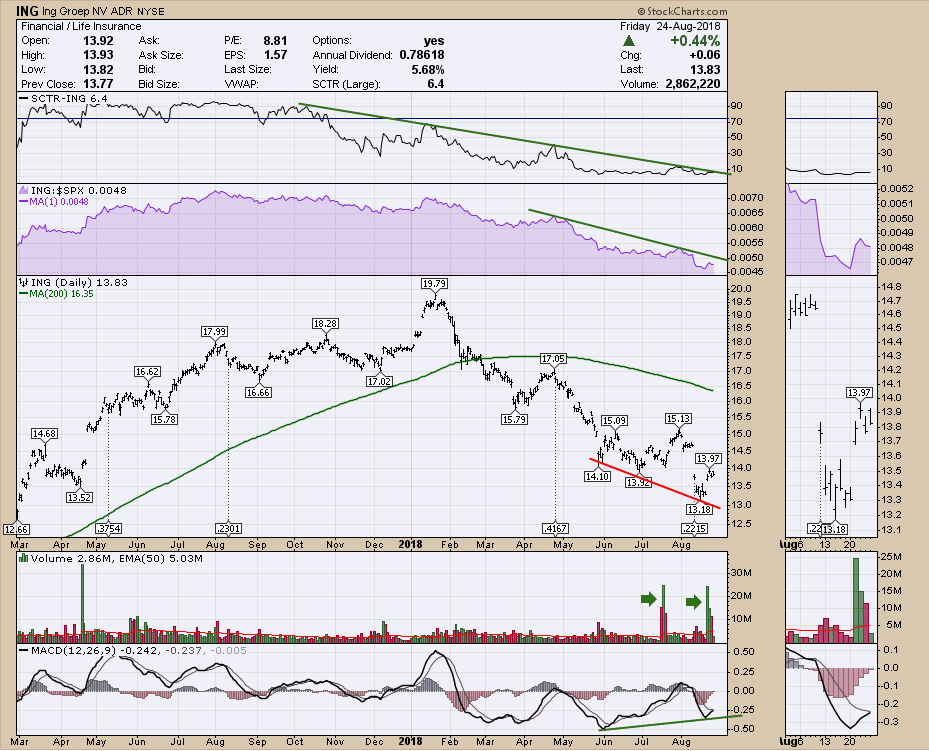
ING Bank has seen some large volume surges in the last two months suggesting the potential for some capitulation low. On the MACD we can see a positive divergence in momentum. The relative strength is obviously very weak as is the SCTR ranking... Read More
Don't Ignore This Chart! August 24, 2018 at 12:10 AM
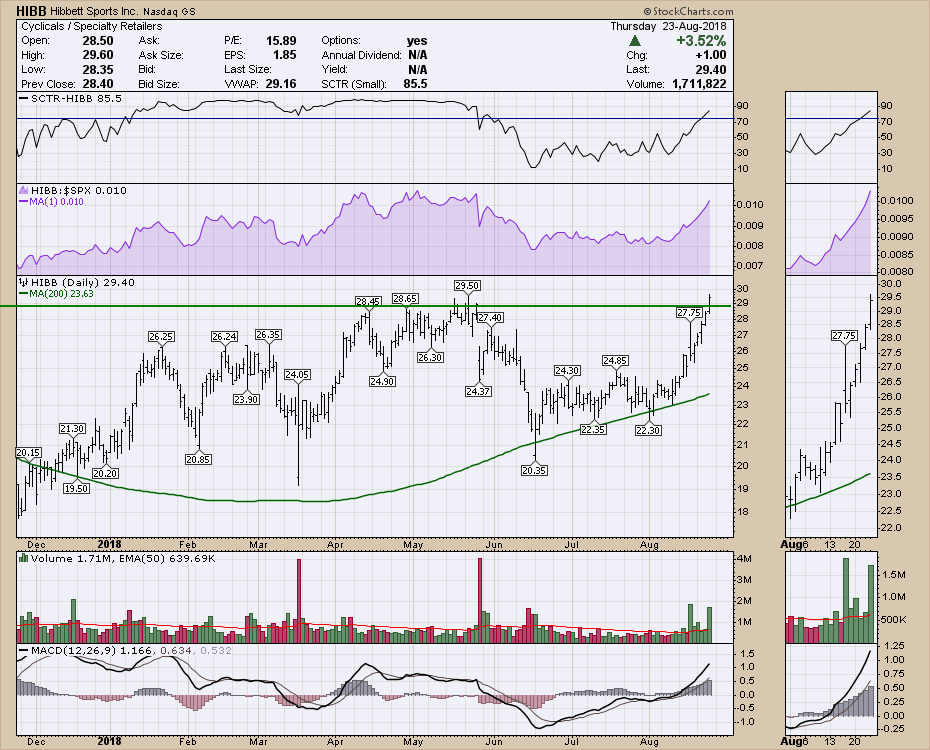
This little sporting company, Hibbett Sports (HIBB) sports an average of 600,000 shares a day. It has struggled in a wide range between $22 - $29 for a good six months. Today it forged a new intraday high and a new closing high. This run up has been sharp... Read More
Don't Ignore This Chart! August 22, 2018 at 11:45 AM

The Semiconductor iShares (SOXX) has been locked in a trading range the last few months, but the big trend is still up and a recent candlestick reversal could signal the start of an extended advance. It is important to keep perspective, even when looking at a short-term pattern... Read More
Don't Ignore This Chart! August 21, 2018 at 03:40 PM
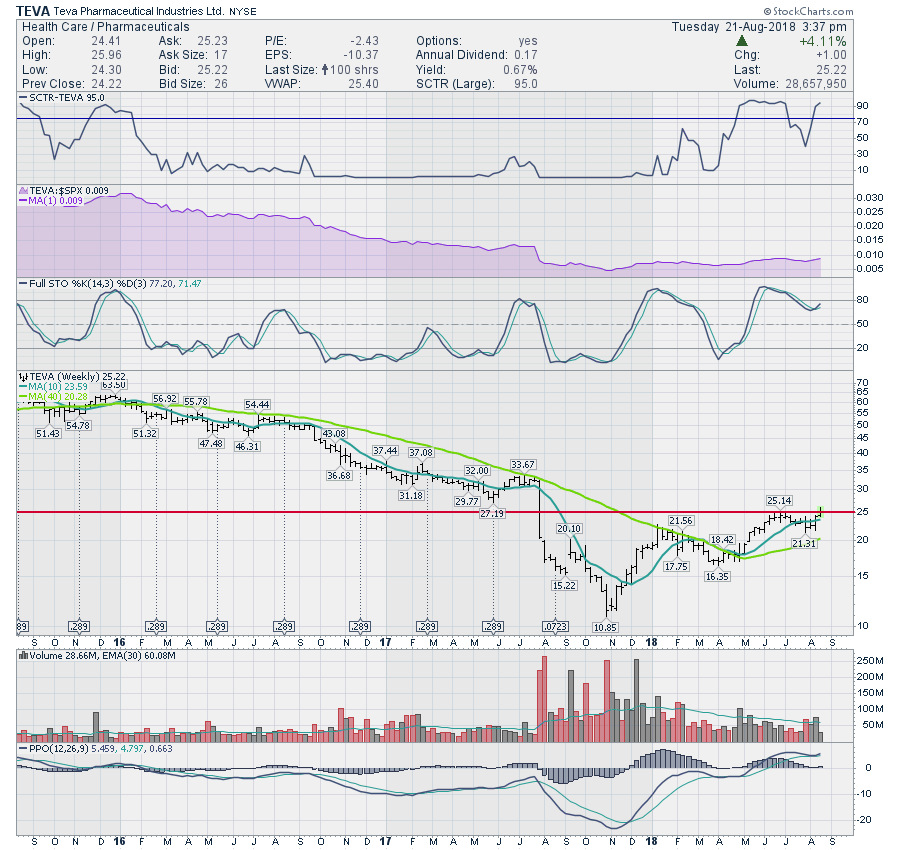
Teva Pharmaceuticals (TEVA) pushed to new highs and looks good to correlate with Arthur Hills article yesterday of Healthcare leading. Lots of nice things on this chart but the breakout is the best signal. I wouldn't let it breach the 10-week moving average on the downside... Read More
Don't Ignore This Chart! August 20, 2018 at 12:24 AM

The Health Care SPDR (XLV) moved into the sector lead with a 52-week high this week. As far as the charts are concern, the Real Estate SPDR (XLRE) and XLV are the only two sector SPDRs hitting fresh highs... Read More
Don't Ignore This Chart! August 17, 2018 at 11:08 AM
I am in Ketchican, Alaska this morning. The sunrise is a glow as the sky is low, light rain is falling and a morning fog has enveloped the town. This town is charming and is known for it's salmon fishing which brings an abundance of revenue when the salmon are here... Read More
Don't Ignore This Chart! August 16, 2018 at 02:41 PM
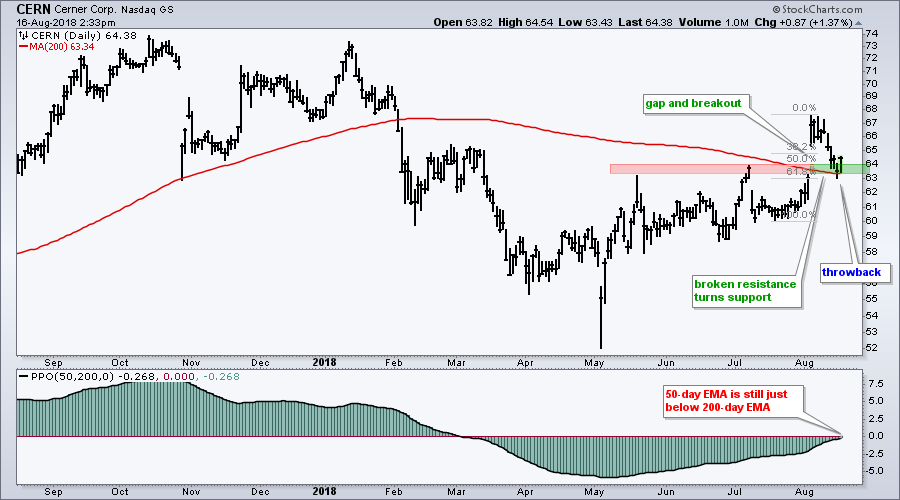
Cerner (CERN) remains in a long-term downtrend, but the stock broke a resistance level and pulled back to this breakout zone, which now turns into support. This is called a throwback and it could offer a second chance to partake in the breakout... Read More
Don't Ignore This Chart! August 14, 2018 at 05:49 PM
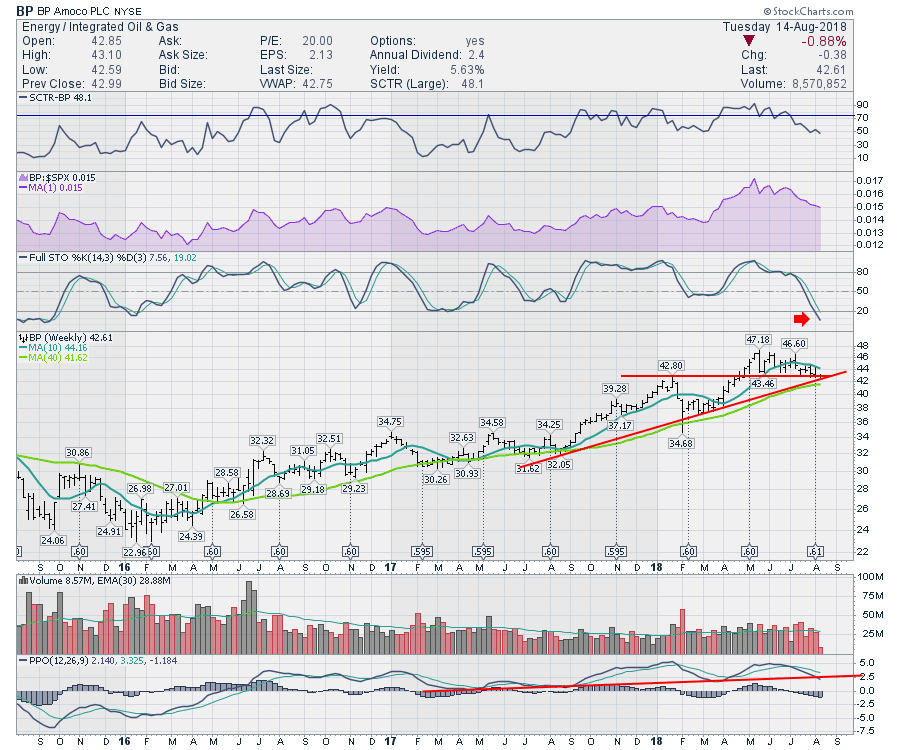
BP has been moving nicely to the upside for the last few years. This week the stock has touched an important level of support. The real question is what happens now? First of all, all our indicators are pointed sown so we don't need to rush in to buy this dip... Read More
Don't Ignore This Chart! August 12, 2018 at 10:46 AM

Anadarko Petroleum (APC) has had quite a good year with a 25% gain in 2018 and 52-week highs in June and July. The stock fell over the last five weeks, but this decline is viewed as a correction within a bigger uptrend... Read More
Don't Ignore This Chart! August 09, 2018 at 08:00 PM
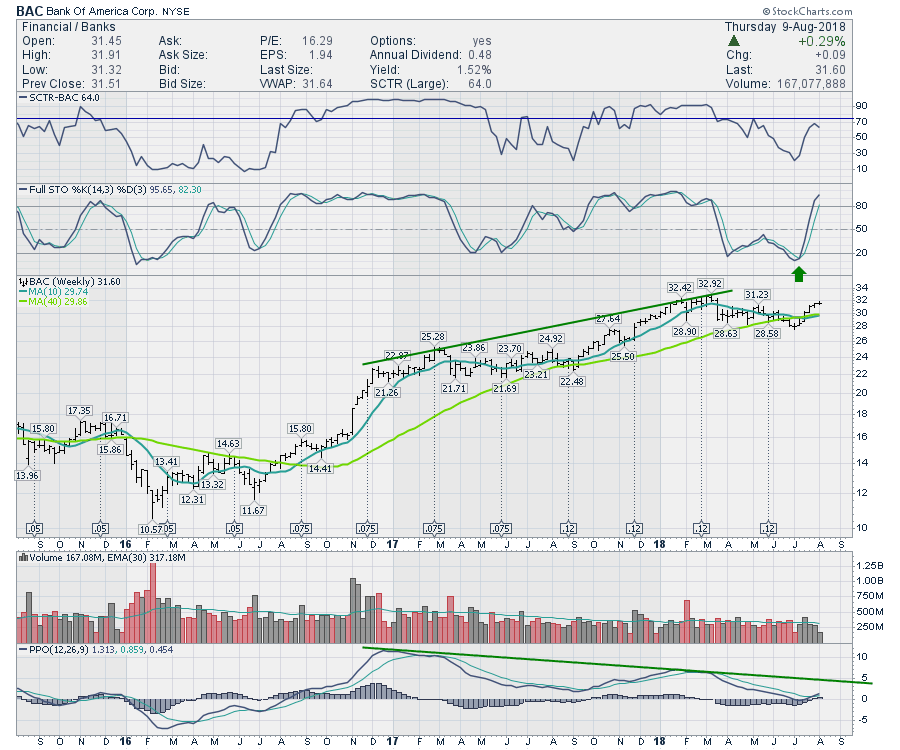
Bank of America (BAC) is approaching the highs hit back in March. This is technically an important setup for the stock. In the big picture, the March 2018 high had a lot less momentum than the March 2017 high as shown by the PPO indicator... Read More
Don't Ignore This Chart! August 07, 2018 at 09:04 AM
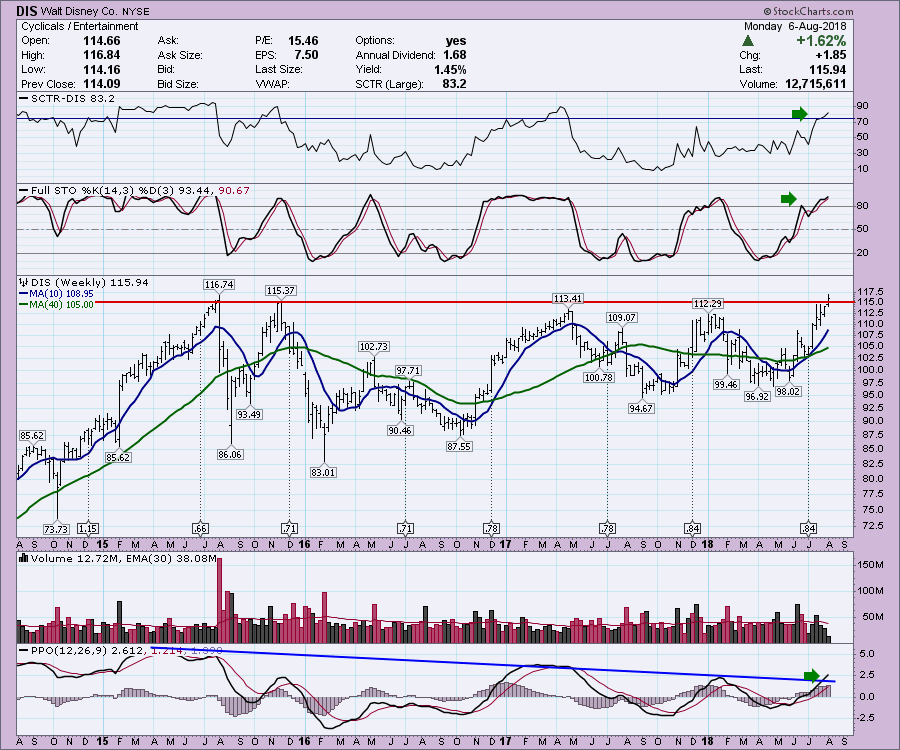
With all the attention late last year on Disney with the ESPN subscription levels, the cast at Disney announced they were launching their own 'over the top' service. In July, Disney secured the buying of 21st Century Fox for $71 Billion... Read More
Don't Ignore This Chart! August 06, 2018 at 03:04 AM

Gilead is in the midst of its fourth Bollinger Band squeeze in the past year. The last four instances foreshadowed pretty strong moves so I will be watching the current squeeze closely for the next directional clue... Read More
Don't Ignore This Chart! August 03, 2018 at 09:15 AM

JB Hunt is one of America's largest fleets. Amassing a fleet of over 12,000 trucks and 100,000 trailers, it's clear that JBHT has a pulse across North America's industries. With 124,000 employees, this industry is people intensive and flourishes when the economy is accelerating... Read More
Don't Ignore This Chart! August 01, 2018 at 06:53 AM

Waters Corp led the market in 2017 with a 65 percent gain, but lagged in 2018 as the stock corrected the last six months. I am watching this correction pattern for a breakout that would signal a continuation of the bigger uptrend... Read More
Don't Ignore This Chart! August 01, 2018 at 12:35 AM
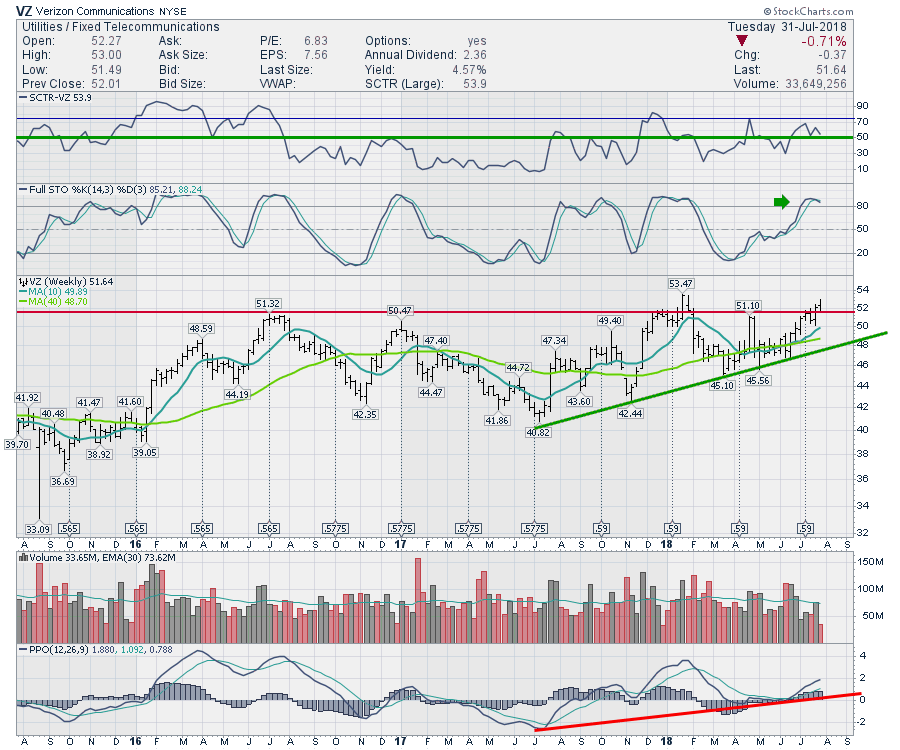
Lately the telecoms have performed pretty well. As Verizon has new highs in site, its important to check what needs to happen. Verizon (VZ) has had an important resistance layer at $51.50 which has frustrated shareholders for a couple of years... Read More