Hello Fellow ChartWatchers!
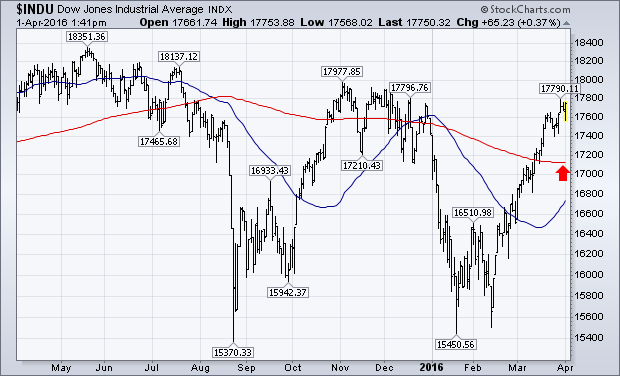
The markets continue to power higher with the S&P 500, Nasdaq and Wilshire 5000 all joining the Dow Jones Industrials in the "Above the 200-Day Moving Average" club. The Dow is now challenging its big overhead resistance area around 17,750. Last November, it faltered just below 18,000. Will history repeat itself? Check out last Saturday's webinar for more details on where things might be headed (and please join me for next Saturday's webinar too!).
Today's Big Announcement:
ChartCon 2016 is Coming in September and it will be "Virtual"
Today, I am thrilled to announce that we will be holding another ChartCon this year and that, unlike previous ChartCons, you don't need to spend lots of time and money to attend since we will be broadcasting this one over the Internet straight to your computer!
While the previous ChartCons have been wonderful events, attendence has been limited due to the cost of travel and the time commitment needed to fly to the conference. Ever since the last ChartCon in 2014, we have been working on finding ways to allow more people to participate and now, thanks to improvements in event streaming technologies, we are now able to hold a virtual conference that is every bit as good as our previous ones (at a much lower cost to you too!).
Because this is ChartCon, you'll be able to see live presentations from all of our regular commentators including John Murphy, Martin Pring, Arthur Hill, Tom Bowley, Greg Schell, Erin Heim, Bruce Fraser, Gatis Roze, Greg Morris, Grayson Roze and myself. And because this is ChartCon, you'll be able to interact with the presenters (albeit via your computer) during exclusive live Q&A sessions immediately after their presentations.
The theme of this year's event is "Putting It All Together: Creating Technical Trading Systems that Work for You"
Many of the presentations will be focused on different ways to use charts and technical analysis to find stocks with great potential, purchase them at the right price, manage your open positions, and sell them when the time is right. My goal is to have everyone who attends ChartCon 2016, come away inspired to incorporate technical analysis into every aspect of their investing. Check out some of the presentations we are currently working on for you:
- Arthur Hill: "Creating and Running a Momentum Strategy"
- Gatis Roze: "25 Years, 25 Essential Lessons for Achieving Stock Market Mastery"
- Greg Morris: "Questionable Practices and Why Technical Analysis Works"
- Greg Schnell: "Why SCTRs May Be the Last Indicator You Ever Need"
- Tom Bowley: "Learning from the Past: How History Impacts Investing"
- Grayson Roze: "How Cognative Biases are Sabotaging Your Investion Every Day"
- Erin Heim: "Using DecisionPoint's Timing Signals to Improve your Portfolio"
- Chip Anderson: "How to Hold a Really Interesting Two-Day Conference via the Internet"
- and much, much more.
OK, OK - you caught me - I'm still coming up with a title for my talk as are the remaining presenters, but rest assured they will all be awesome. Grayson and I will also serve as your Masters of Ceremony.
The planning for this event has been underway for quite some time. It is actually very similar to the planning that goes into a live television show. We will have live presentations, screencasts, interactive interviews, behind-the-scenes segments, "commercials", roving reporters, web polls, Twitter feeds, chat rooms and anything else we can come up with to keep things interesting, educational and interactive.
Here are the key things you need to know:
- Dates: Friday, September 23th and Saturday, September 24th
- Cost: $199.95 per person - no travel, no hotel, no restaurants, no additional fees whatsoever!
- Technology Needed: Any Internet connected computer with a web browser. If you can watch YouTube videos, you'll be able to watch the ChartCon live stream. A limited version of the live conference will also be available via mobile devices.
- Presenters: See the list above
- What's Included: Access to the live broadcast and conference website. Access to conference recordings and documents. A ChartCon "achievement" for your StockCharts account. Exclusive access to live presenter Q&A sessions and much, much more.
Here are some frequently asked questions about ChartCon 2016:
- Q: Can I just order a video recording of the conference?
A: The video recording of the conference will be available for sale 6 months after the conference. (Conference attendees will get the recordings much sooner.)
- Q: What is the refund policy?
A: Full refunds are available up until the day of the conference.
- Q: Is there a limit to the number of people who can attend?
A: Yes! Please don't wait until the last second to sign up - we may be out of room!
- Q: Are there any special pricing for "early birds"?
A: No. We've priced this conference very low from the outset.
- Q: Can I attend ChartCon 2016 in person?
A: In general, no. We are considering making a very small number of seats available for purchase via auction. Please let me know if you are interested.
We would really love to see you in September at ChartCon 2016. If you are interested in participating, please click on the link below and send us your email address. Next week, we will send you specific details for registering.
Send me information on registering for ChartCon 2016
See you there! (well... sort of)
- Chip
SITE NEWS
RECENT ADDITIONS TO STOCKCHARTS.COM
- CHARTCON 2016 - SEPTEMBER - MAKE PLANS NOW! - See Chip's article above for details.
- CHIP ANDERSON AND MARTHA STOKES - TECHNITRADER WEBINAR ON APRIL 13th - Chip Anderson will team up with TechniTrader's Martha Stokes for a one-of-a-kind FREE webinar on Wednesday, April 13th. As you may know, Martha is one of the most popular contributors to our "Top Advisors Corner" blog and an expert on how Wall Street really works. Click here to register.
- WEBSITE UPGRADES CONTINUE - We've rolled out several new versions of our pages recently including our new Webinars page, the SharpCharts Voyeur page and our Educational Videos pages.
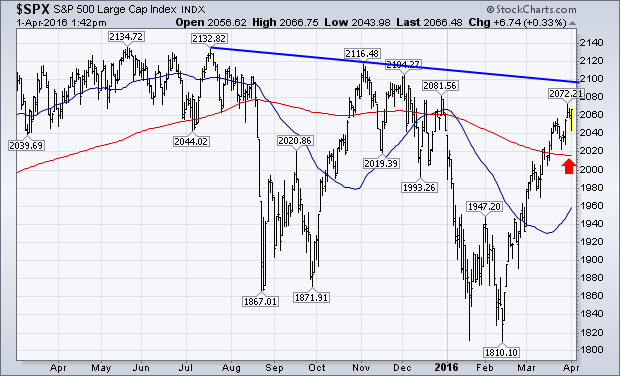
The chart below shows the Dow Industrials moving closer to a test of its fourth quarter highs near 18000. Given the steepness of the recent rally, it might run into some resistance there. But its trend is still higher. The second chart shows the S&P 500 moving closer to a resistance line drawn over its May/November highs. It may meet some resistance there as well. But it's trend is also higher. Earlier in the week, I showed the NYSE Advance-Decline line testing its 2015 high. I also suggested that a major drop in stock prices was highly unlikely with market breadth figures in such a strong position. That doesn't rule out a market pullback from overhead resistance. But any pullback should be viewed as part of a larger uptrend. Moving average support for the large cap indexes is likely near their 200-day averages.
- John
Art's Charts
Arthur Hill is on hiatus this time. Please visit Art's Charts for more articles by Arthur Hill.
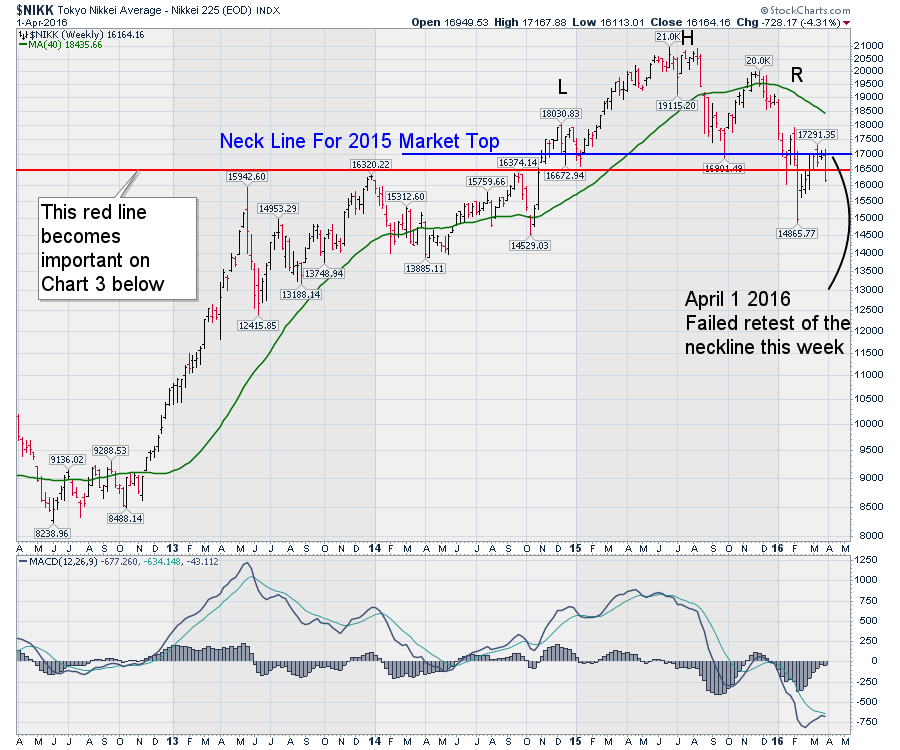
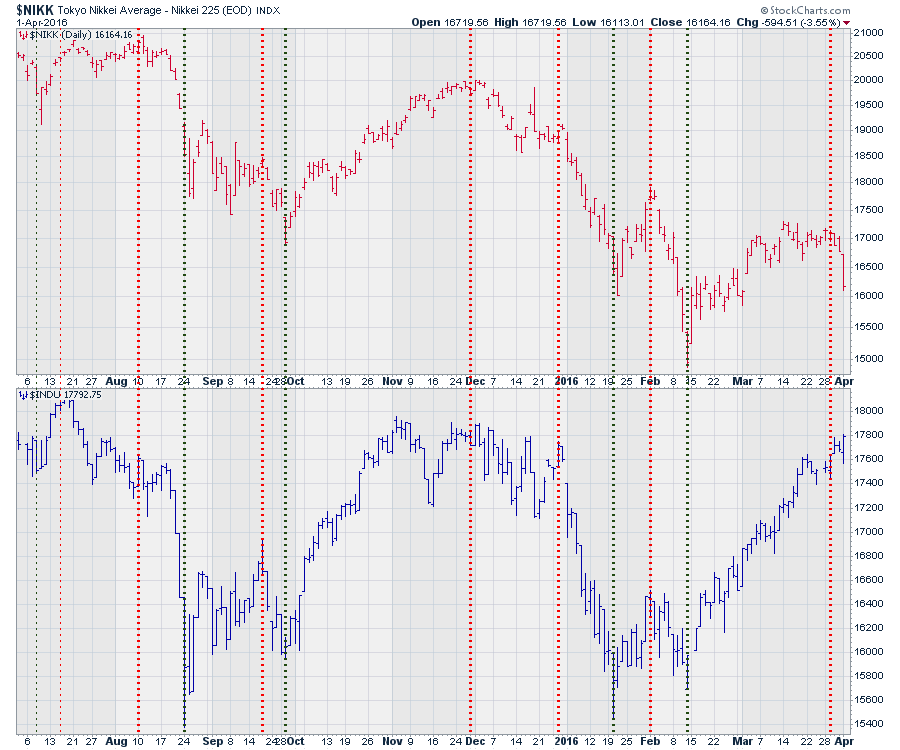
If the Dow fell 900 points in two days, would that get our attention? This article will explain the linkage for North American investors and why I say it so succinctly.
The continued case for watching price action rather than Monetary Policy has resumed in Europe and Japan. Recently, one of the institutional money managers on television chimed in that Europe and Japan were the best places to invest because of the stimulative backdrop from their Central Banks. While those words of wisdom sound eloquent, let's look at the facts according to the market response to policy actions. Europe is making 4-week lows trapped under the 40 WMA but that is another story. I'll focus this on Japan for today. Please see my blogs (links provided below) and webinars for more regular updates on these global macro issues.
The Japanese Nikkei ($NIKK) stock market appears to be breaking down. From before and after the NIRP - Negative Interest Rate Policy - the Japanese investors are breaking their conviction that this works out.
- The $NIKK made it's high in August 2015.
- Falling from 20914 to 17714, 15% in 2 weeks, it stopped near previous support at 17000 (16901).
- The Nikkei traded up to 20000, but the market stalled for three weeks there in November 2015.
- The Nikkei lost 15% again in 3 weeks from the end of December 2015 to the January 2016 low.
- The low around 16000 during the third week of January 2016 started a two-week bounce.
- After approaching 18000, the market plummeted to 14865 which is a 17% drop in just 2 weeks.
- In concert with the rest of the world bouncing off the February low, a rally moved up to 17291.
- We can see a stall in the price action for 5 weeks around 17000 at the neckline which is bad.
- The $NIKK stock index lost 900 points or more than 5% between Thursday and Friday.
- The real question is why should a North American investor be concerned?
The Dow Jones Industrial Average ($INDU) trades around 17800 which is similar to the $NIKK at 17000 on Wednesday. If the $INDU loses 900 points in the next two days, would that make the news? Why do I say it like that? The two major drops in the last year in the USA (August 11,2015, December 30, 2015) coincide with major 15% drops in Japan. The big drop from February 1 in the USA of 7% coincides with the 17% drop in Japan. So if huge volatility shows up next week, will we be surprised or aware? Note the scale on the right. This $NIKK scale is moving by 500 points(!) per grid line. The scale is actually more than double the range (6000 points vs 3000 points) of the $INDU below which has a 200 point grid.
 Technically, where Japan is breaking down on the weekly charts and failing at the neckline is cause for serious concern. I have highlighted the RSI Bull and Bear markets. Currently, the RSI indicators point to a bear market. The MACD is in negative territory which is also confirming the bear market. But the red line in the chart can only be cause for concern. The Japanese economy has been deflating for 25 years and investors there sell quickly and ask questions later. Looking at this red horizontal line around 16500 we can see that the Japanese investors have aggressively sold stock after going below and above this level. If this support level fails to support their market, this definitely looks like the stage is set for an aggressive bear market. Moving through it with a 900 point plunge in two days suggests the selling is beginning in earnest. I think we can trade Japan on the short side against this level.
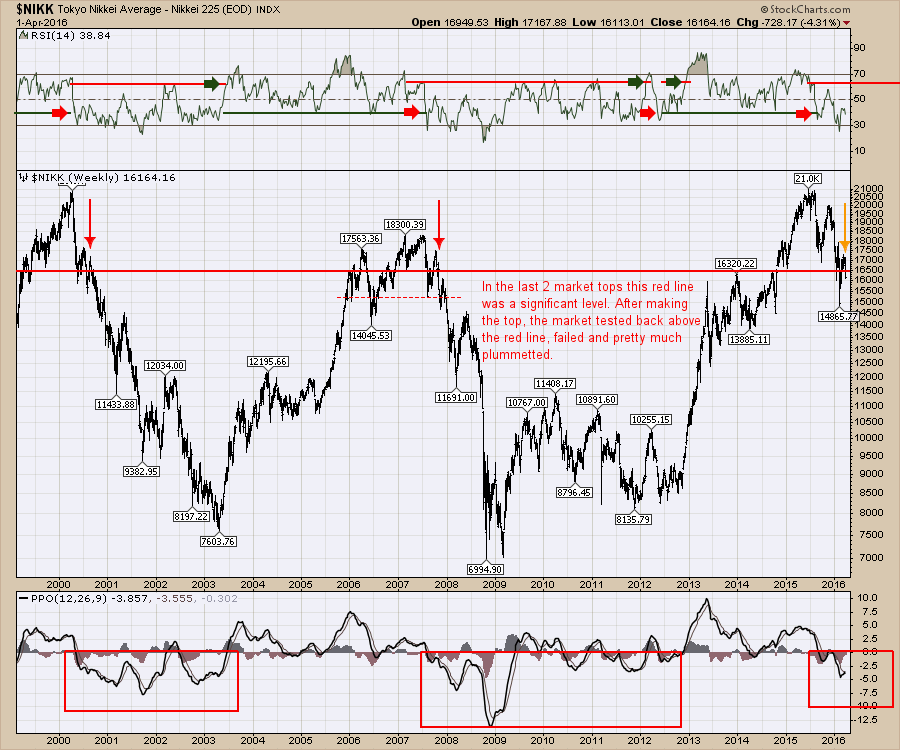 There is no denying the US market is in better shape than other world markets. However, based on the similar dates shown in Chart 2 and similarities of global bear markets, this $NIKK breakdown looks ominous in the world's third-largest economy. Japan also ranks first for Debt-to-GDP which is not an honourable trait and could be one of the reasons this is starting to plummet. Back to the title of the article. Is the world pricing in the failure of Abenomics? It looks to me like the Japanese are.
Just when you thought things were about to stabilize, we get some very bearish price action internationally that could start another round of selling in America. You'll be reminded of 'Jim Cramer' saying how he hates to wake up early and check on the Asian markets to decide what is going to happen in America. The Dow does not have to fall as fast as Japan, but we should all be aware of the precarious nature of the global scene.
But the next question is: Will it send the rest of the world tumbling? I will do an around-the-world tour and spend some time on Tuesday, during my Canadian Technician Webinar. When the talking heads on television start to recommend global markets, you'll be up to speed on the price action and a global context. You can register (for free) by following this link. The Canadian Technician 20160405.
You can also track my blog articles by clicking yes on the subscription question on each one. Click here to see my latest Canadian Technician article and click here to see my latest Commodities Countdown article.
Good trading,
Greg Schnell, CMT
The preliminary S&P 500 Index 2015 fourth quarter earnings results are in, and it is once again time to look at our earnings chart, which shows the S&P 500 in relation to its normal value range. (Note: The chart is a static graphic, not an active chart.)
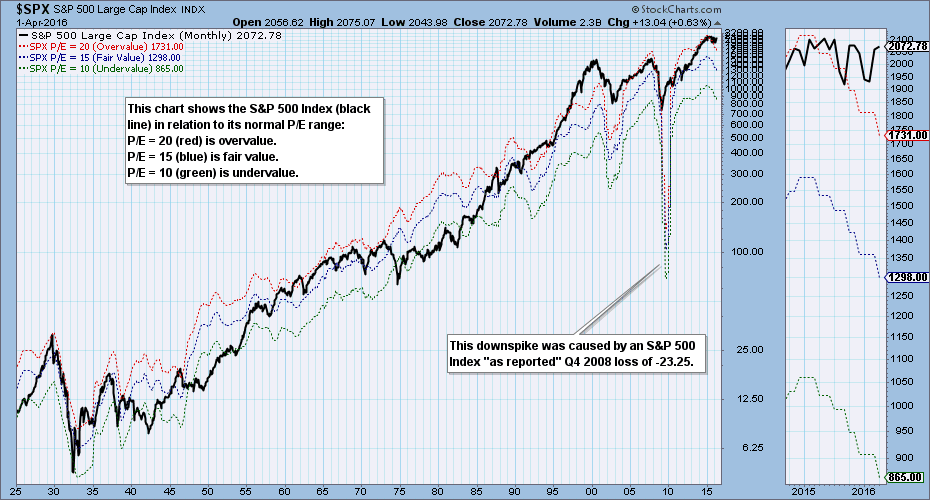
The bands on this chart show where the S&P 500 would be if it had an undervalued P/E of 10 (green), a fair valued P/E of 15 (blue), or an overvalued P/E of 20 (red). While the bands don't rigidly contain the range of the Index, they do help us get a quick assessment of the current valuation along with some historical perspective. The current P/E is 24, which places the Index well above the normal overvalue level of 20. Last quarter the P/E was 23, so the situation is getting worse. To clarify, the S&P 500 is at 2073, which is 17% higher than the overvalue level of 1731.
As a general rule a P/E range of 10 to 20 should be considered normal, particularly for a broad market index like the S&P 500. (The percentage of earnings for a 20 P/E is 5%; for a P/E of 10 it is 10%.) When those limits are exceeded, it is a good idea to find out why. In the case of the S&P 500, earnings have been trending down since the beginning of 2015, which is a more serious than rising prices just getting ahead of rising earnings.
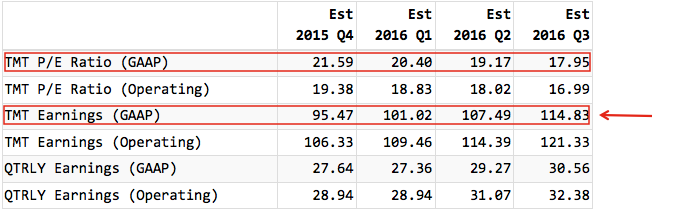
In the table below twelve month trailing (TMT) earnings are projected to increase over the next four quarters, which in turn will cause the P/E to drop (if the index value stays the same); however, we cannot be sure that estimates will be realized. The second table shows what the estimates were three months ago. Note how much they have dropped since then.
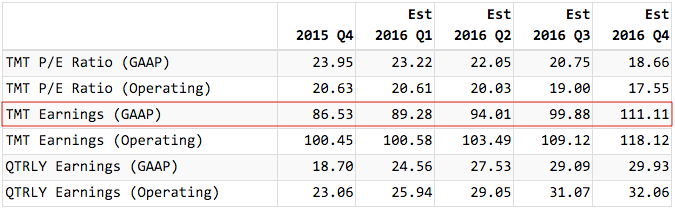
 Source: standardandpoors.com
CONCLUSION: With the S&P 500 Index being higher than its normal P/E range, and with earnings trending down, the fundamentals are working to pull prices downward. Earnings are projected to improve over the next twelve months, but what are those estimates worth? The previous quarter's estimates proved to be pie in the sky. For now, what we do know is that the S&P 500 is overvalued and earnings continue to trend downward. That has negative implications for future stock prices.
Technical analysis is a windsock, not a crystal ball.
Trading Places
Tom Bowley is on hiatus this time. Please visit Trading Places for more articles by Tom Bowley.
Personally, I think this is some kind of April Fool's joke... - Ed.
The first quarter has come and gone and now we are about to embark upon another earnings season that will officially kick off when Alcoa reports its numbers after the bell on Monday, April 11. Alcoa rarely sets the tone for earnings season but when they do report it's a signal that thousands of companies will be sharing their financial results over the span of a few week's time.
Almost anyone you ask will tell you that earnings expectations have been lowered for the first quarter and this is one of the reasons the market has had trouble gaining traction. But along with lowered expectations comes possibilities that some companies will defy the odds and post better than expected numbers. We could also see the opposite; missing expectations. In both cases it presents opportunities to profit either on the long or short side, especially if you show patience.
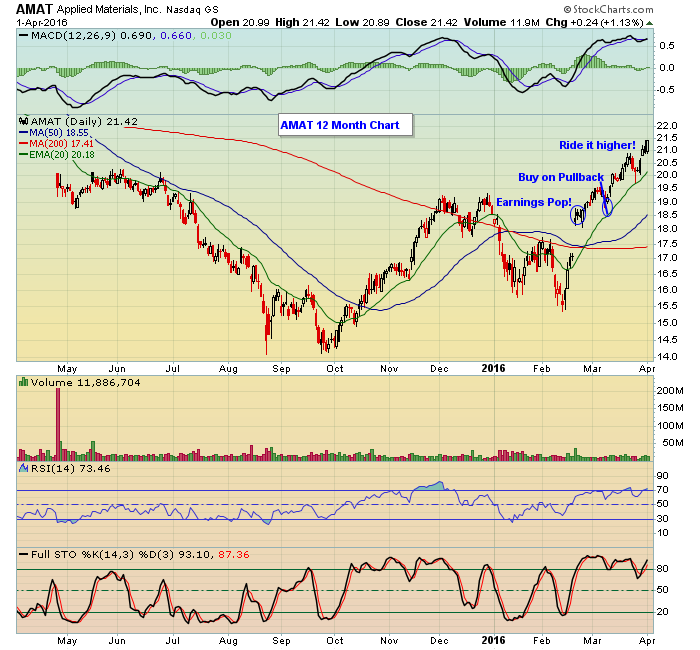
As an example and shown below, Applied Materials reported its numbers in late February and gapped up when it beat both earnings and revenue expectations. Unless you were holding the stock into its earnings reports you would have missed the nice spike higher. It remained strong for two weeks then finally it pulled back in early March, easily holding above all key technical levels, and allowing those who were patient to get involved in the stock. Since then it has continued to move higher as it tries to challenge the highs from a year ago.
We see this time and again when we scan for those stocks that beat/miss expectations; a gap higher/lower followed by positive/negative action for a few weeks time. Then an opportunity to get involved once things have settled down.
I am going to conduct a FREE webinar on Wednesday, April 6 at 4:30 PM eastern. During this webinar I will be discussing our process of identifying companies that beat or miss earnings expectations and showing some examples of how they performed once their numbers were released. If you wish to join me just click here to register.
- John

To paraphrase Bill Murray from the movie "Aloha," the future is not something that just happens. It's a brutal force with a great sense of humor that will nickel and dime your investments until it's totally steamrolled your portfolio if you aren't watching. I will concede that it's a personal rant of sorts, as I have been on the receiving end of excessive charges and fees. As a
Read More


 Source: standardandpoors.com
 To paraphrase Bill Murray from the movie "Aloha," the future is not something that just happens. It's a brutal force with a great sense of humor that will nickel and dime your investments until it's totally steamrolled your portfolio if you aren't watching. I will concede that it's a personal rant of sorts, as I have been on the receiving end of excessive charges and fees. As a