Hello Fellow ChartWatchers!
The markets continue to move sideways with declining volume - both in the long-term view and in the short-term view. Since April, the Dow has been content to drift aimlessly between 17,500 and 18,000. Similarly, the S&P 500 is vacillating between roughly 2050 and 2100. Weekly volume for both indexes declined significantly over the month of May. As I mentioned in last week's webinar, this is not a good environment for trend-followers and you need to be wary of signals from trend-based approaches right now.
For more on the markets and where they might be headed, please check out the other ChartWatchers articles in this newsletter.
Summary of Recent Scanning Webinars
In case you missed it, during the past three ChartWatcher webinars, we've focused in on Technical Scanning - an important feature of our website that is available to Extra and PRO members. Here are the key points I tried to make during those three shows:
- Scanning is super-important to technical traders. Traders that can create 2 or 3 scans that work well for them are miles ahead of everyone else.
- Scanning is about finding stocks that you might actually buy. Lots of people get into trouble trying to use scanning for stuff it was not intended to do.
- Scanning works best when you use technical "signals." A signal is when something crosses something else on the chart.
- Creating scans is an iterative process that requires thought and energy on your part. Ultimately, that is because you have to build trust in your scan - enough trust that you become willing to buy a stock based on your scan.
- Advanced Scans are just as easy to learn as Standard Scans and Advanced Scans are more powerful/flexible. Therefore, we recommend everyone use Advanced Scans even if you are just starting out.
- Advanced Scan Syntax can be tricky but it can be conquered. The best way to learn is by studying other scans. The Advanced Scan Library has tons of examples to study.
- Create specific scans that find stocks that have one or more technical signals happening "today." Avoid creating vague scans that have technical signals happening "within" a range of days.
- Use the "x" ("crosses above") comparison operator to specify technical signals in your scan. "RSI(14) x 50" means "Yesterday RSI(14) was below 50 and today RSI(14) is above 50".
- To scan for a "crosses below" situation, write it first as a "crosses above" scan and then simply reverse the expressions on either side of the "x". For example "50 x RSI(14)"
- Use square brackets to surround each clause. Only use parentheses with specific parameters to functions- like "RSI(14)" for example.
- Put each clause in your scan on a separate line. You can then add "#" at the start of the line to "comment out" (i.e., "turn off") that particular clause if you need to.
- Join your clauses together with "AND". While you can also join things together with "OR", that often leads to unexpected problems. 99 times out of 100, you should be using "AND" to further narrow down your results
- If you do use "OR" in your scan, you will need to add an additional set of square brackets around the clauses you are OR'ing together.
- Use the "Scan Builder" dropdowns on the Advanced Scan Workbench to insert examples whichever technical indicator/criteria you are interested in.
- After running your scan, save the results in a ChartList and then review that ChartList in CandleGlance mode. Use the trashcan icon to delete any results you don't like.
- You can use the "Starting ____ days ago" setting at the top of your scan to "backtest" the scan and see how it performs in various market conditions.
- The good folks at the StockCharts Answer Network (s.c.a.n.) love to help out. Don't hesitate to ask questions about scanning on that independent user-to-user message board.
There was much more that we went over during the webinars but those were some of the standouts in my book. Feel free to check out the recordings for those shows by clicking here. (Skip ahead to the 45-minute mark to see just the scanning stuff.)
And don't forget to sign up for ChartCon 2016!
- Chip
SITE NEWS
RECENT ADDITIONS TO STOCKCHARTS.COM
MARTHA STOKES DEBUTS NEW BLOG ON STOCKCHARTS.COM! We are thrilled to announce that Martha Stokes CMT of TechniTrader.com will now be contributing regularly to her very own blog on StockCharts.com. Martha has been contributing articles to our "Top Advisors Corner" area and they have always been well received. Now she will have her own area and her fans can now get notified whenever she has a new post. Look for Martha's first post to appear later this week!
THE NEW HTML5 VERSION OF CHARTNOTES CONTINUES TO IMPROVE - In case you weren't aware, all of the major web browsers are planning on removing support for Adobe Flash by the end of the year due to continuing security issues. That fact has forced us to re-write our ChartNotes annotation tool using a newer, faster, more secure technology called HTML5. For those of you that hate change and wish we weren't making this change, please understand that we have no choice. It wasn't at the top of our "To-Do List" but the major browsers are forcing our hand. Please help us ensure that this new version does everything that it needs to do by testing it out and sending your suggestions for improvement. Thanks!
UPCOMING WEBINAR SCHEDULE CHANGES - If you are a fan of Arthur Hill and/or Tom Bowley you'll want to pay attention to their webinar calender. We will be making a couple of important changes to their shows soon. Starting later this month, Arthur Hill's "Art's Charts" webinar will soon only be available to active StockCharts members (just like his blog). In July, Tom Bowley will be shifting things around as well - stay tuned for those details later this month.
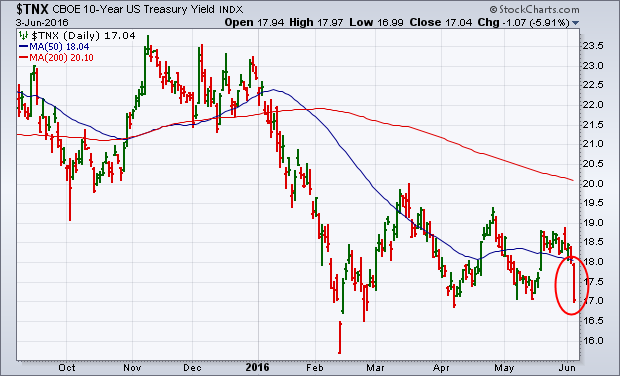
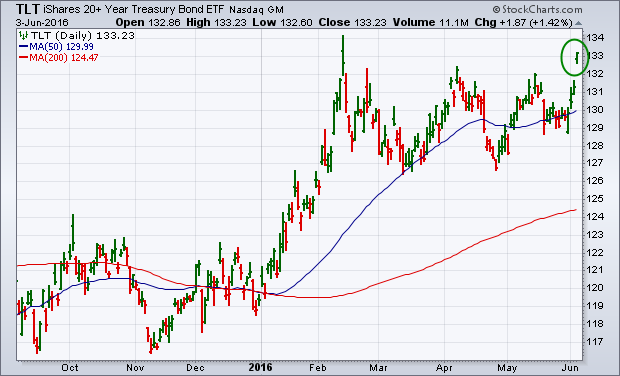
Friday's job report of only 38,000 jobs created in May was the weakest in more than five years. And it pretty much shocked everyone. Some of the market reactions, however, were reasonably predictable. Interest rate yields tumbled along the entire yield curve. Chart 1 shows the 10-Year Treasury Yield (TNX) plunging 10 basis points and closing near the lowest level since February. Naturally, that pushed bond prices sharply higher. Chart 2 shows the 20+ Year Treasury Bond iShares (TLT) surging to a four-month high. The reason for that sharp reaction was that the weak job report pretty much took a June rate hike off the table, and may have jeopardized Fed plans for a hike sometime over the summer. The two-year yield, which is most sensitive to a rate hike, fell even more than the long bond. The plunge in bond yields helped some stock groups like utilities and hurt others like banks.
 I hope you can join us for ChartCon 2016 on September 23rd & 24th. I understand it will be online this year which means anyone should be able to attend. I also understand that tickets are going fast. Click here for details.
- John
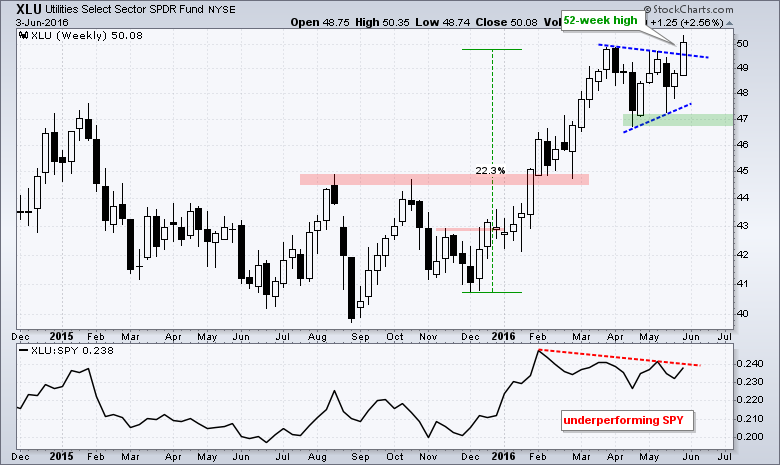
Even though the Utilities SPDR (XLU) has been underperforming SPY since February, it sports the strongest chart of the nine sector SPDRs. How can that be? XLU is the only sector to hit a 52-week high this week. The sector cannot be that weak when it is trading at a 52-week high. The weekly chart below shows XLU breaking out in January and surging over 20%. After becoming a bit overbought in March, the ETF formed a triangle consolidation in April-May and then broke out with a surge last week.
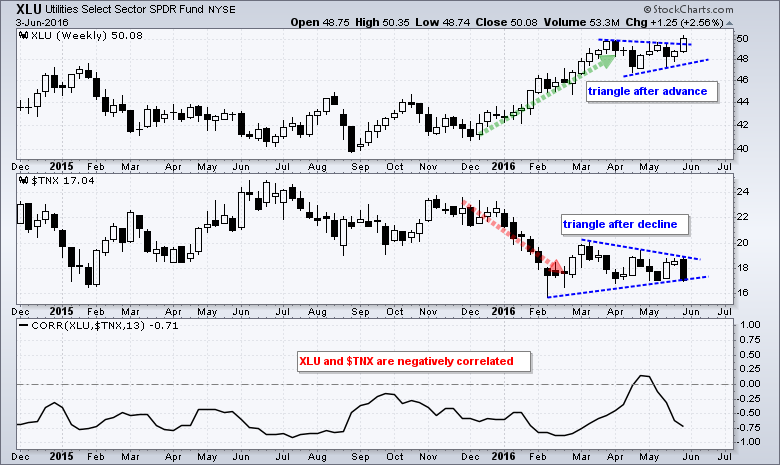
Utilities are benefitting from the plunge in the 10-YR Treasury Yield ($TNX), which was triggered by the big miss on non-farm payrolls. The indicator window shows the Correlation Coefficient (XLU, $TNX). Notice that XLU and $TNX have a strong negative correlation, which means they move in opposite directions. On the chart, the 10-yr Yield fell back below 18 (1.8%) this week as the jobs report missed expectations. Overall, $TNX formed a triangle after a sharp decline and the 10-yr yield is on the verge of breaking the lower trend line. A break would signal further weakness in the 10-yr Yield and this would be positive for XLU.
 ****************************************
Thanks for tuning in and have a good weekend!
--Arthur Hill CMT
Plan your Trade and Trade your Plan
****************************************
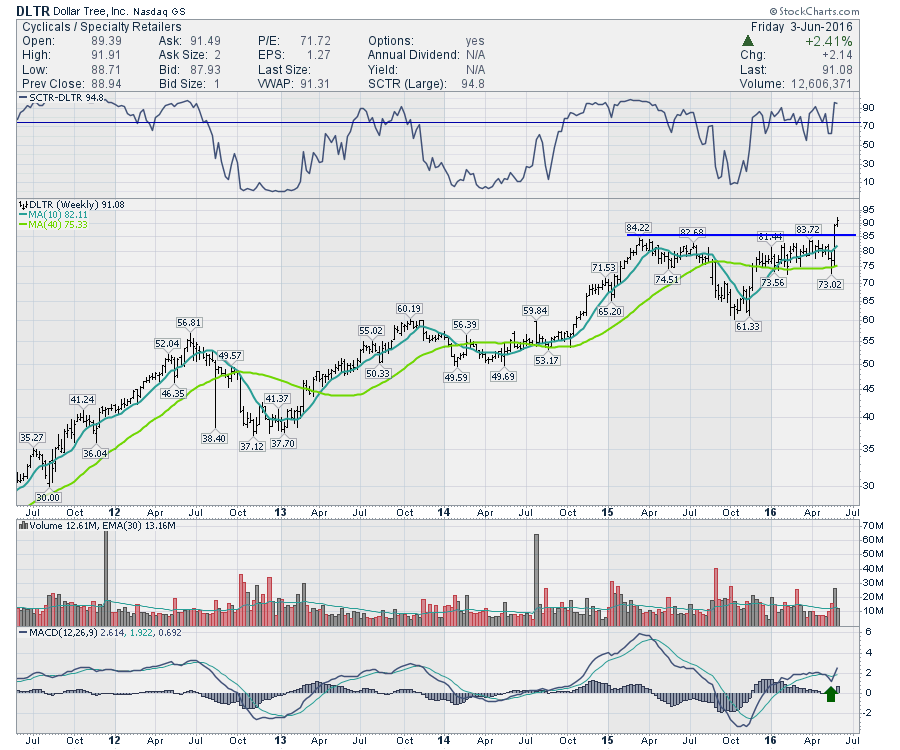
Walmart, Dollar General, and Dollar Tree are all in the top performance rankings currently. Let's look at the charts.
Starting with Dollar Tree (DLTR), We can see it just gapped to new highs after consolidating for a year, and this jump was well above the previous resistance shown with the blue line. The volume was strong on the breakout and the MACD has just turned up. Dollar Tree is in the Specialty Retailers.
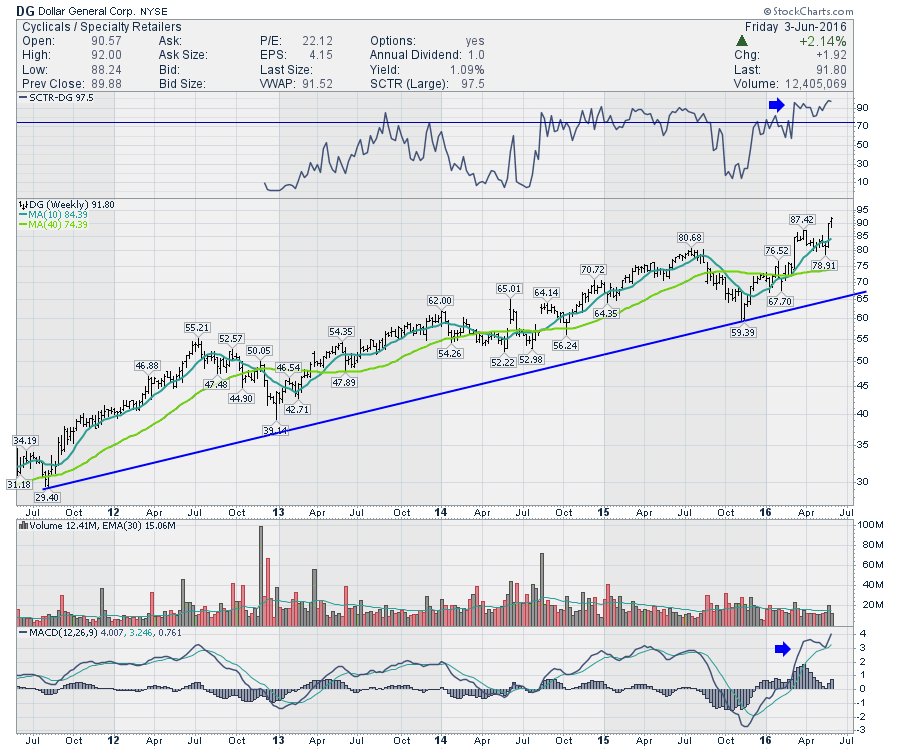
The next is Dollar General (DG). It continues to climb, quarter after quarter.
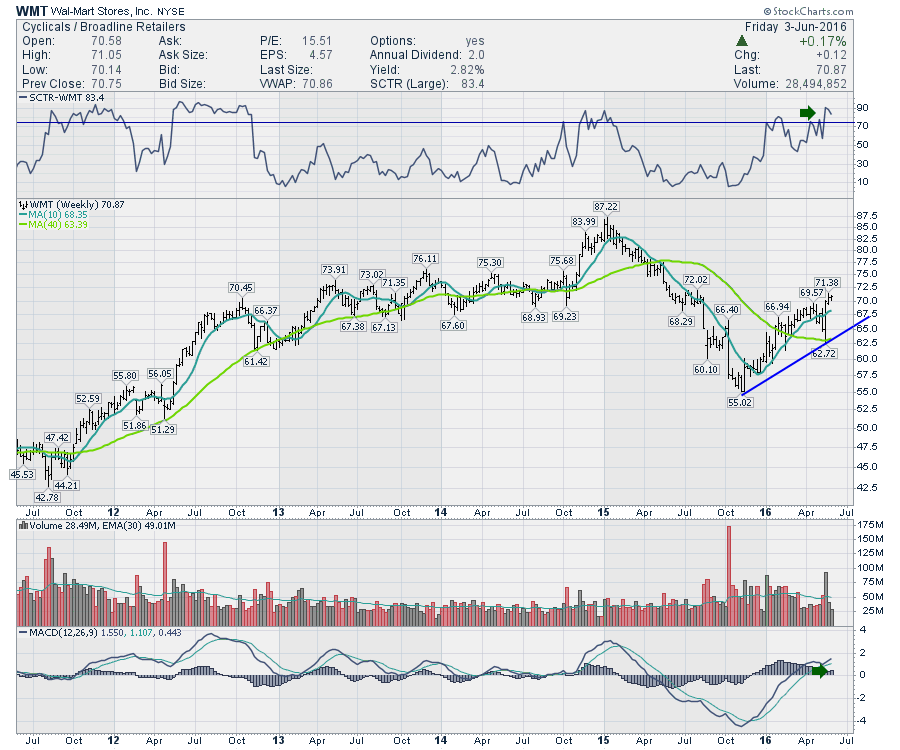
 Walmart (WMT) is another low price retailer. It continues to climb. It recently pulled back on a strategy of paying employees more and improving their online presence. The stock seems to be responding now.
 So well these discounters enjoy SCTR's above 75, premium retail stocks like Tiffany (TIF) are under pressure.
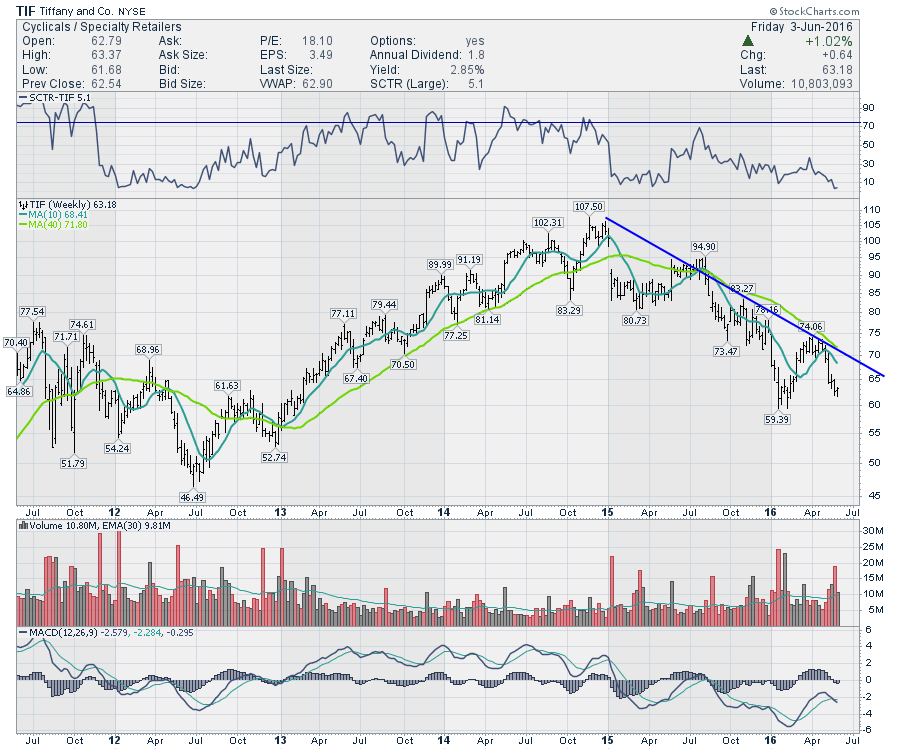 As we approach the summer, Retail stocks start to rally on hopes for the back-to-school and Christmas season. At this point, the market is only rewarding discounters, not premium retailers for the most part. If you are planning to shift into some retail stocks heading into the summer, it looks like the trend is already being established. Caution on the premium names is the story at this point.
Good trading,
Greg Schnell, CMT, MFTA
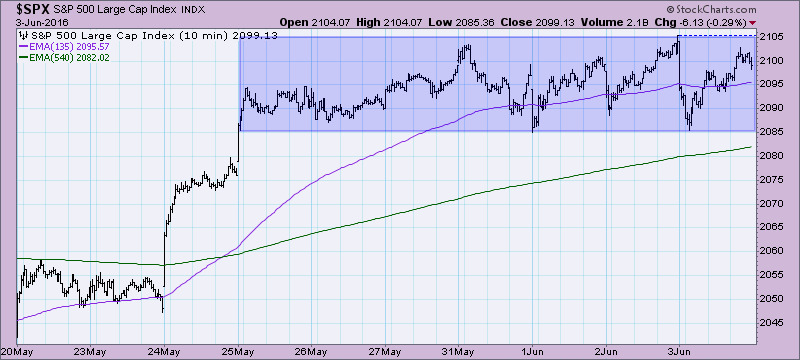
The S&P 500 hit overhead resistance at the April high and has stalled. If you look at the 10-minute bar chart for the past 10 days, you can see that price has been consolidating for over a week and has failed to overcome resistance.
As this consolidation started, our short-term indicators turned bearish. A climactic buying initiation impulse arrived on the ultra-short-term (hours to days timeframe) indicator chart. I define buying initiation impulses as high positive spikes that arrive during a decline. After that, climactic readings continued but they began to trend lower which I consider short-term bearish. Any positive climactic readings that appear would likely be buying exhaustions and any climactic negative spikes would likely be selling initiation impulses.
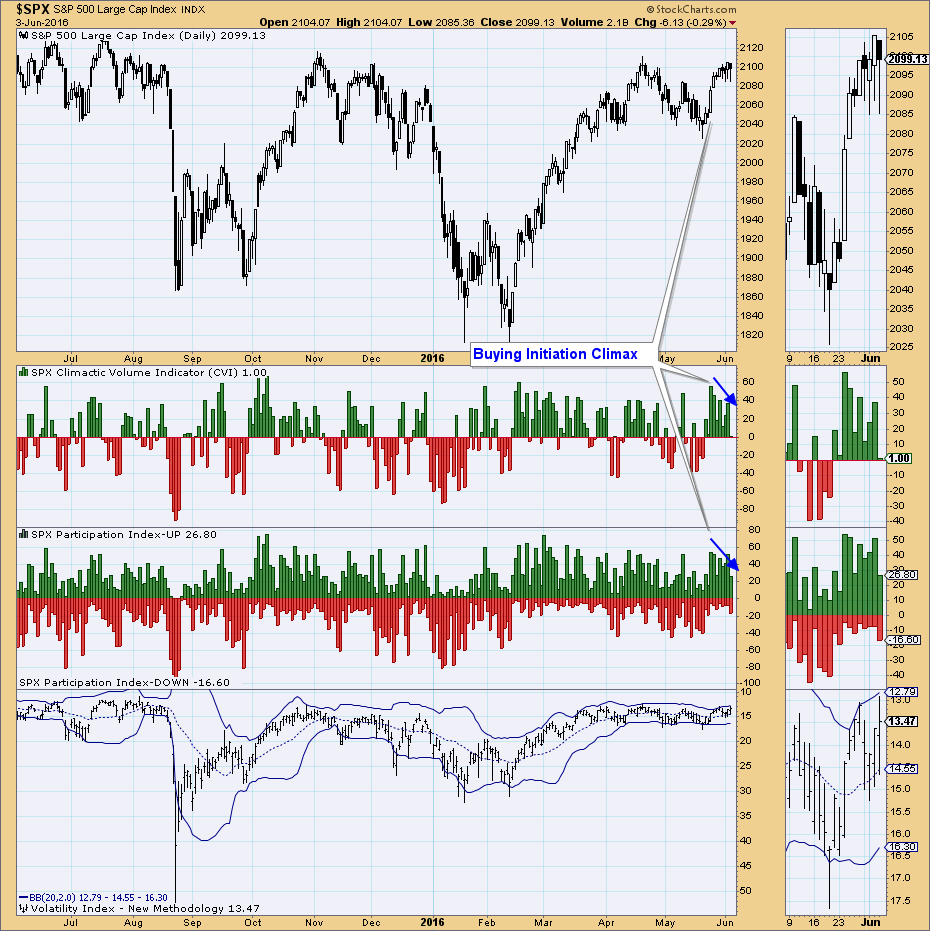
The short-term indicators topped after the initial rally slowed. They are declining bearishly and have not yet left overbought territory. They need to unwind further. This generally occurs one of two ways: 1) decline/pullback, 2) more consolidation.
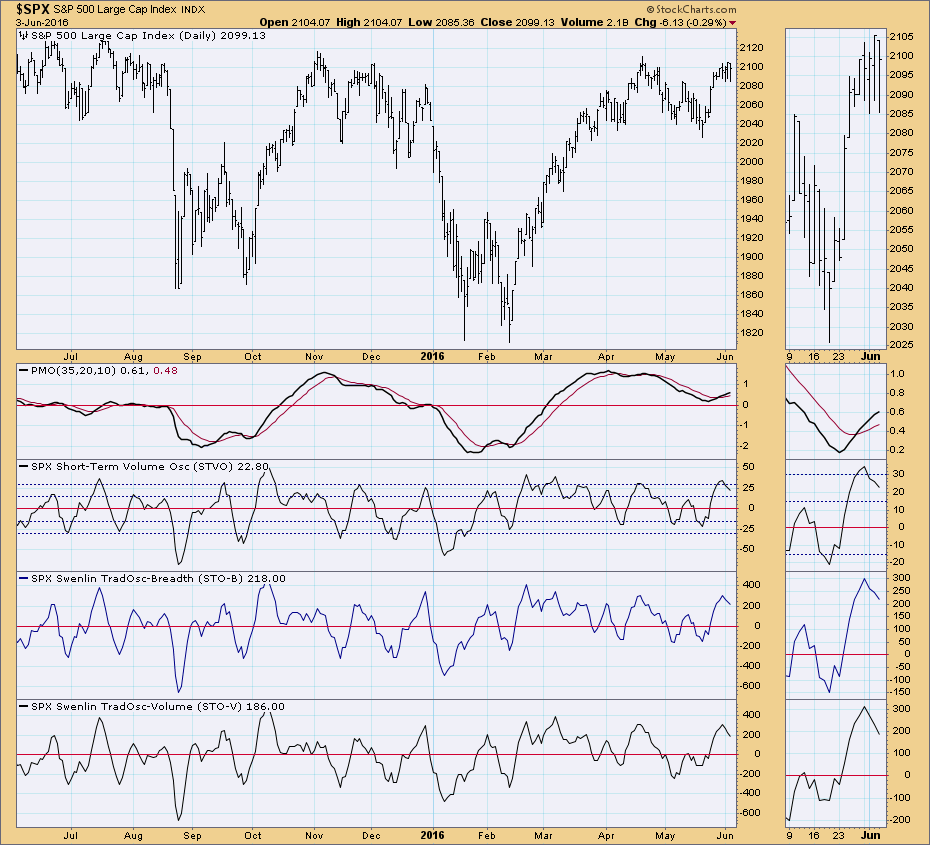
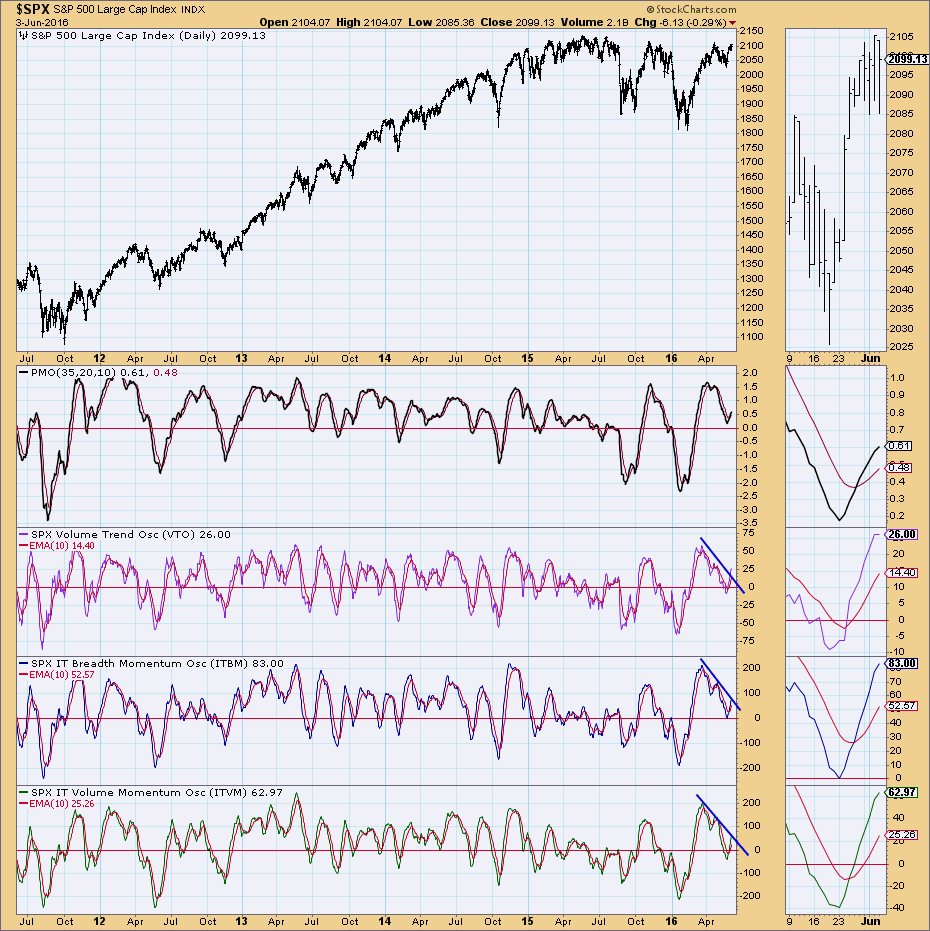
On the other hand, intermediate-term indicators are bullish and rising. The VTO flattened out today, but it has already broken out of its declining trend. The ITBM and ITVM are rising strongly with little hesitation since a positive crossover their EMAs. They haven't quite broken out of their declining trend, but they are poised to next week. Best of all...they aren't overbought.
Conclusion: Short-term indicators are leaning bearish. They need to move out of overbought territory and unwind at least into neutral territory so they can begin storing energy to support a rally to all-time highs as called for by the bullish intermediate-term indicators.
Come check out the DecisionPoint Report with Erin Heim on Wednesdays and Fridays at 7:00p EST, a fast-paced 30-minute review of the current markets mid-week and week-end. The archives and registration links are on the Homepage under “What’s New”.
Technical Analysis is a windsock, not a crystal ball.
Happy Charting!
- Erin
Over the past month, the Dow Jones U.S. Semiconductor Index ($DJUSSC) has risen more than 8% and helped to strengthen the technology sector (XLK) relative to the S&P 500. The XLK has been very strong on a relative basis since the middle of 2013 and just recently that relative strength reappeared. Check out the longer-term absolute performance of the XLK and how it's performed relative to the S&P 500:
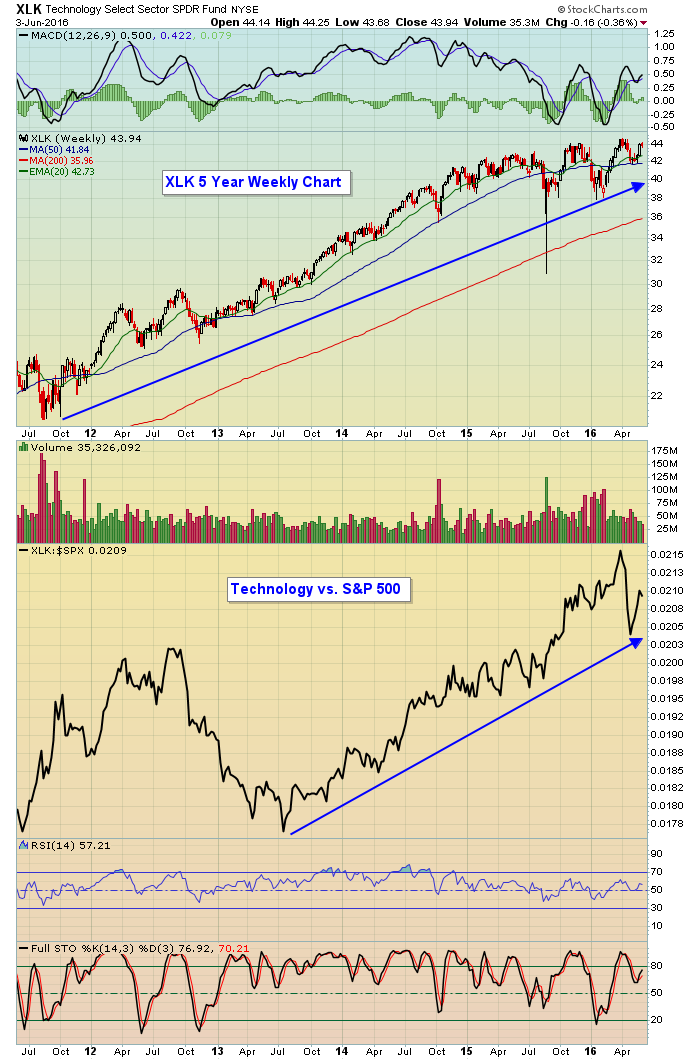 From the price low in the summer of 2011, the XLK has been performing very well. But it didn't began outperforming the S&P 500 until July 2013 and that relative outperformance is shown above with the blue line. There have been several industry groups within technology that have helped lead the group at various times, but currently that leadership role certainly belongs to semiconductors. Key support held at 1725 and now the DJUSSC is challenging resistance near 1935. Thus, the trading range is 1725-1935. Take a look:
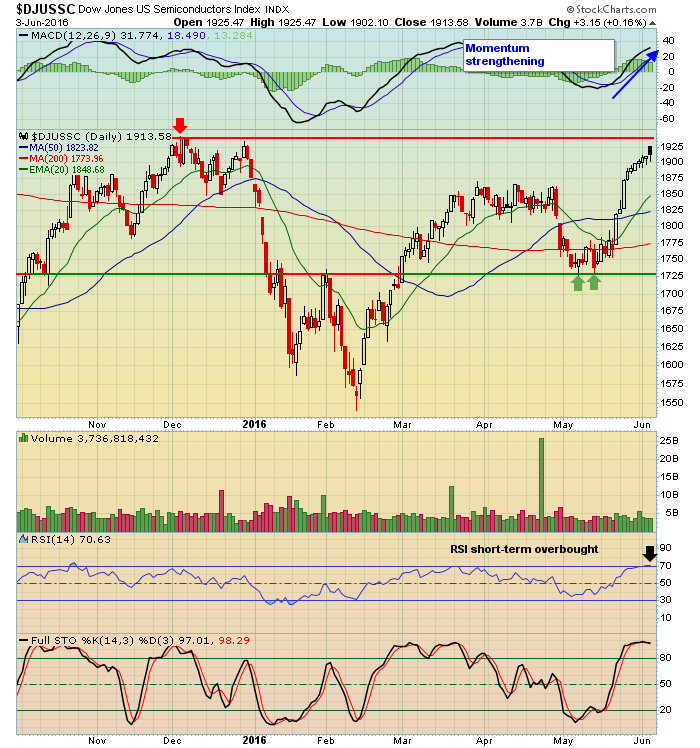 The good news is that bullish momentum in semiconductors is strengthening. The bad news is that overhead price resistance is approaching with short-term overbought conditions. So I'd look for perhaps a short-term pullback to relieve the overbought oscillators, but should an overall breakout in the market occur, leadership from technology, especially semiconductors, should be viewed bullishly indeed.
Happy trading!
Tom
WHEN BAD NEWS IS...BAD NEWS
by John Hopkins | InvestEd Central
The stock market can be quite mystifying. Depending on the mood of the market, good news can be interpreted as bad news, bad news can be seen as good news and every once in a while good news and bad news are seen just as described. It's one of those things that can throw traders for a loop and add to the challenges of trading.
This Friday we saw a very weak jobs report which on one hand could be seen as good news since it now keeps the Fed from raising interest rates in June and possibly July. But, based upon the market reaction, you can see that traders were disappointed in the weak jobs numbers because the Fed had been telegraphing recently that they were all set to raise rates, and now those plans are on hold.
Below is a chart of the GDX which is a gold miners ETF. It had been very weak lately with the US dollar climbing and the prospect of an imminent rate hike. But that all changed on the bad news that came out Friday with investors quickly shifting their dollars out of the stock market and into gold.
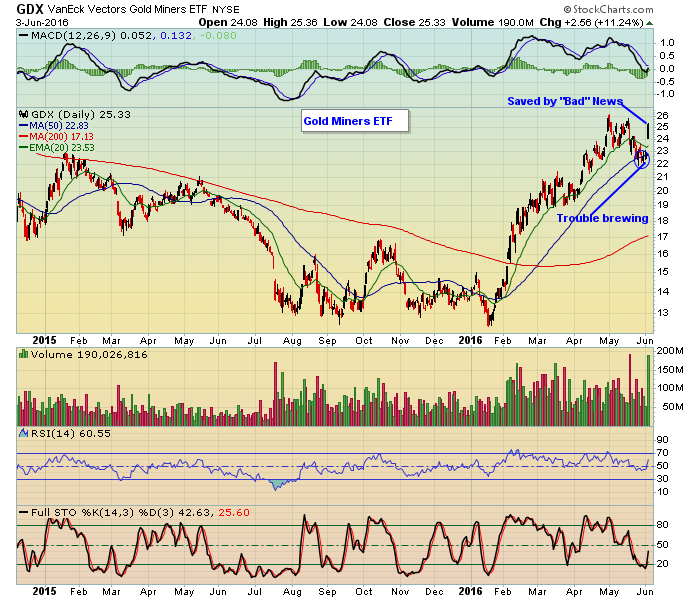
This move higher in the GDX is not insignificant. In one fell swoop it reversed course, closing above all key moving averages, just when it looked like the chart would break down completely.
So this is what traders have to deal with; interpreting if news is good, bad or indifferent. So instead of feeling confident that the best place to put funds to work is in the stock market, that all changed with one very bad jobs report.
The hallmark of a good trader is to shift strategies when called for. If you are a perma bear or a perma bull and are unable or unwilling to shift as necessary it's going to be a whole lot harder to get good results. So instead of trying to label news as good, bad or neutral, be prepared to make whatever changes are necessary once the market signals become clear.
At your service,
John Hopkins
EarningsBeats

Put your hands up if you can remember the big money we made in the 'Nifty Fifty' – those stocks from the '60s and '70s. or what about the Four Horsemen from 1999 to 2001? The famous FANG stocks of 2015 – Facebook, Amazon, Netflix and Google – had many of the same similarities. More on that in a minute. Tensile Trading is a methodology that teaches you how to metabolize your...
Read More


 I hope you can join us for ChartCon 2016 on September 23rd & 24th. I understand it will be online this year which means anyone should be able to attend. I also understand that tickets are going fast.


 Put your hands up if you can remember the big money we made in the 'Nifty Fifty' – those stocks from the '60s and '70s. or what about the Four Horsemen from 1999 to 2001? The famous FANG stocks of 2015 – Facebook, Amazon, Netflix and Google – had many of the same similarities. More on that in a minute. Tensile Trading is a methodology that teaches you how to metabolize your...