Art's Charts May 31, 2012 at 04:25 AM
Stocks were hit with concerns in Europe again on Wednesday. Once again, the market failed to put together back-to-back gains and failed to follow through on Tuesday's advance. All major index ETFs were down with small-caps leading the way... Read More
Art's Charts May 30, 2012 at 05:19 AM
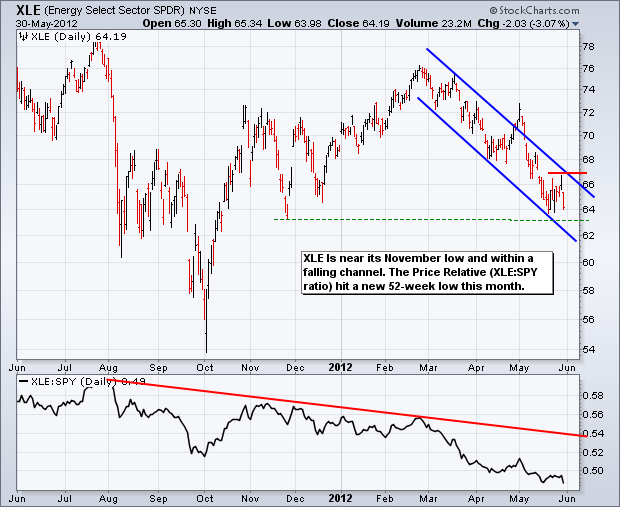
June is shaping up to be one critical month. Worse-than-expected economic reports this week would solidify the medium-term downtrends in the major index ETFs. Another Euro crisis after the Greek elections could keep buyers at bay even longer... Read More
Art's Charts May 29, 2012 at 05:49 AM
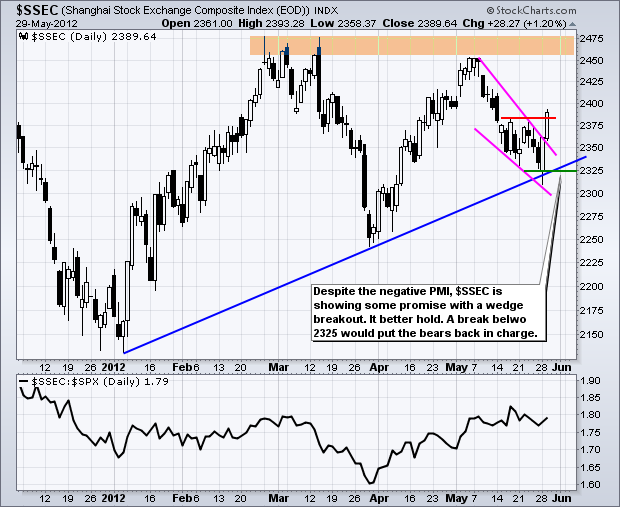
Stock futures are up sharply this morning as the world takes a small bite of risk. Stocks are higher in Asia with Shanghai and Australia up just over 1%. European stocks are higher, but only modestly so with most major indices up around .50%... Read More
Art's Charts May 29, 2012 at 05:43 AM
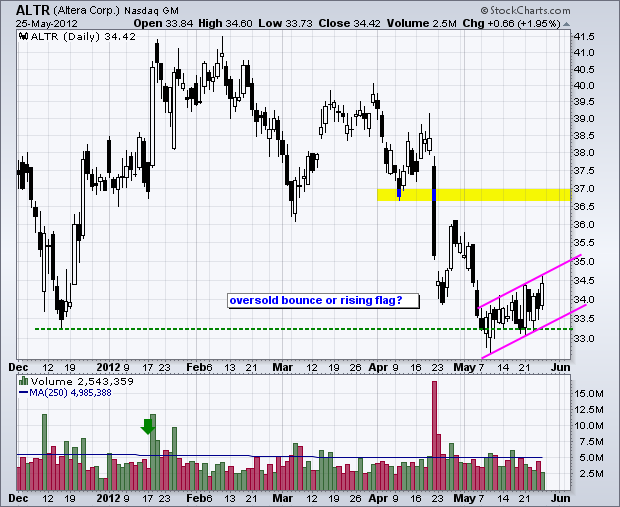
Careful out there. It could be a very volatile week. AMAT Forms Harami at Oversold Levels. PNC Stalls at Support. RIG Becomes Oversold and Consolidates. Plus ALTR, BHI, FNSR This commentary and charts-of-interest are designed to stimulate thinking... Read More
Art's Charts May 25, 2012 at 06:16 AM
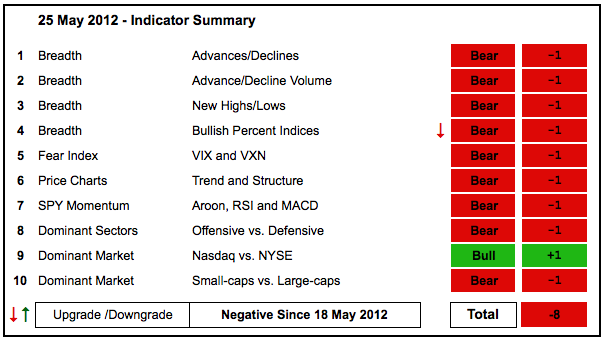
The indicator summary remains firmly bearish with nine of ten indicator groups now in the bearish camp. The Bullish Percent Index joined the bears as five of the nine sector BPIs moved below 50%. The AD Volume Lines clearly broke support to start downtrends this month... Read More
Art's Charts May 25, 2012 at 04:39 AM
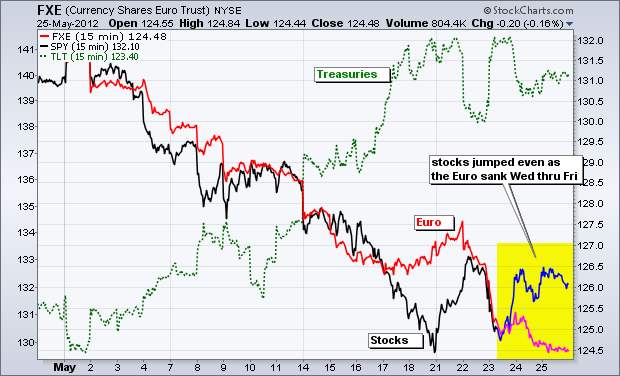
After meandering for most of the day Thursday, stocks caught a late bid and moved higher in the final hour. Except for the Nasdaq 100 ETF (QQQ), which closed down .66%, the major index ETFs were slightly higher on the day... Read More
Art's Charts May 24, 2012 at 05:11 AM
Let the roller coaster ride begin! Stocks started the day weak with the major index ETFs falling over 1% in the first two hours of trading. After firming for a few hours, stocks moved sharply higher in afternoon trading. Most of the major index ETFs closed with small gains... Read More
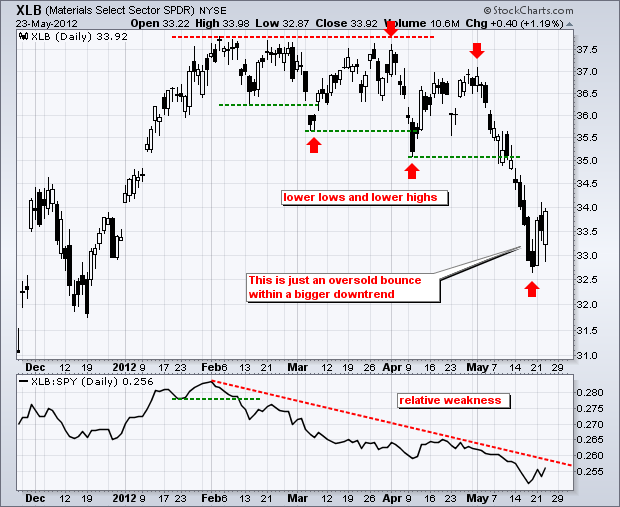
Art's Charts May 23, 2012 at 04:56 AM
After a one day oversold bounce, stocks stalled on Tuesday as indecisive candlesticks formed on many charts. The Russell 2000 ETF (IWM) and the Russell Microcap Fund (IWC) closed lower and showed relative weakness... Read More
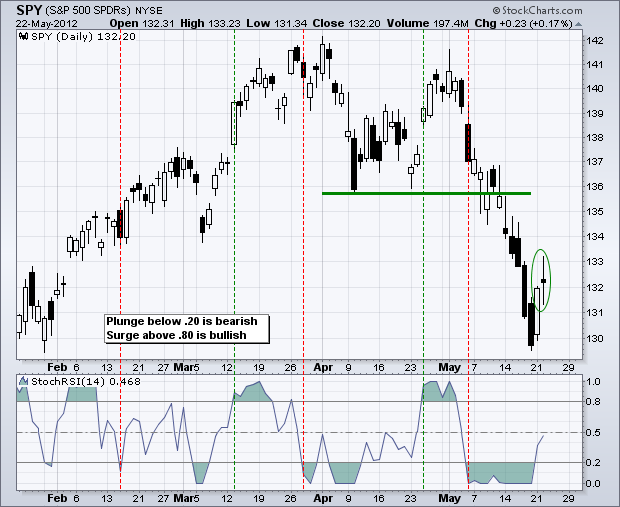
Art's Charts May 22, 2012 at 05:13 AM
Stocks rebounded on Monday with mid-caps leading the charge and the S&P MidCap 400 SPDR (MDY) surging 3.82% on the day. All sectors were higher with materials, technology, energy and industrials gaining over 2%... Read More
Art's Charts May 22, 2012 at 05:00 AM
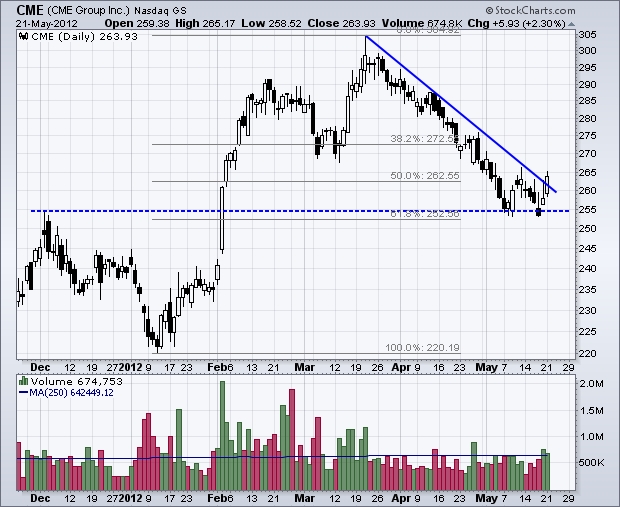
CME Surges off Key Retracement. ISIL Forms Pennant after High Volume Surge. LUV Breaks Flag Resistance on Big Volume. Plus CTXS, HOTT, IMN, SHLD This commentary and charts-of-interest are designed to stimulate thinking... Read More
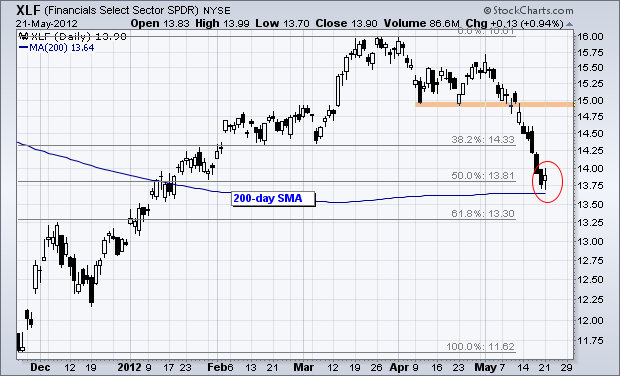
Art's Charts May 21, 2012 at 05:36 AM
Let the jawboning begin! The G8 came out with a very bold (not) statement over the weekend. In short, they urged Greece to stay in the Euro and said growth issues should be considered. Big deal... Read More
Art's Charts May 18, 2012 at 04:19 AM
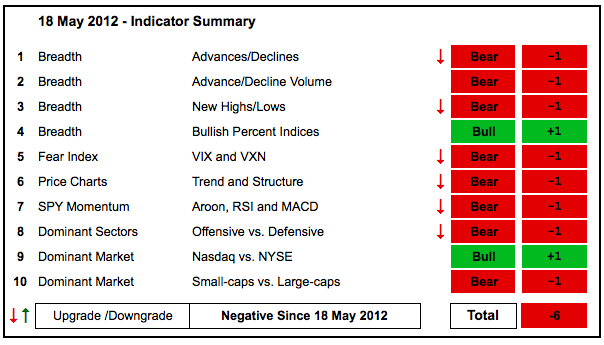
With a slew of downgrades, the indicator summary moved to -6 and decidedly negative for the first time since December. The bull run was long (5+ months), but the evidence has clearly shifted as selling pressure accelerated this week... Read More
Art's Charts May 18, 2012 at 04:06 AM
The decline in stocks accelerated on Thursday with QQQ and IMW falling over 2% and SPY loosing around 1.5%. This could be the beginning of the end, or it could simply be the middle of a free fall (see August 2011). Stocks are simply in falling knife mode... Read More
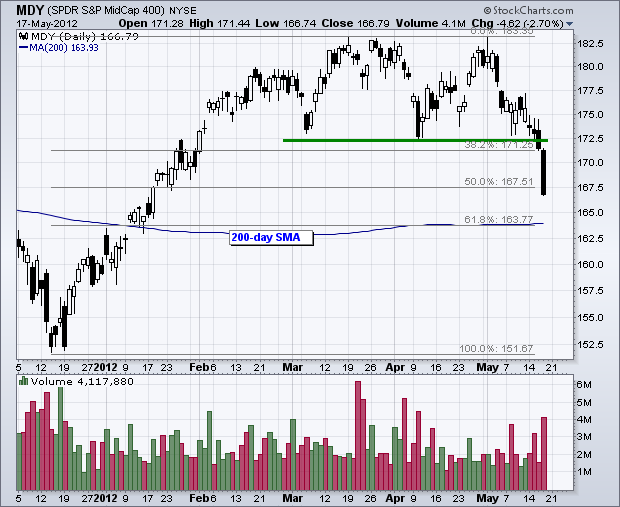
Art's Charts May 17, 2012 at 06:02 AM
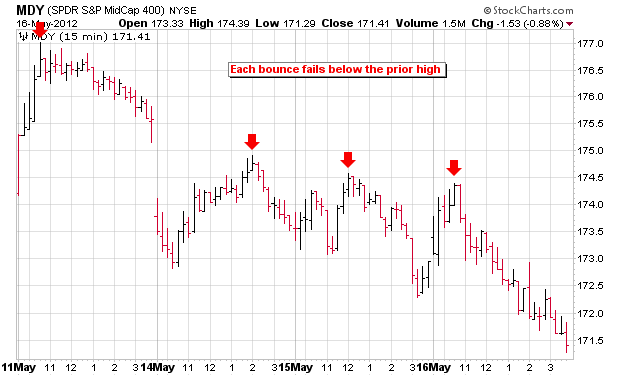
There it is again. Stocks opened with a little bounce and then worked their way lower the rest of the day. Every intraday bounce since May 11th has led to renewed selling pressure and lower lows. Buying pressure is weak on the bounce and none-existent after the bounce... Read More
Art's Charts May 17, 2012 at 05:54 AM
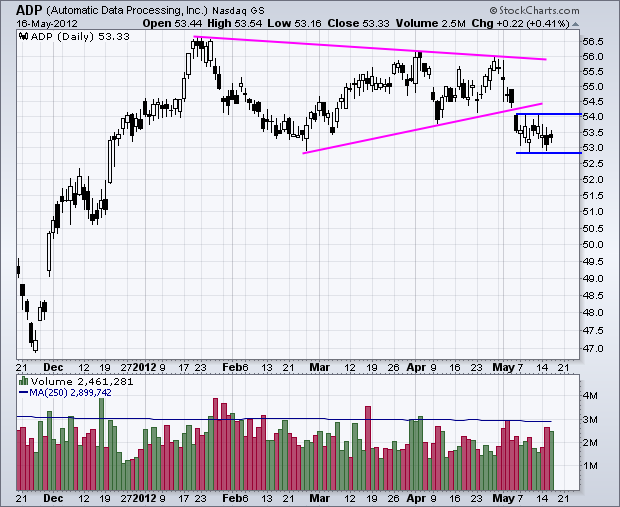
AMZN Stalls after Big Gap. FL Forms Pennant after High Volume Support Break. WSM Breaks Flag Support after Big Bull Trap. Plus ADP, AFFX, FL, LUV, ROK This commentary and charts-of-interest are designed to stimulate thinking... Read More
Art's Charts May 16, 2012 at 04:37 AM
US stocks opened strong on Tuesday, but buyers lost their nerve again and the major index ETFs closed near their lows for the day. Treasuries continued higher as investors sought relatively safety ahead of June elections in Greece... Read More
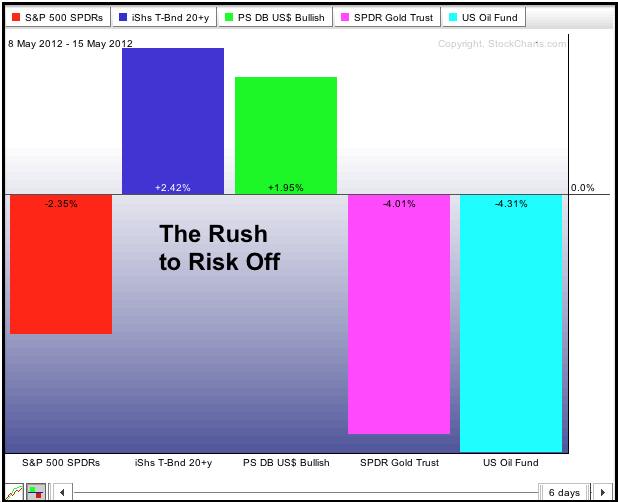
Art's Charts May 15, 2012 at 07:07 AM
The risk-off trade was in full force on Monday: treasuries and the Dollar moved higher as stocks, oil and the Euro moved lower. Stocks opened weak, bounced a little and then closed weak as buyers lost their nerve... Read More
Art's Charts May 15, 2012 at 07:03 AM
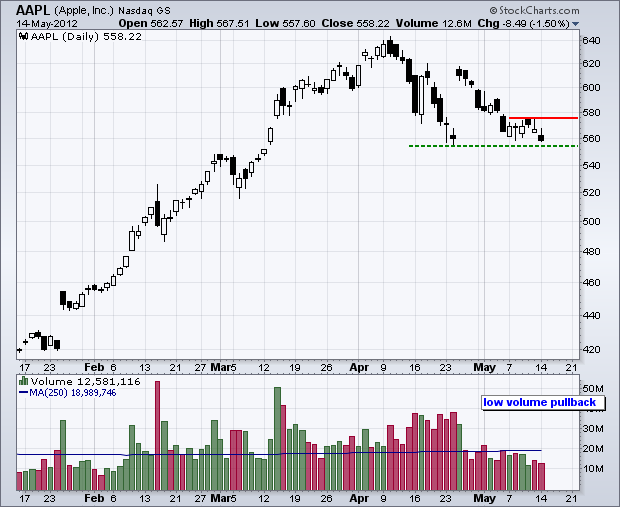
AAPL Declines to Support on Low Volume. ABC Surges off Support with Big Volume. Plus CAH, CVG, IMN, NKE, XRX This commentary and charts-of-interest are designed to stimulate thinking... Read More
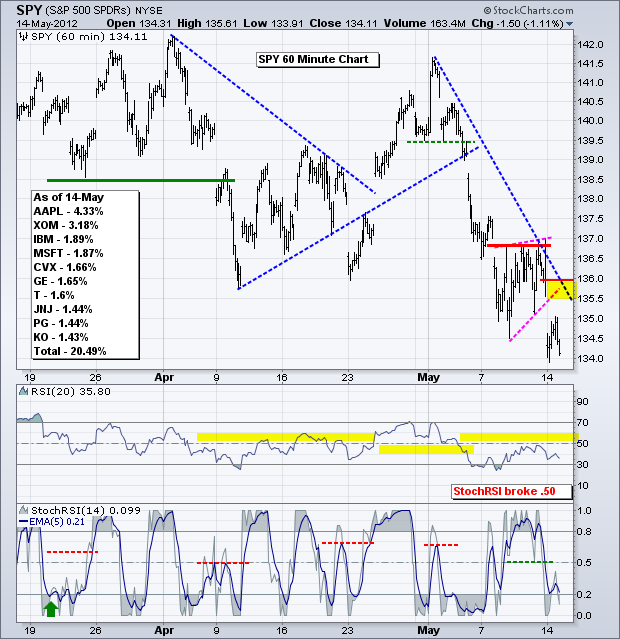
Art's Charts May 14, 2012 at 05:31 AM
The risk-off trade has been dominant since May and shows no signs of changing this week. The world is openly talking about a Greek exit from the Euro, perhaps within a month. The fear is not so much the Greek exit, but rather the affect it will have on Portugal and Spain... Read More
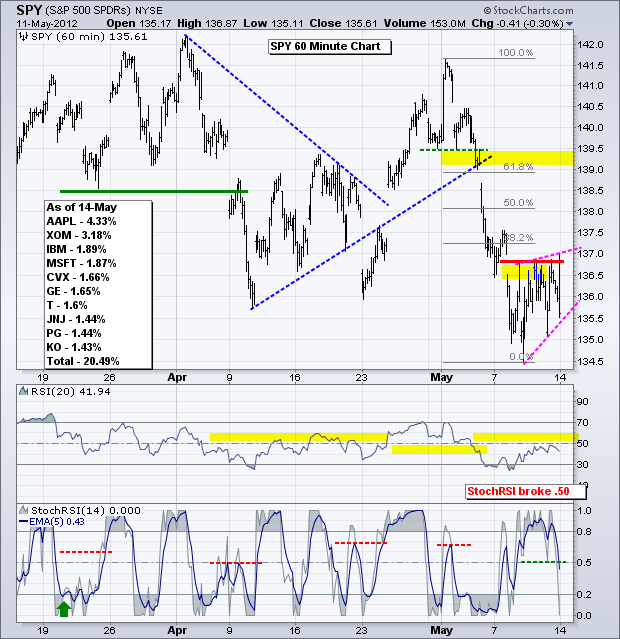
Art's Charts May 11, 2012 at 06:49 AM
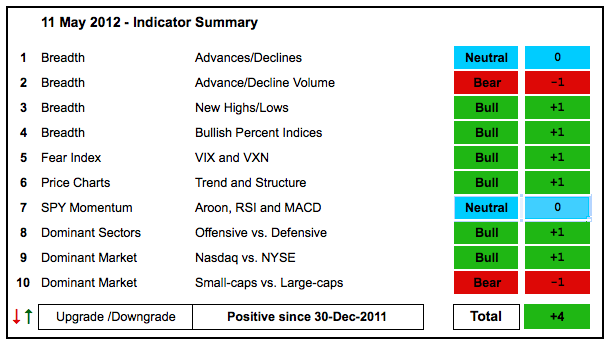
The indicator summary moved to +4 because of two downgrades. Of note, the AD Volume Lines broke support to turn bearish. Despite these breaks, the NYSE AD Line remains in bull mode and the Net New Highs indicators are still considered bullish... Read More
Art's Charts May 11, 2012 at 05:05 AM
A disappointing outlook from Cisco (CSCO) weighed on the tech sector Thursday. In particular, the company sighted future concerns on government spending in the US and Europe. A $2 billion derivatives loss from JP Morgan Chase (JPM) is weighing on stock futures early Friday... Read More
Art's Charts May 10, 2012 at 05:33 AM
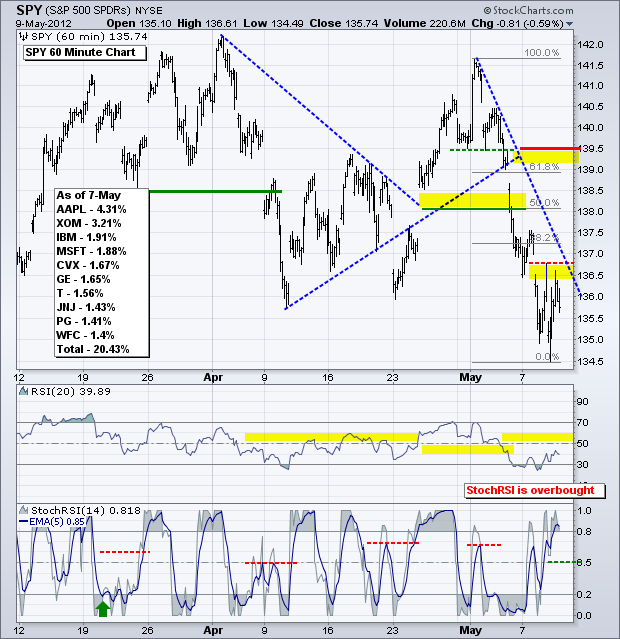
Several major index ETFs are testing their March-April lows and these support zones could produce oversold bounces... Read More
Art's Charts May 10, 2012 at 05:26 AM
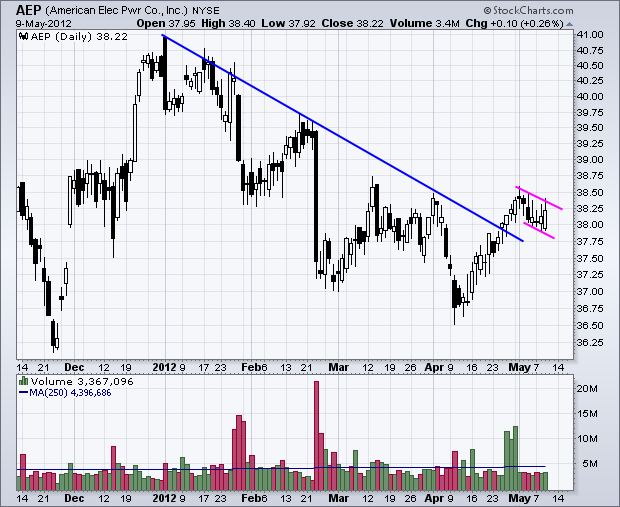
CNX Bounces off Consolidation Support with big Volume. GFI Forms Bullish Engulfing. USI Forms within Gap Zone. Plus AEP, AN, ITT This commentary and charts-of-interest are designed to stimulate thinking... Read More
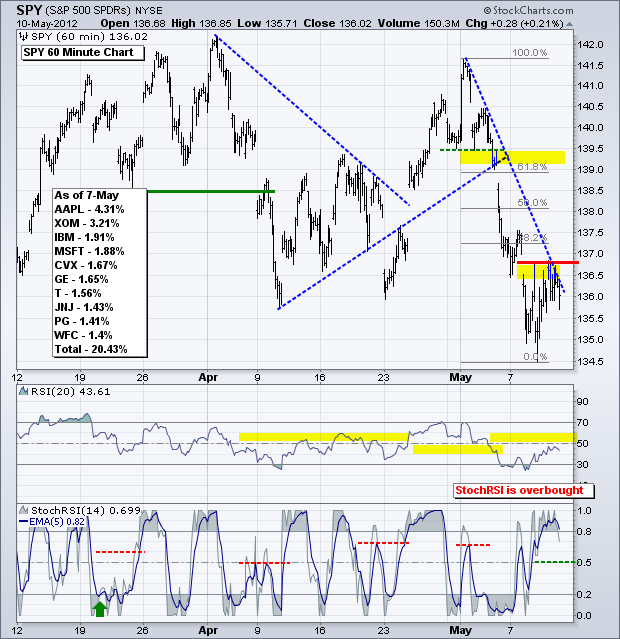
Art's Charts May 09, 2012 at 03:54 AM
The S&P 500 ETF (SPY) pierced its April lows with a sharp decline on the open and the bounced with an afternoon surge. Traders can expect this kind of volatility because bargain hunters and bottom pickers become active after sharp decline... Read More
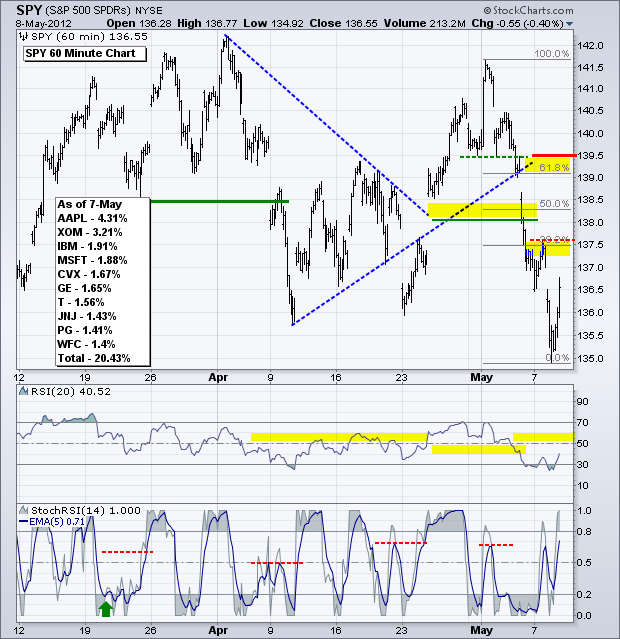
Art's Charts May 08, 2012 at 06:17 AM
After a big decline last week, stocks firmed on Monday and there is no change for the major index ETFs. A lot of news hit the fan over the past week and it looks like traders took a rest on Monday... Read More
Art's Charts May 08, 2012 at 06:14 AM
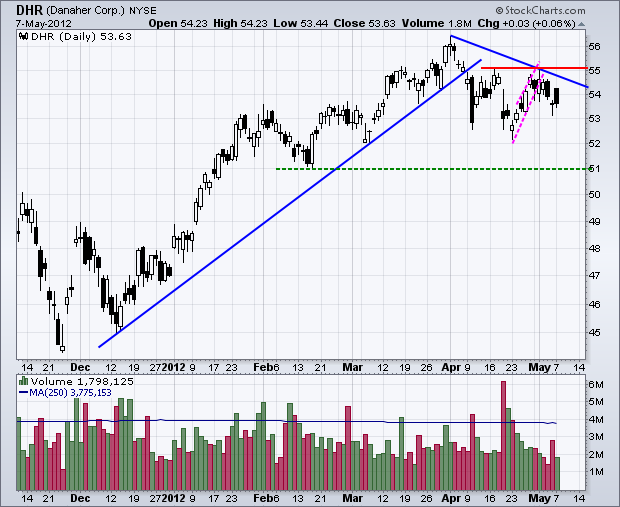
GOOG Forms Pennant after Sharp Decline. MMM Hits Resistance and Declines into Gap Zone. URBN Declines after Big Harami Pattern. Plus DHR, FITB, LUV, SCHW This commentary and charts-of-interest are designed to stimulate thinking... Read More
Art's Charts May 07, 2012 at 04:19 AM
Uncertainty ratcheted up a notch in Europe as Hollande won the French election and the ruling coalition in Greece was dealt a setback. Asian stocks are down sharply, European stocks are down and Dow futures are down around 100 points... Read More
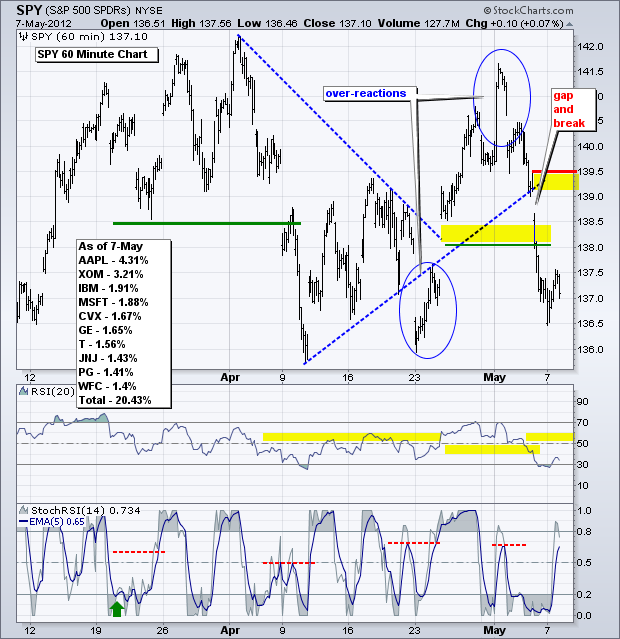
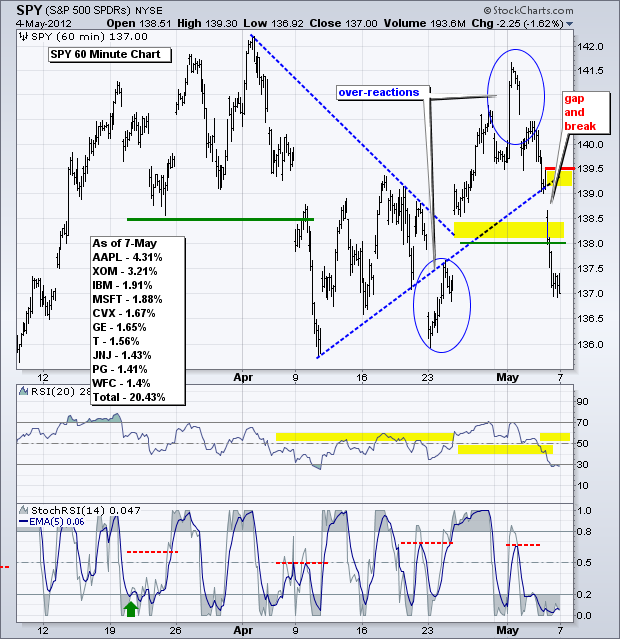
Art's Charts May 04, 2012 at 06:06 AM
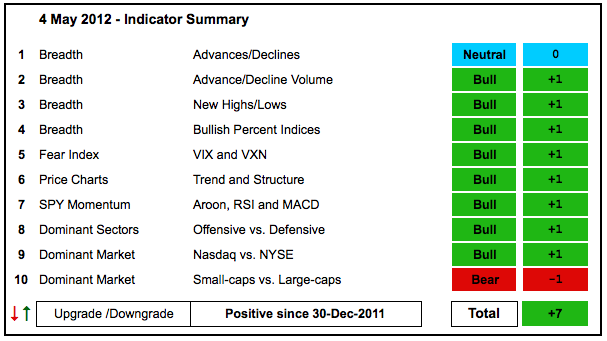
There are no changes in the indicator summary, but I am watching the AD Volume Lines quite closely. Even though both bounced over the last few weeks and essentially held support from the March lows, this bounce has not been that strong... Read More
Art's Charts May 04, 2012 at 04:42 AM
Stocks were under pressure on Thursday after a worse-than-expected ISM Services Index. This diffusion index came in at 53.5 for April, compared to 56 in March. Even though the index dropped, it remains well above 50 and indicative of economic expansion, not contraction. From ism... Read More
Art's Charts May 03, 2012 at 05:58 AM
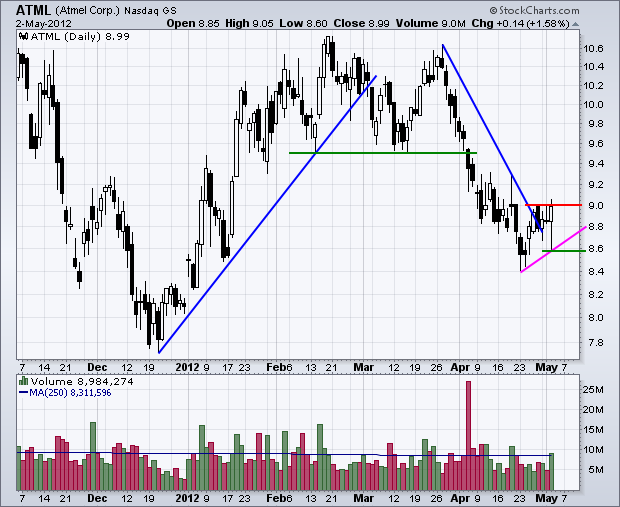
Upside Volume Picks up for ATML. KFY Gaps up and Consolidates. MD Forms Bullish Engulfing on High Volume. Plus BWA, DWA, KMX This commentary and charts-of-interest are designed to stimulate thinking... Read More
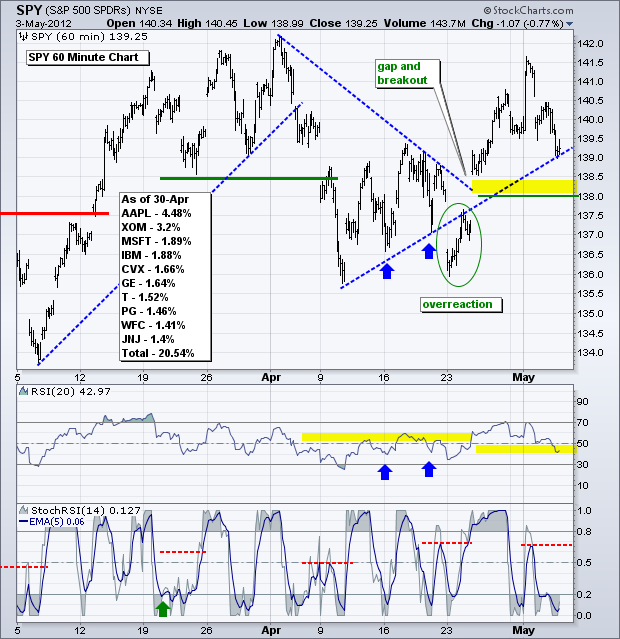
Art's Charts May 03, 2012 at 04:58 AM
Stocks opened weak after the ADP Employment report came in below expectations. Nevertheless, the market firmed and worked its way higher the rest of the day... Read More
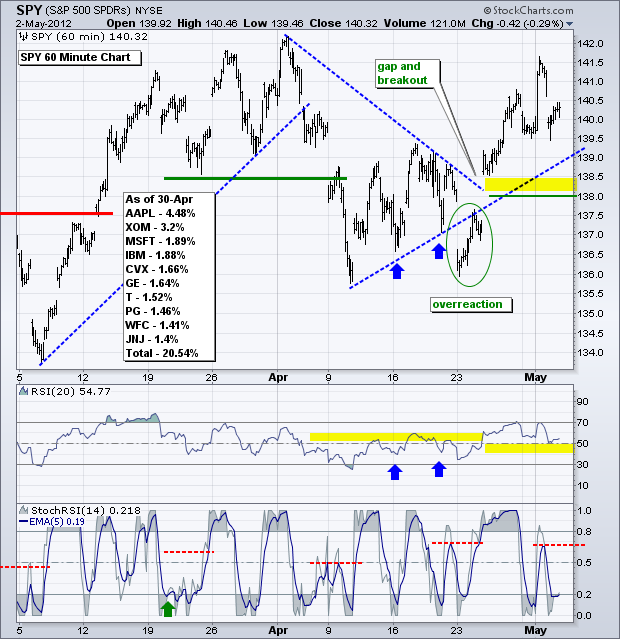
Art's Charts May 02, 2012 at 04:48 AM
It was pop and drop for stocks on Tuesday. Stocks surged on the heels of a better-than-expected ISM Manufacturing Index, but failed to hold early gains and fell sharply in the final hour. Small-caps (Russell 2000) and techs (Nasdaq) led the way lower... Read More
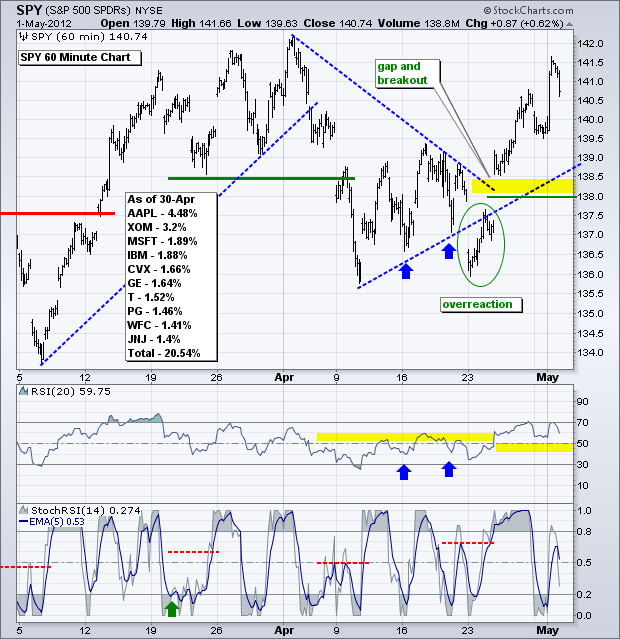
Art's Charts May 01, 2012 at 06:31 AM
Stocks pulled back on Monday after the Chicago PMI came in below expectations and reached its lowest level since November 2009. Nevertheless, this key indicator came in at 56.20, which is well above 50 and indicative of economic expansion. Anything above 50 is positive... Read More
Art's Charts May 01, 2012 at 06:22 AM
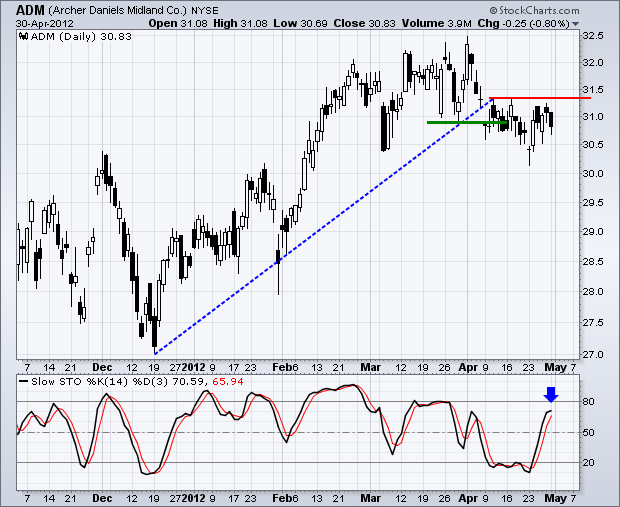
BHI Breaks Pennant Resistance. HPQ Consolidates after High Volume Surge. MAN Breaks Pennant Support. Plus ADM, CMI, MON, SKS This commentary and charts-of-interest are designed to stimulate thinking... Read More