The Canadian Technician August 31, 2012 at 03:25 PM
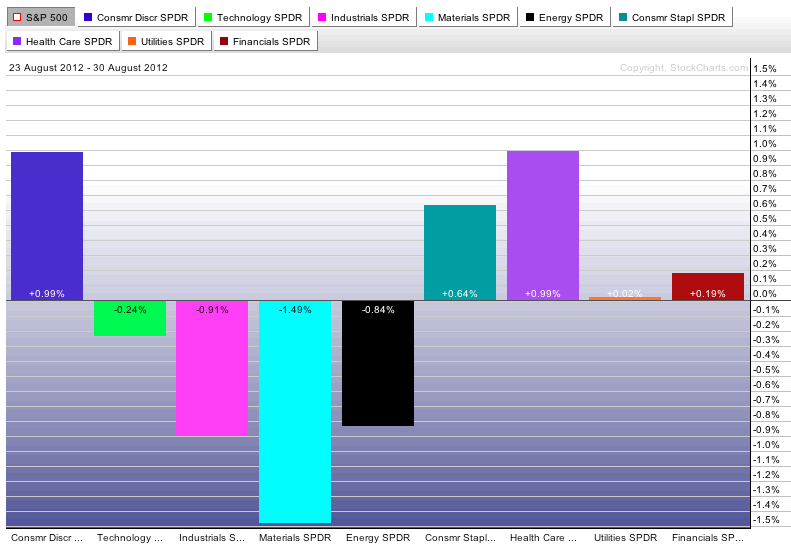
At the recent Chartcon event in Seattle, John Murphy spoke on how he follows the markets. One of his favorite charts is the sector perf chart. It can tell you a lot about how the sector rotation is moving in the market... Read More
The Canadian Technician August 31, 2012 at 02:13 PM
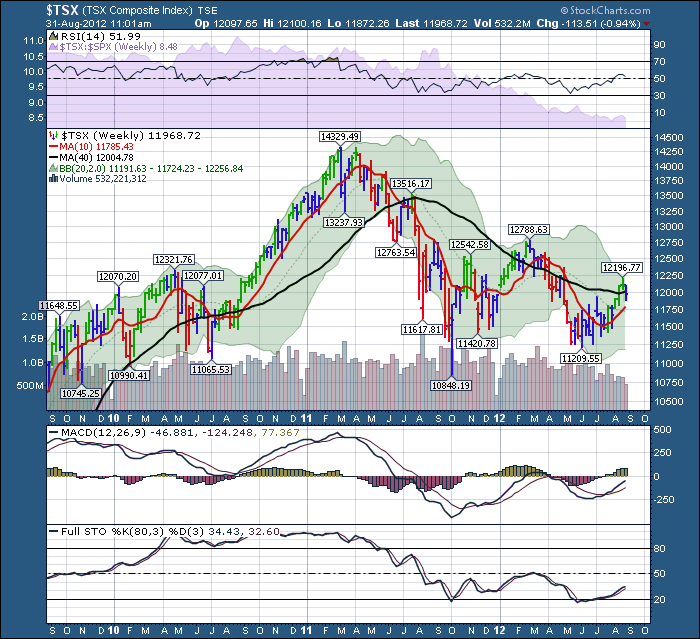
Some folks like to use the 40 Week MA as the dividing line between bull and bear markets. Long term planners will look on monthly charts. Today becomes meaningful. A Federal reserve push up has been pretty common recently at month ends. Mario Draghi spoke late in July... Read More
The Canadian Technician August 30, 2012 at 02:13 PM
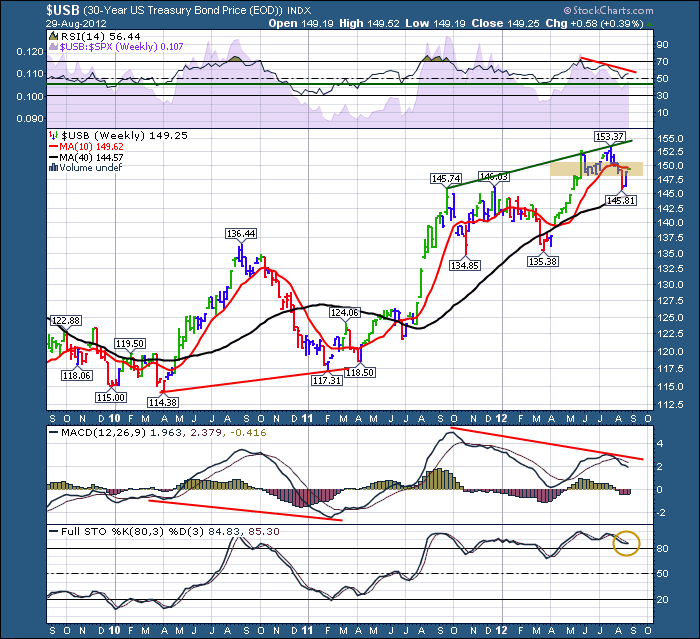
$USB - Sometimes the Bond market is a better clue to the future than the equities. The bond market is just so big, it is very important to understand the sentiment towards holding bonds. Recently Warren Buffett's holding had a dramatic drop in Municipal bonds... Read More
The Canadian Technician August 28, 2012 at 04:21 AM
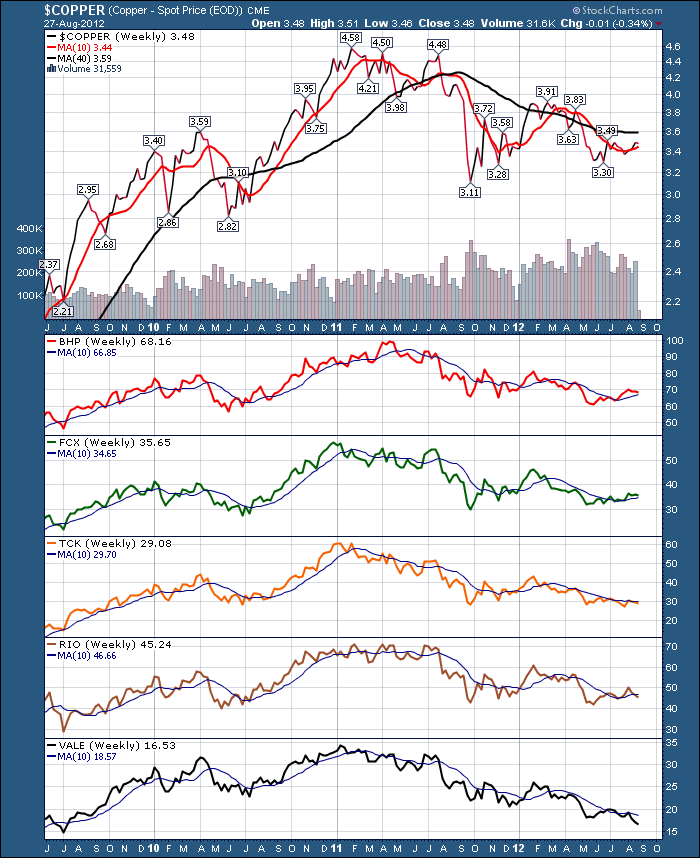
Nothing would be better than $COPPER jolting higher. Unfortunately, lightning has not struck and sent this to higher ground. It's tepid at best, and the miners below are not staying above the 10 week, even though $COPPER is. This could be back underwater soon... Read More
The Canadian Technician August 27, 2012 at 04:37 AM
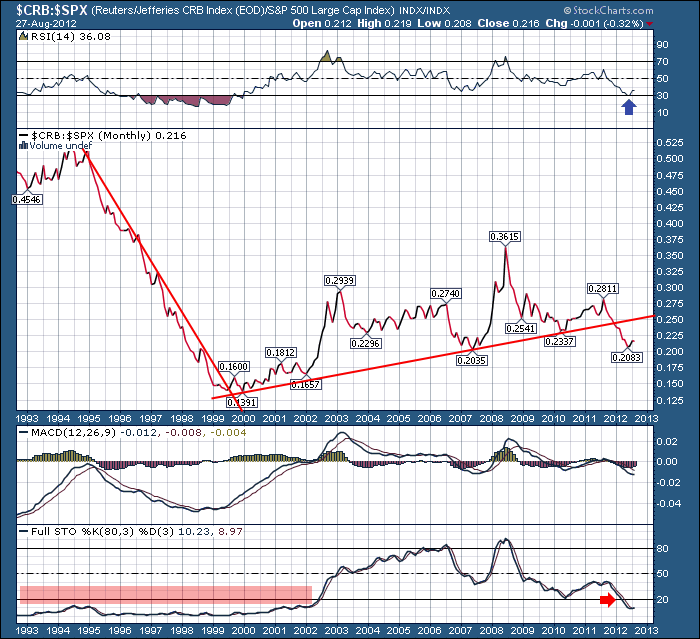
Last week we covered the $USD and $WTIC. Today, I want to continue on that subject and talk about what the long-term implications of US dollar breaking higher would be... Read More
The Canadian Technician August 26, 2012 at 03:17 PM
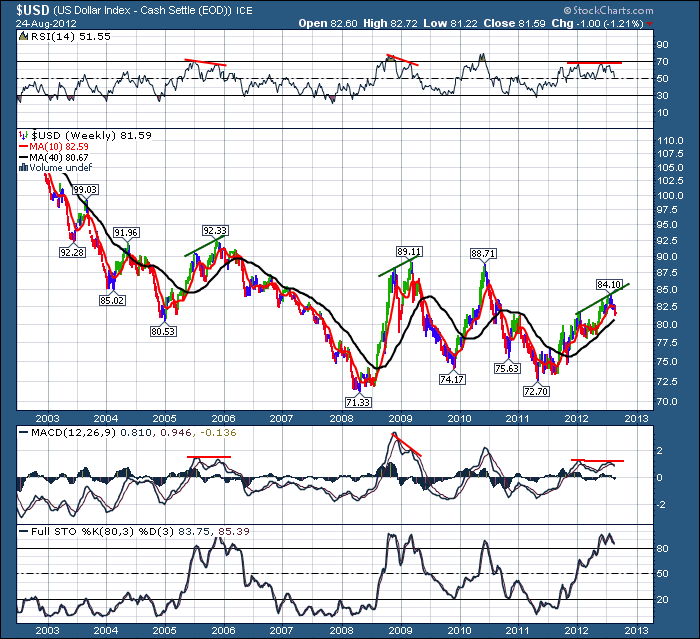
OK... Read More
The Canadian Technician August 25, 2012 at 02:32 PM
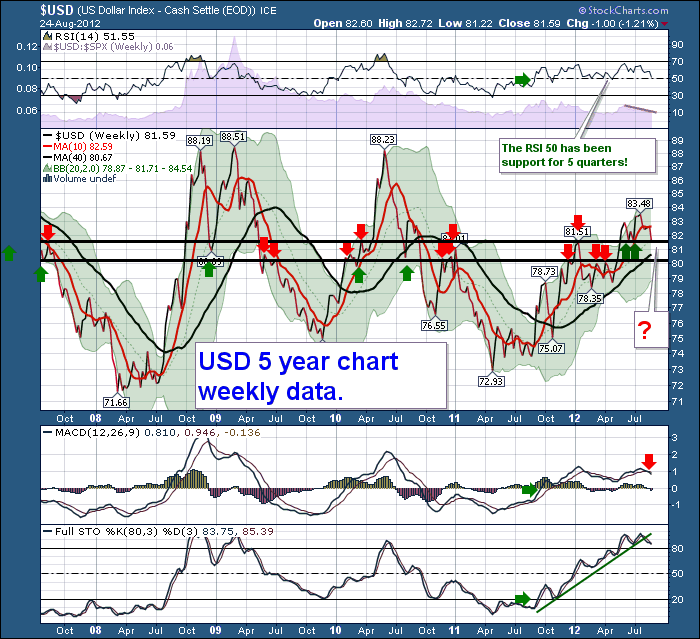
One thing that I absolutely love about Stockcharts.com is the ability to save multiple charts of the same stock, currency, commodity or index. It allows you to have different ideas on different charts so you can explore different ideas at the days progress... Read More
The Canadian Technician August 24, 2012 at 06:17 AM
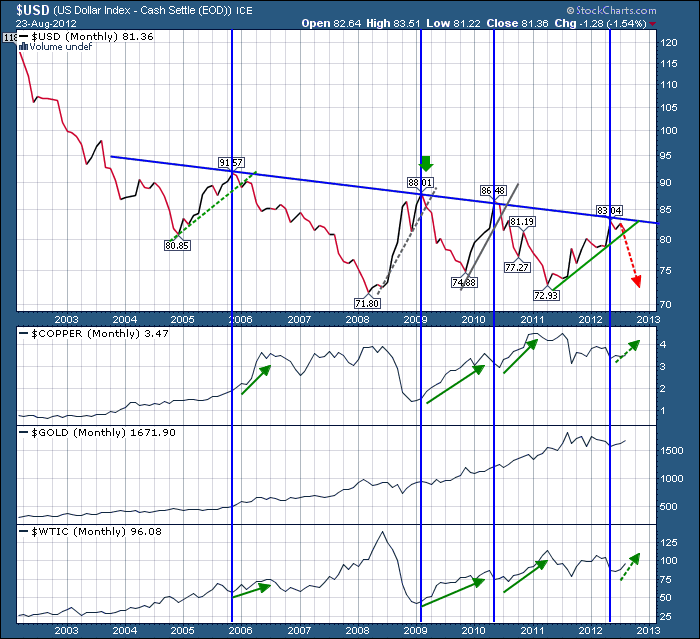
As 'The Canadian Technician", I seem to write about the US Dollar a lot. That is because 80% of Canada's exports, all commodities, and seemingly most equities are tied to the tide of the $USD... Read More
The Canadian Technician August 23, 2012 at 12:58 PM
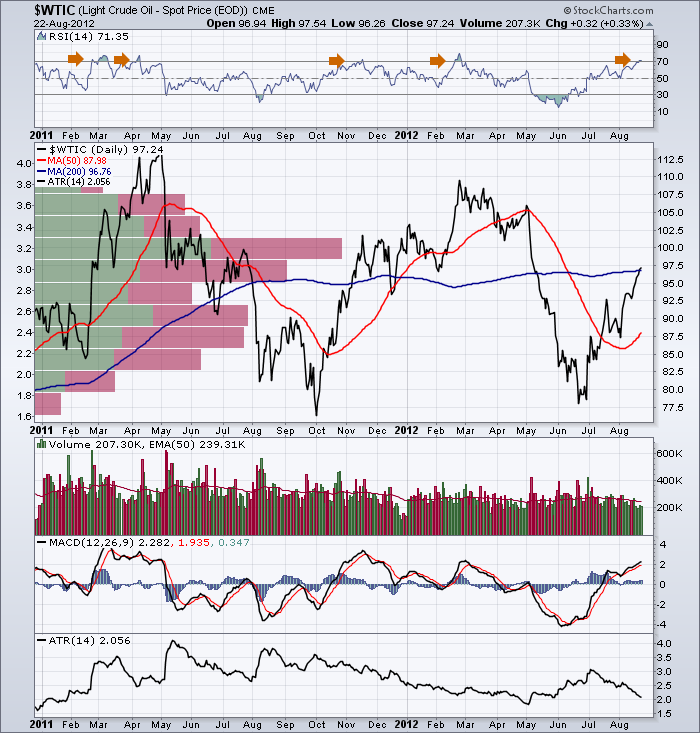
"Up from the ground come's a bubblin' crude." Maybe we should change Jed's theme song to "Up from the down come's a bubblin' crude oil price". OK...no songwriting skills present. Let's do some chart analysis on crude. I have a few different ideas here... Read More
The Canadian Technician August 22, 2012 at 04:05 AM
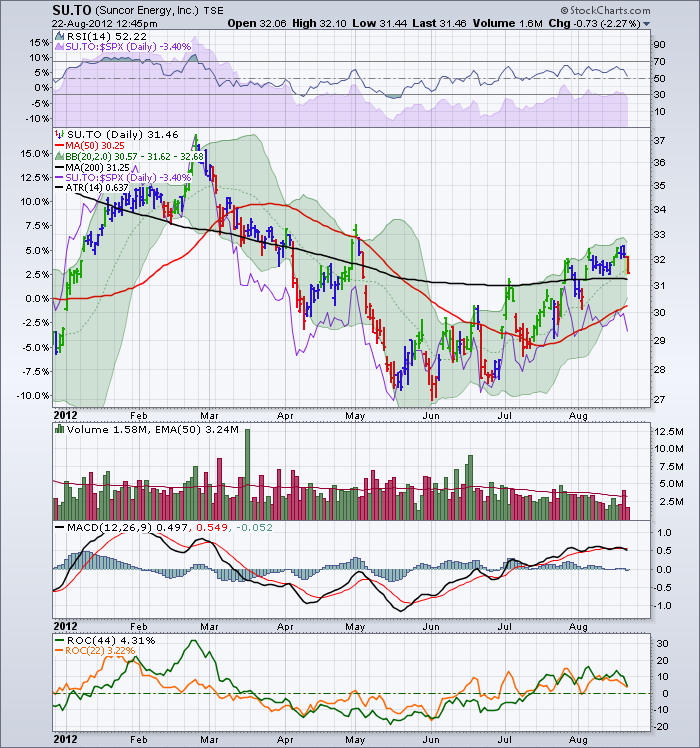
Suncor broke above it's July highs 5 weeks ago. Let's check the chart. Well, considering Suncor broke out mid to Late July, it sure hasn't done much. The stock appears stuck between $31- $32.50. The rate of Change at the bottom is still above zero, but struggling... Read More
The Canadian Technician August 21, 2012 at 02:55 PM

Tim Hortons double double? or double trouble? As parents stand inline to enrol the family in the fall / winter sports activities, one thing is always in their hand. From Timbits soccer jerseys to timbits hockey uniforms the fall season is a Tims marketing spectacular... Read More
The Canadian Technician August 21, 2012 at 02:30 PM
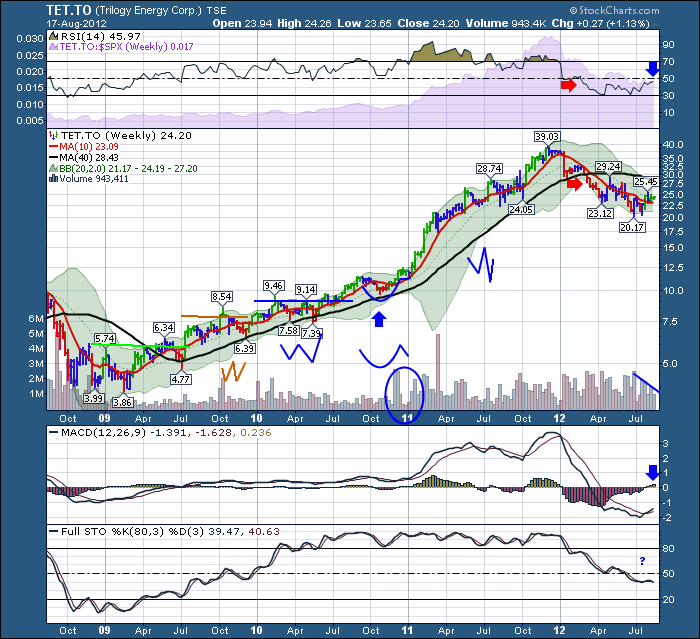
Well the final chapter has arrived. OOOUCHHHH!. Trilogy fell off a cliff and landed in the penalty box. Who could have seen that coming? Well, by studying the weekly charts I can't find any clues that a great growth stock was going to give up so much so fast... Read More
The Canadian Technician August 20, 2012 at 11:14 AM
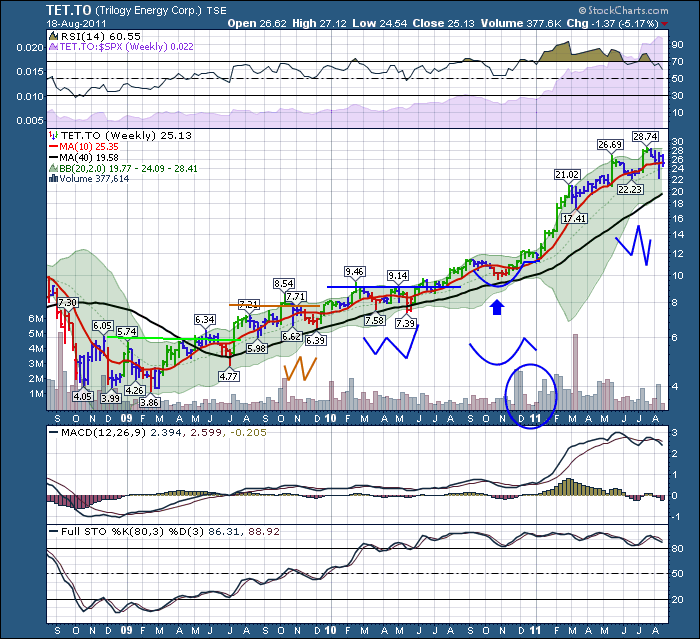
Well, the Third part of a four part on Trilogy...Yep, the titles as confusing as the stock market! The Double bottom in 2009 and 2010 were strong patterns within a strong uptrend... Read More
The Canadian Technician August 19, 2012 at 11:59 AM
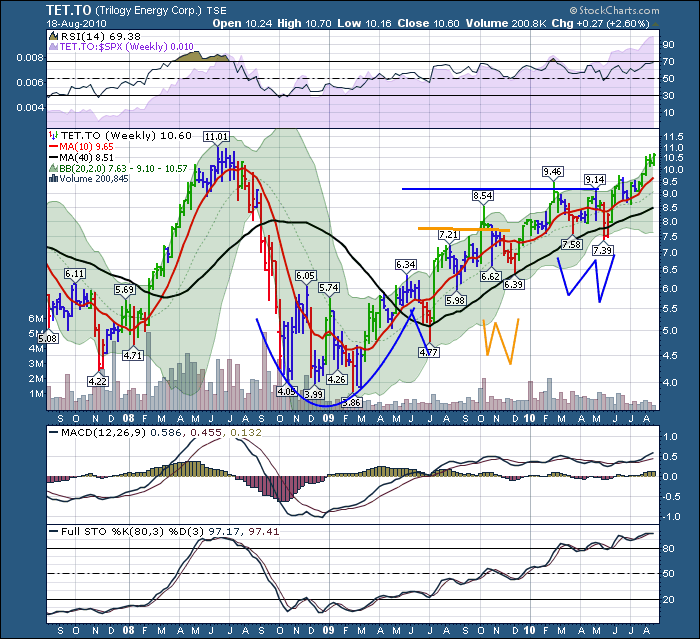
Lets move it out a year. Trilogy August 2010 The weekly RSI on Trilogy stayed in the top half of the RSI Band. Never touching 40. Beautiful. Look at the price action on the chart. Twice, Trilogy put in a double bottom formation, shaking out weak holders of the stock... Read More
The Canadian Technician August 18, 2012 at 05:00 AM
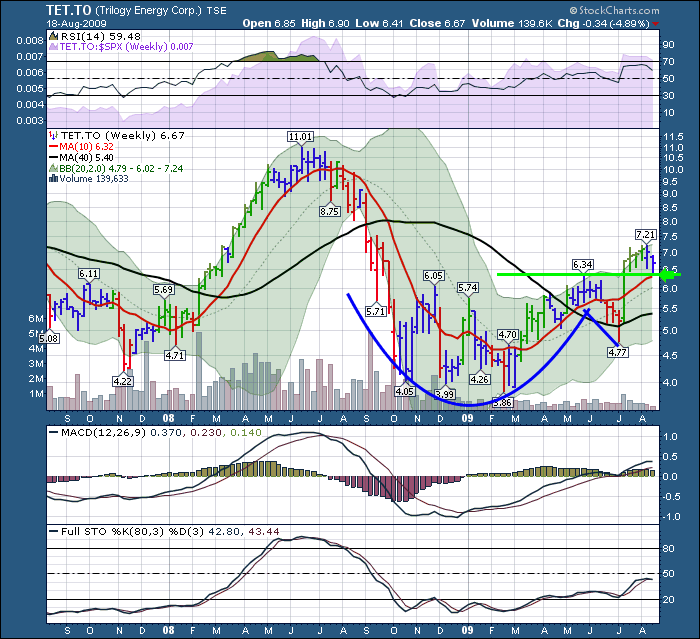
Let's just move off the global political spectrum today and analyze a very interesting Canadian Company. The Chart has all kinds of technical patterns, and we need to understand them. More importantly, how can we use stockcharts.com to make some money... Read More
The Canadian Technician August 15, 2012 at 09:26 AM
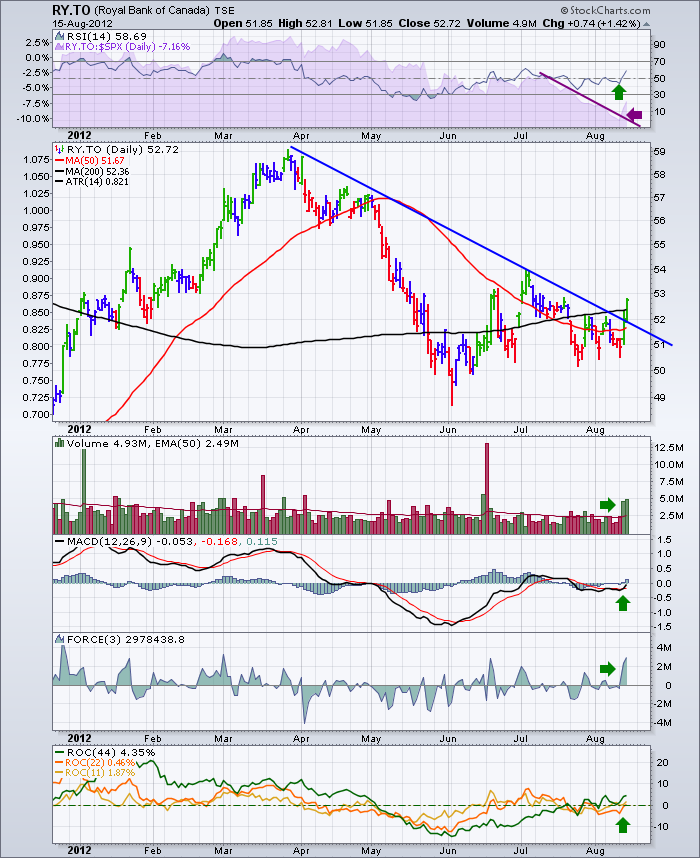
I was looking through charts today and the Banks in Canada are trying to break some downward trendlines. Here is the volume push and the trendline break on Royal Bank... Read More
The Canadian Technician August 10, 2012 at 08:26 AM
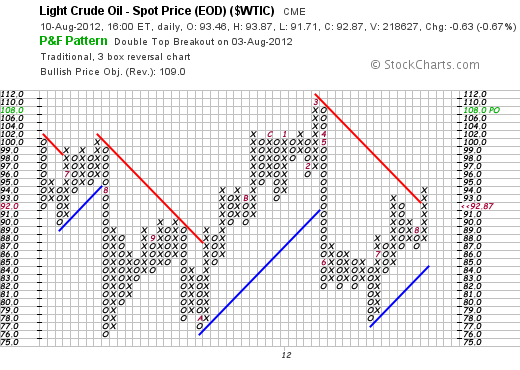
Last week The Oil Pnf Chart started the month on a column of O's. I wrote about it in the Chartwatchers newsletter. You can find the link here. Chartwatchers The chart immediately reversed to the upside. What a beautiful bounce off support... Read More
The Canadian Technician August 09, 2012 at 09:26 AM
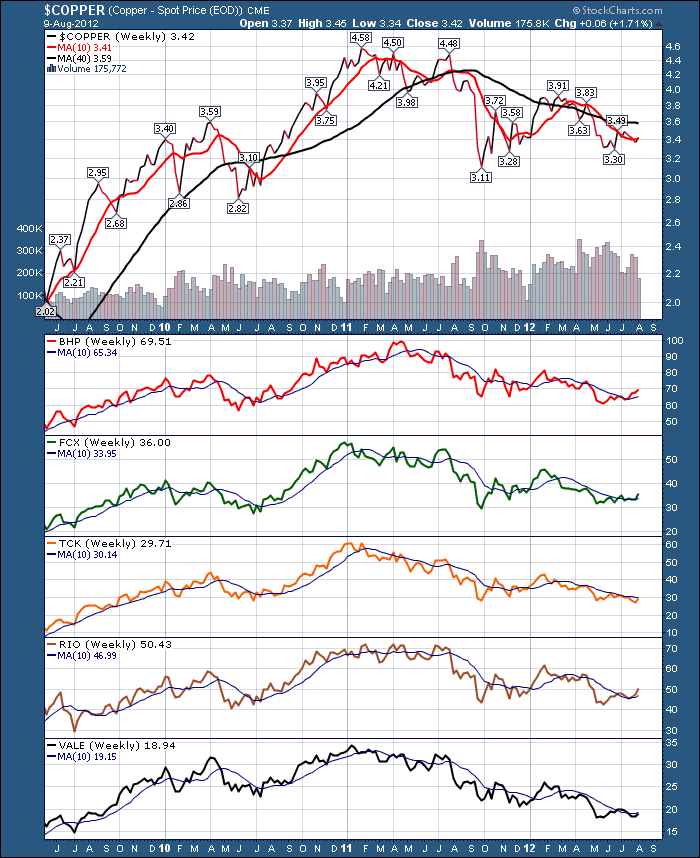
The $COPPER dashboard finally has a little life in it. All the mining stocks are trying to jump above the 10 week line. Finally. A commodities rally into the fall? I am getting more bullish on gold and the Canadian Energy as well... Read More
The Canadian Technician August 03, 2012 at 01:03 PM
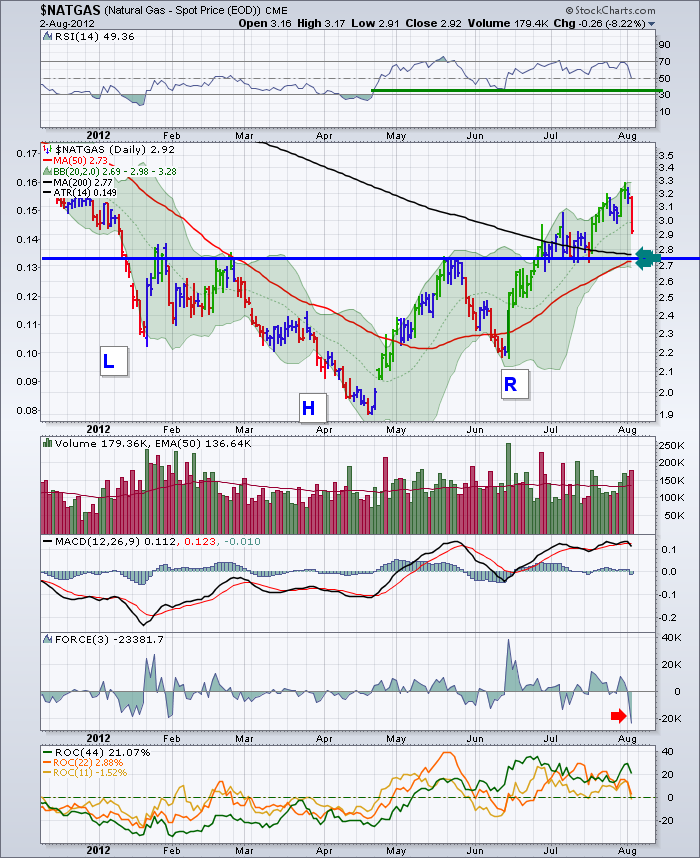
Well, $NATGAS is making some interesting moves. The key will be testing support at $2.75. A firm bounce off the level would be very bullish. We saw a major downdraft yesterday in $Natgas, but there are reasons to be bullish here... Read More