ChartWatchers February 22, 2015 at 02:22 PM
Hello Fellow ChartWatchers! The markets all moved higher this week with the Dow setting a new all-time high on Friday and the Nasdaq moving to within spitting distance of 5000. Since the start of 2015, the Nasdaq has been on a tear, gaining over 4.6%... Read More
ChartWatchers February 22, 2015 at 12:46 PM
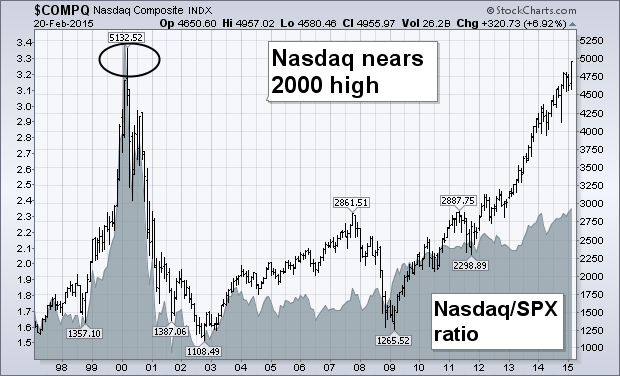
The monthly bars in the chart below shows the Nasdaq Composite ending the week just 177 points (3.5%) from its March 2000 intra-day high at 5132. [It's only 93 points (1.9%) from its 2000 closing high at 5048]... Read More
ChartWatchers February 21, 2015 at 03:17 PM
We've seen a very nice rally in U.S. equities during February, erasing all of January's losses with most of our major indices now breaking out to all-time highs... Read More
ChartWatchers February 21, 2015 at 10:40 AM
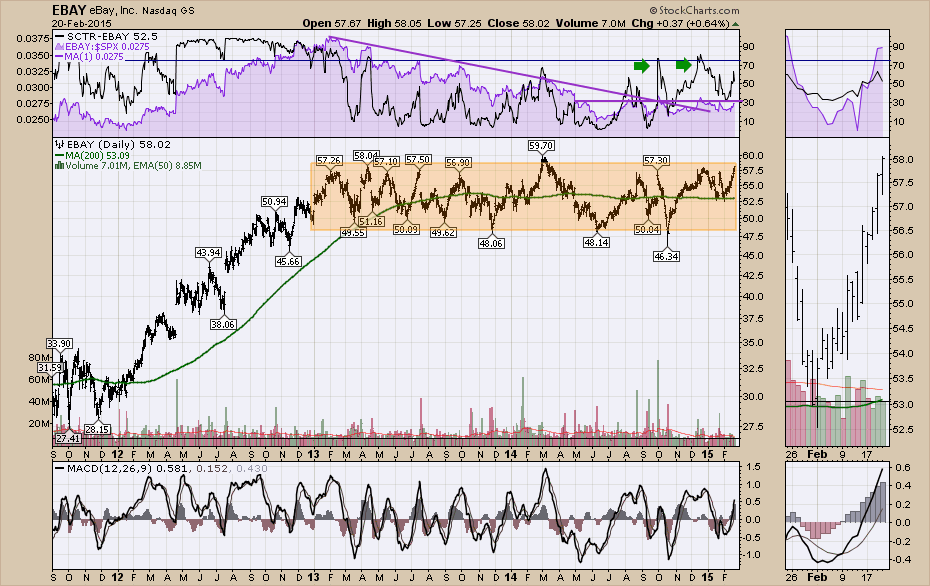
There is a relatively new song "Its all about the base" that jingles in my head every time I see these big broad trading ranges set up. Ebay is destined to be a classic technical analysis story when it breaks out from this consolidation... Read More
ChartWatchers February 21, 2015 at 03:40 AM
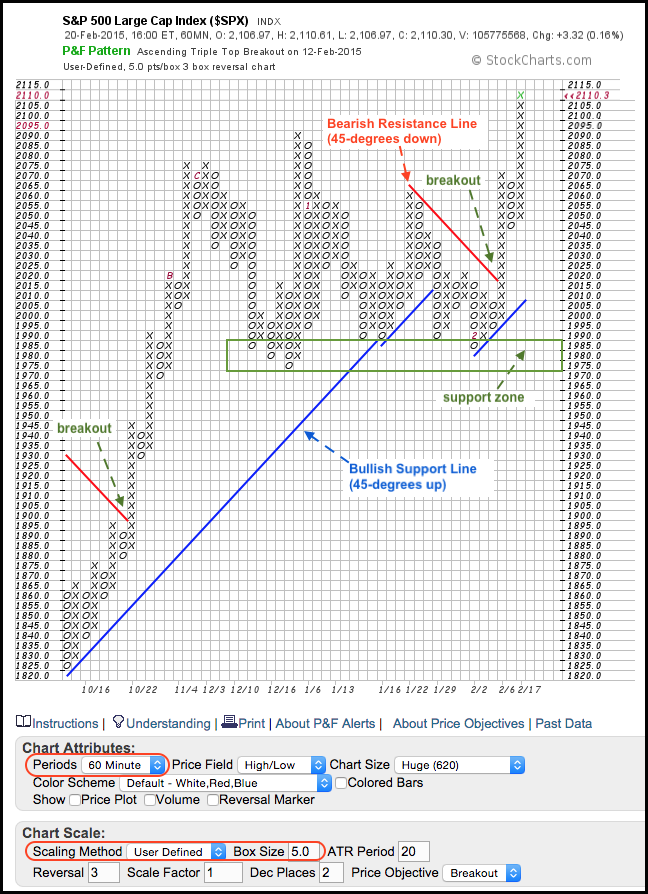
Chartists looking to filter small price movements and add a systematic touch to their analysis can turn to Point & Figure charts. Chart 1 shows a 60-minute P&F chart for the **S&P 500** and each box is five points... Read More
ChartWatchers February 20, 2015 at 08:30 PM
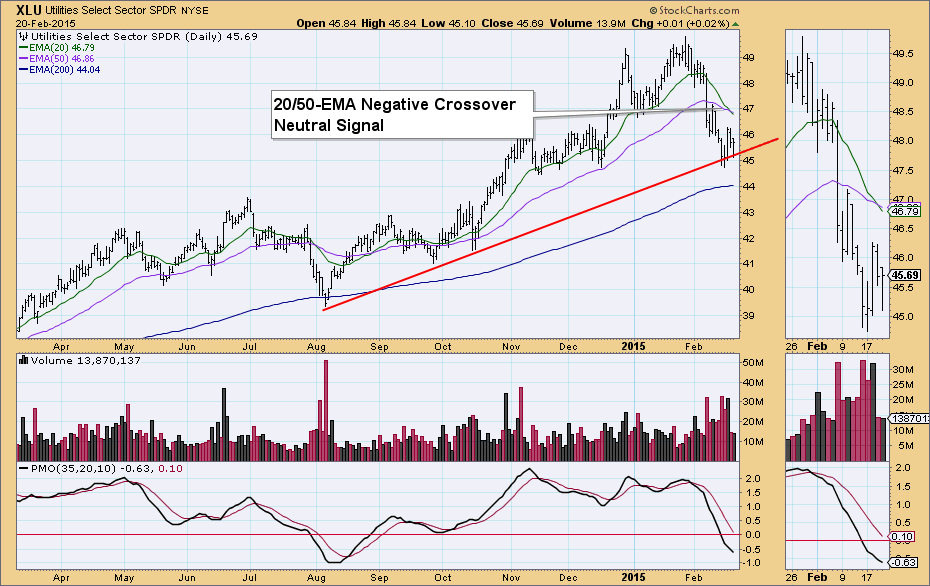
On Friday's DecisionPoint Alert Report, the Utilities SPDR (XLU) went on a Neutral signal. It's sister, the equal-weight Rydex version (RYU) remains on a BUY signal. It appears that it will flip next week to a Neutral signal as well... Read More
ChartWatchers February 07, 2015 at 11:54 PM

Hello Fellow ChartWatchers! Friday's jobs report threw things for a bit of a loop as the markets all moved lower on the final day of the week. But all-in-all it was a positive week for every major average with the DJIA leading the way up over 3.8%... Read More
ChartWatchers February 07, 2015 at 04:28 PM
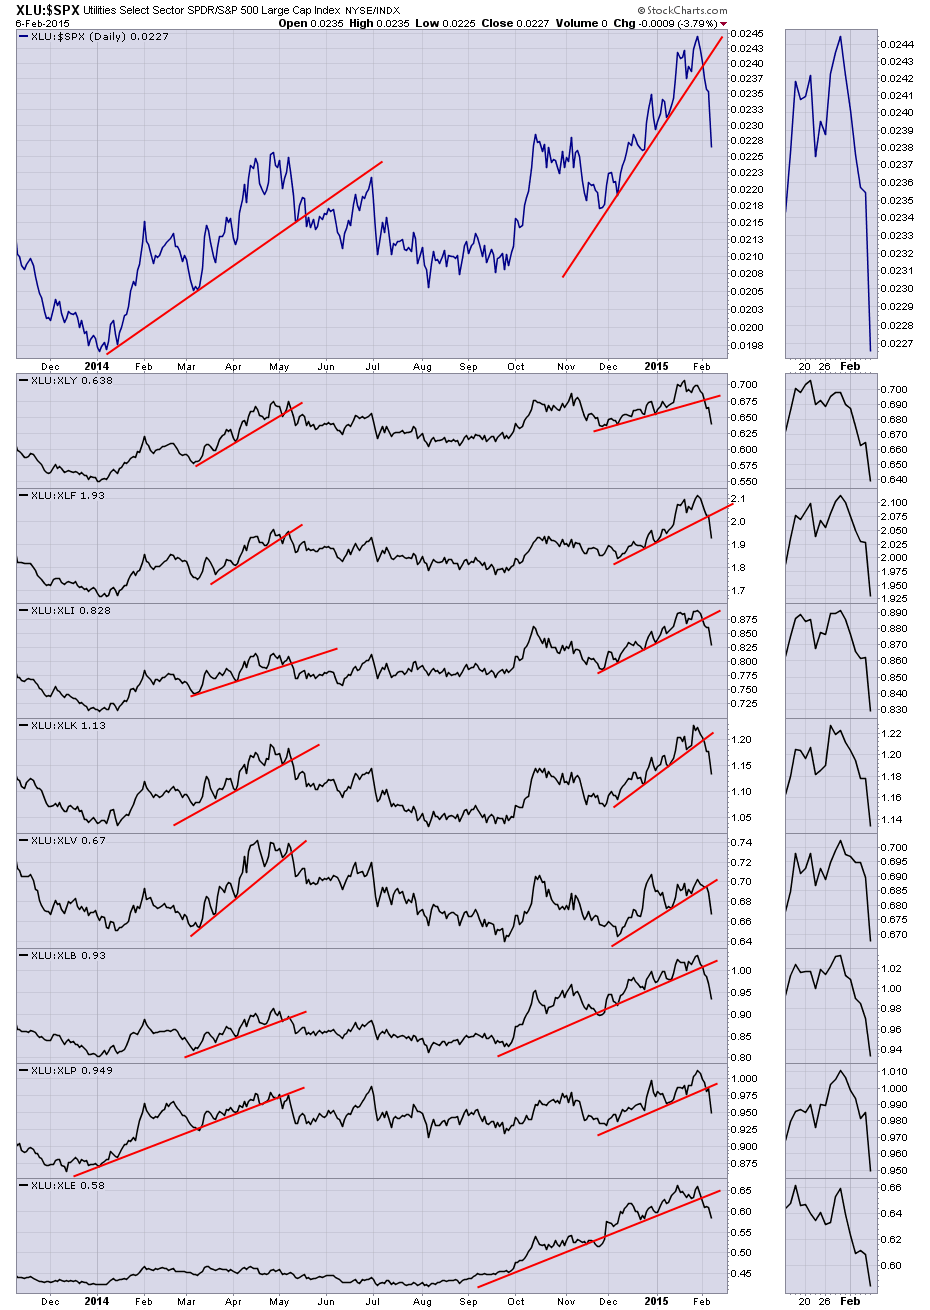
The Utility sector has had major changes in the relative performance this week. It wasn't just Friday as there appears to be another major event that changed the focus. First of all, let me describe the chart... Read More
ChartWatchers February 07, 2015 at 02:15 PM
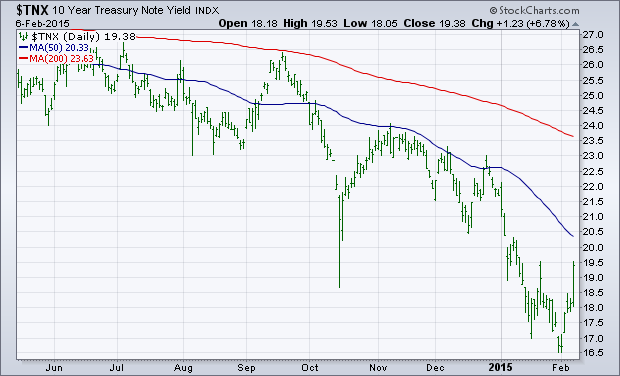
A strong jobs report on Friday pushed interest rates sharply higher all across the yield curve. The daily bars in Chart 1 show the 10-Year Treasury Note yield jumping to the highest close in a month. [Bond prices fell sharply as a result]. Short-term rates jumped even more... Read More
ChartWatchers February 07, 2015 at 02:11 PM
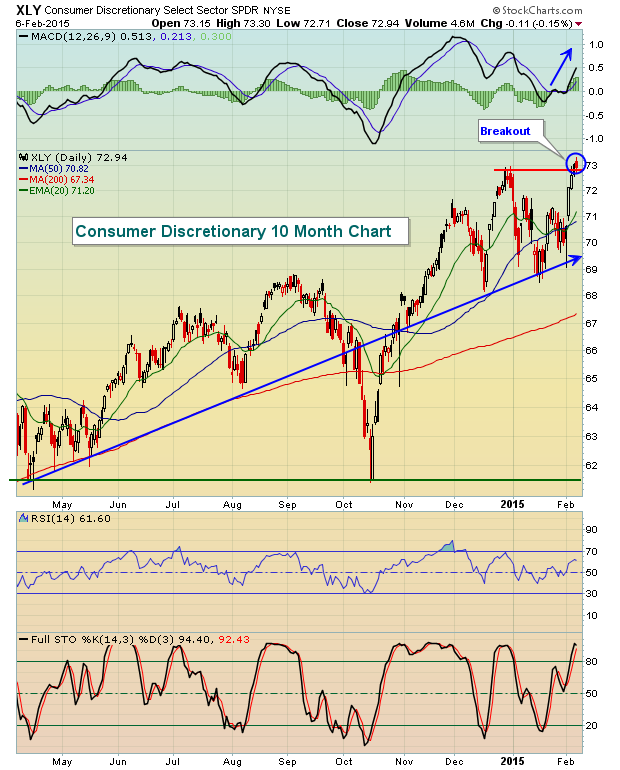
There's been much said and written about rapidly-declining crude oil prices ($WTIC). But one thing makes perfect sense to me. When American consumers save TONS of money when filling up at the pump, they tend to spend it elsewhere... Read More
ChartWatchers February 07, 2015 at 10:33 AM
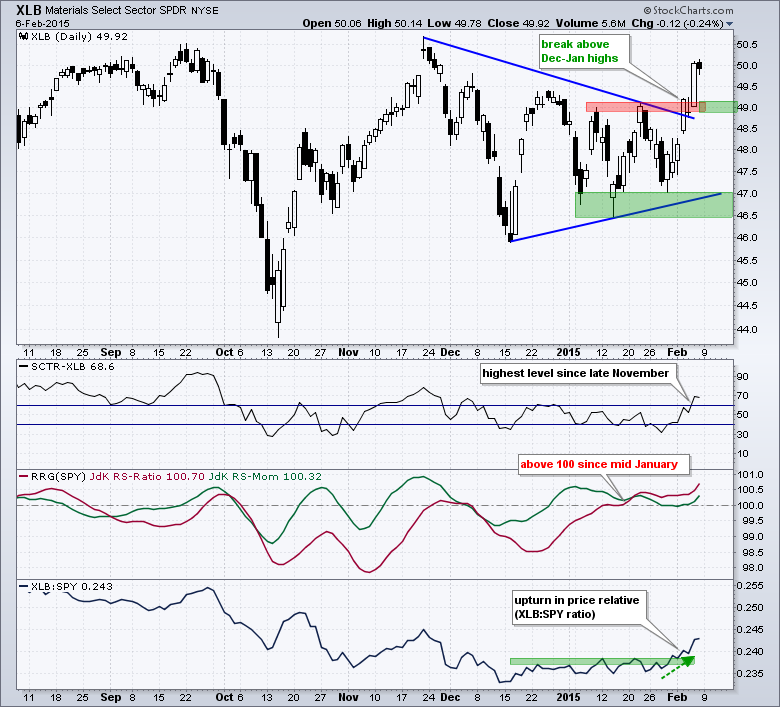
The Materials SPDR (XLB) sprang to life on the price chart and three relative strength indicators broke out. On the price chart, XLB surged in October-November and then consolidated in December-January with a big triangle... Read More