Don't Ignore This Chart! April 30, 2015 at 01:26 PM
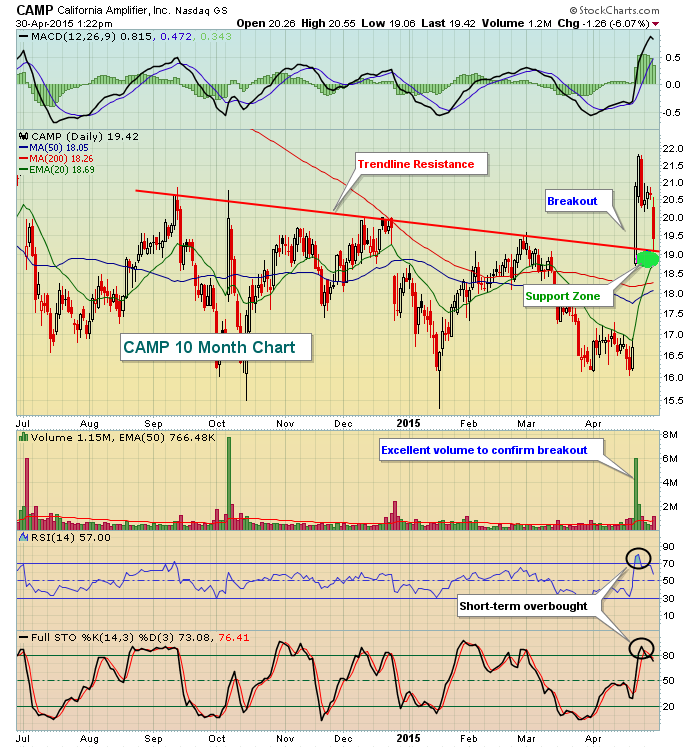
A little more than a week ago, CAMP broke trendline resistance after posting better than expected earnings results. CAMP's top line was $69.2 mil (actual) vs. $68.0 (estimate), while its bottom line also beat Wall Street estimates, $.29 vs. $.25... Read More
Don't Ignore This Chart! April 30, 2015 at 08:32 AM
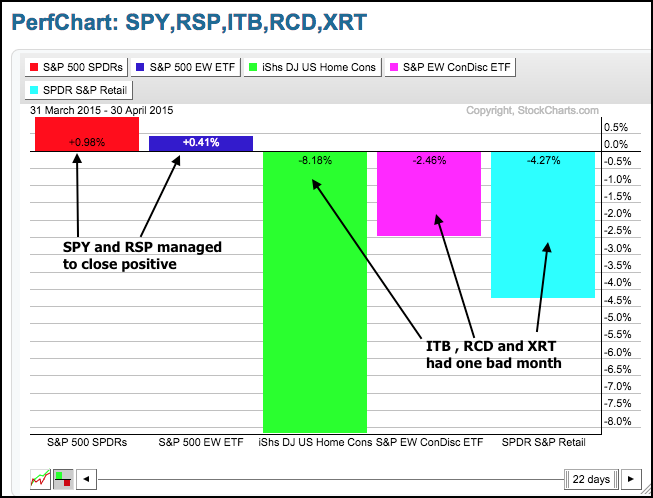
The S&P 500 remains in an uptrend and hit a new high on Monday, but some key groups are showing signs of selling pressure in April... Read More
Don't Ignore This Chart! April 28, 2015 at 09:40 AM
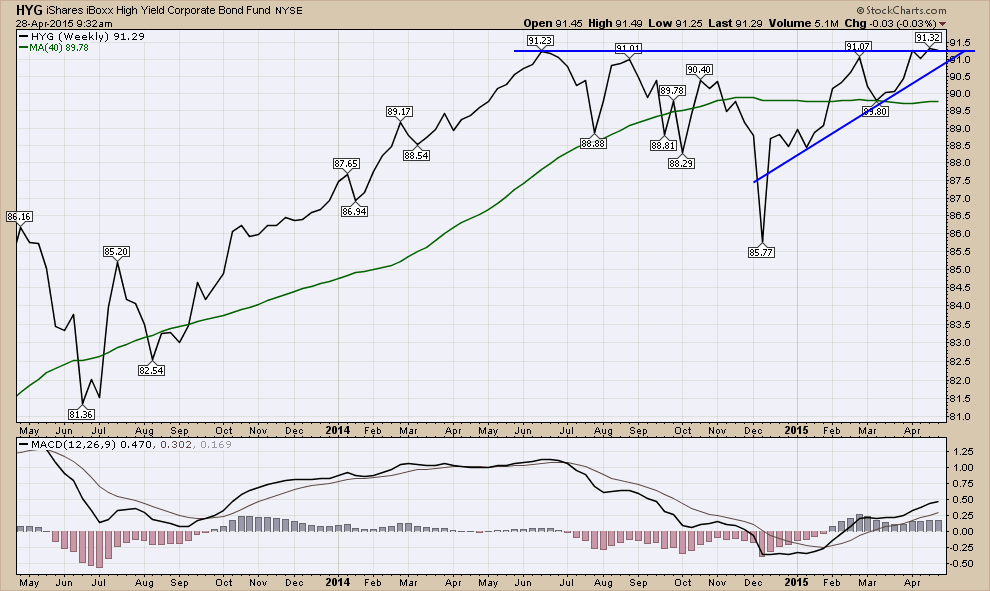
The High Yield Corporate Bonds ETF (HYG) has broken out above a 8 month consolidation. When the price is rising on a "High Yield" corporate bond fund, it is considered to be that investors are willing to accept more risk... Read More
Don't Ignore This Chart! April 27, 2015 at 10:02 AM
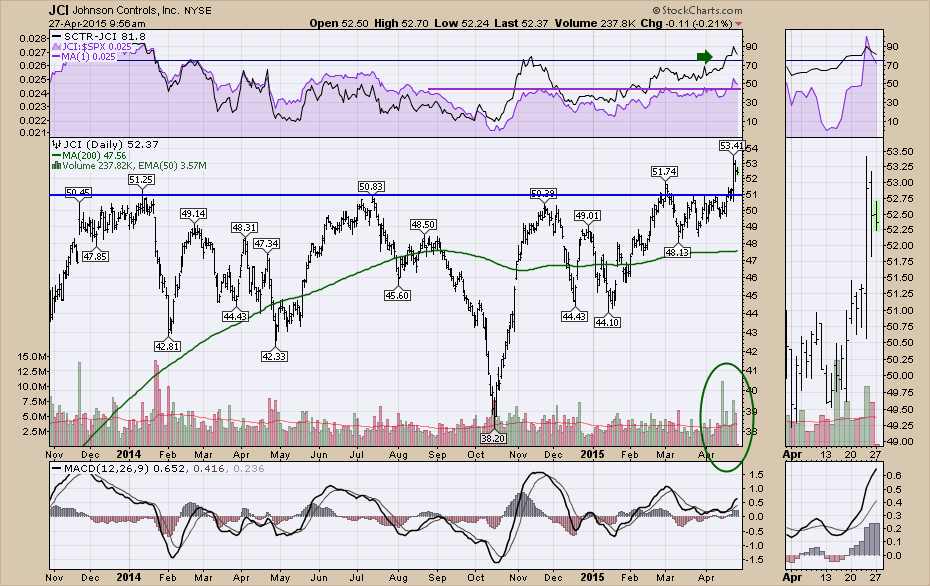
Johnson Controls reported earnings this morning but the chart was already breaking out to new highs last week. As part of the Cyclicals sector this is a very promising break out. This one year consolidation makes it very interesting... Read More
Don't Ignore This Chart! April 23, 2015 at 11:29 AM
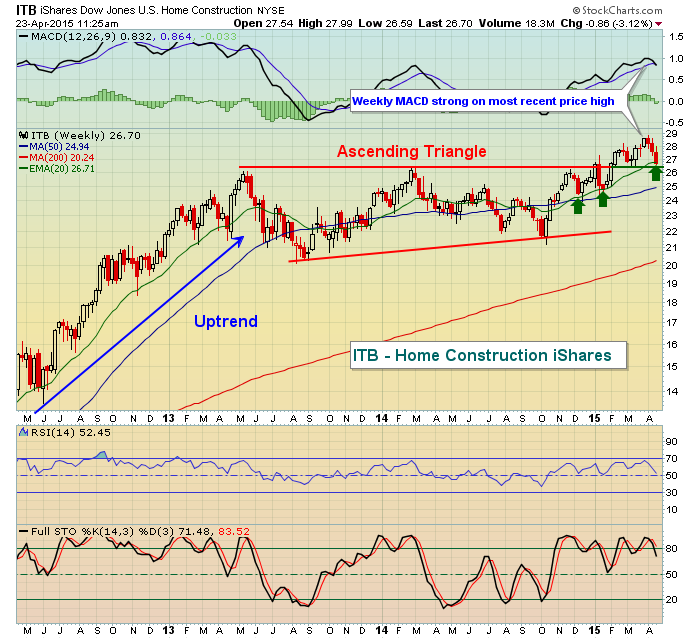
At 10am EST this morning, March new home sales were released and they fell well short of expectations... Read More
Don't Ignore This Chart! April 23, 2015 at 10:28 AM
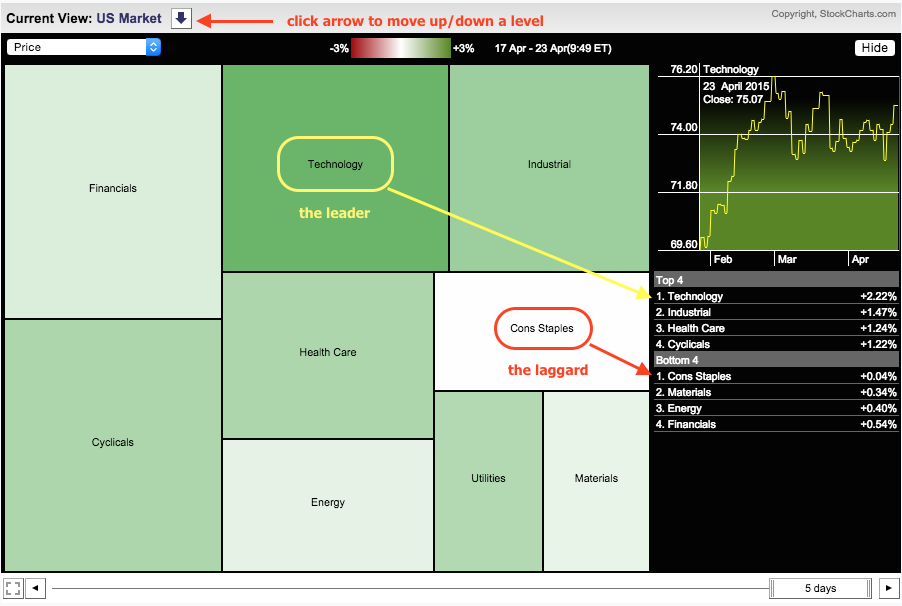
The image below shows the Sector MarketCarpet at "sector" level, which means we are seeing solid boxes for each of the nine sectors. There is a table on the left that ranks sector performance and this MarketCarpet shows performance for the current week (so far)... Read More
Don't Ignore This Chart! April 21, 2015 at 05:10 PM
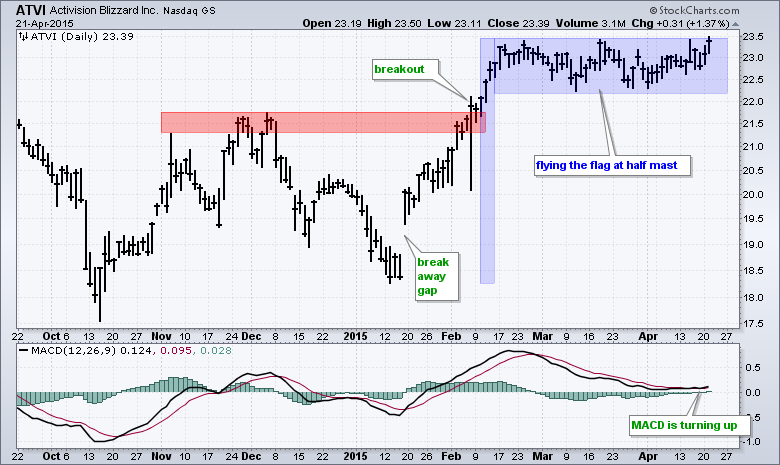
Activision Blizzard (ATVI) sports a bullish continuation pattern and improving momentum. The stock gapped up in mid January and broke out in early February. ATVI was overbought after a 25% surge and worked off these overbought conditions with an extended flag... Read More
Don't Ignore This Chart! April 20, 2015 at 03:39 PM
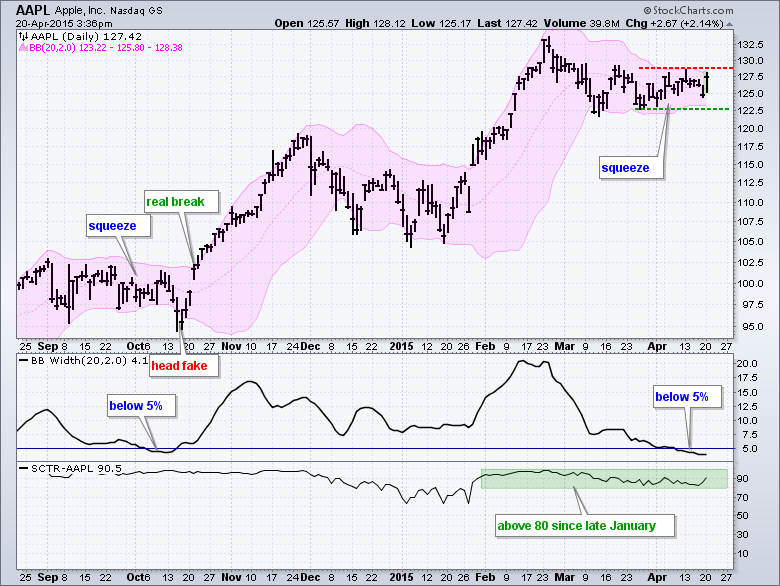
Trading in Apple has turned dull over the last six weeks as the stock moves in a tightening consolidation. The volatility contraction can be seen by the Bollinger Bands, which contracted to their narrowest since October. Notice that BandWidth moved below 5%... Read More
Don't Ignore This Chart! April 17, 2015 at 08:30 AM
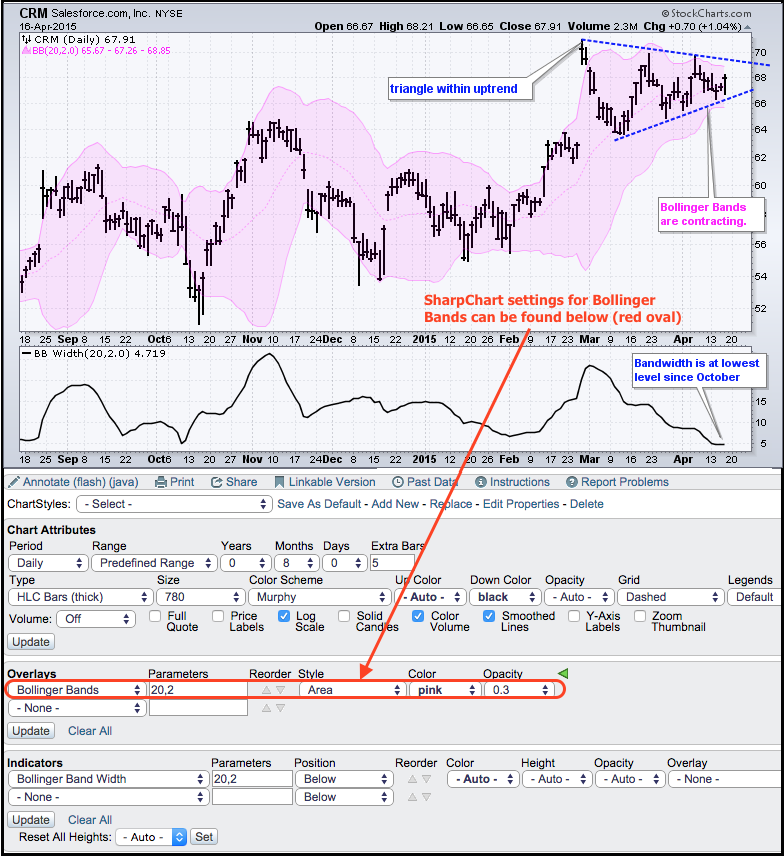
After surging to new highs in February, Salesforce.com moved into a consolidation as volatility contracted. Notice that the Bollinger Bands narrowed over the last few weeks the BandWidth moved to its lowest level since mid October... Read More
Don't Ignore This Chart! April 16, 2015 at 11:49 AM
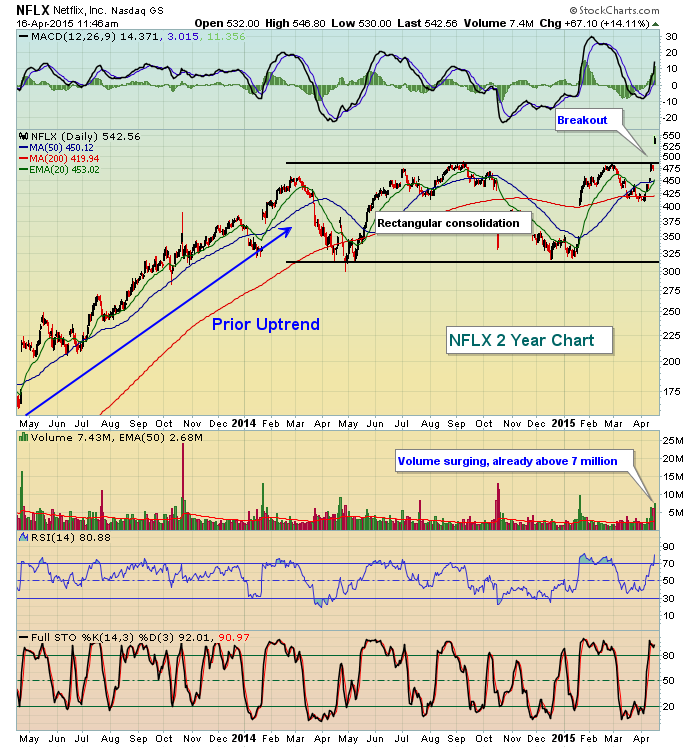
After the close on Wednesday, Netflix (NFLX) topped revenue and earnings expectations and promptly rose to all-time highs. NFLX had been consolidating in bullish sideways fashion for over one year following its prior uptrend... Read More
Don't Ignore This Chart! April 14, 2015 at 09:58 AM
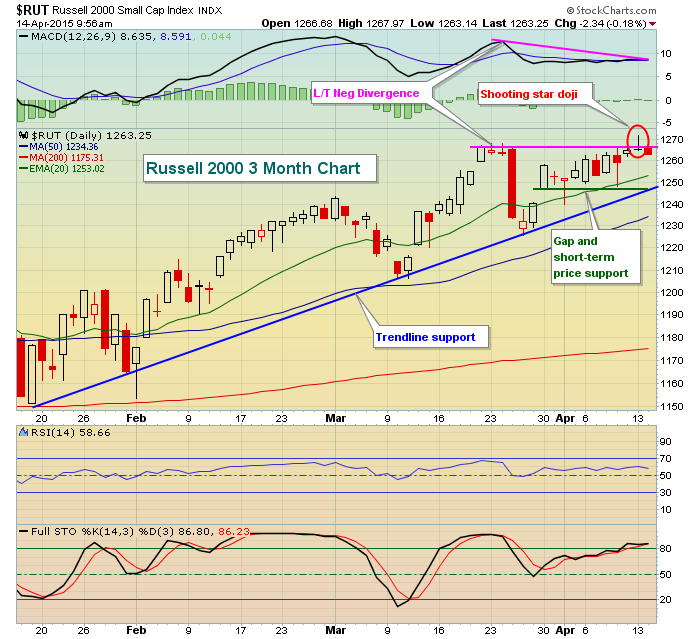
On Monday, the Russell 2000 ($RUT) was breaking out to an all-time high intraday. Unfortunately, it wasn't confirmed on the close as this benchmark of small cap stocks reversed late in the day... Read More
Don't Ignore This Chart! April 13, 2015 at 08:12 AM
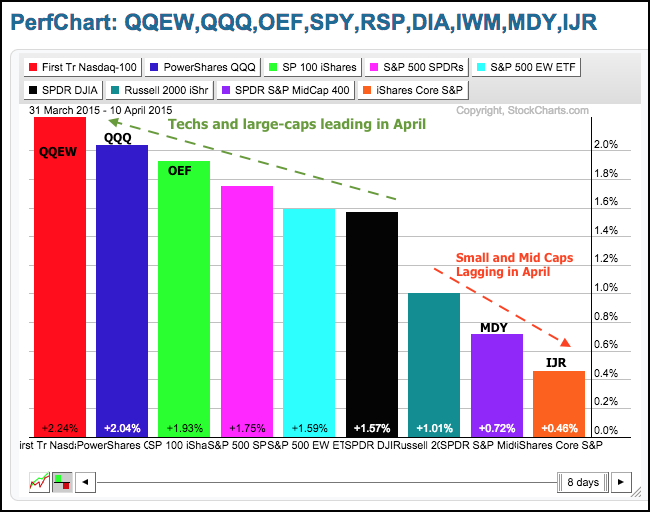
The performance pecking order changed in April as large-caps and techs moved from under performers to out performers. Even though small-caps and mid-caps are underperforming so far in April, they are still outperforming on a longer timeframe (since early February)... Read More
Don't Ignore This Chart! April 09, 2015 at 08:33 AM
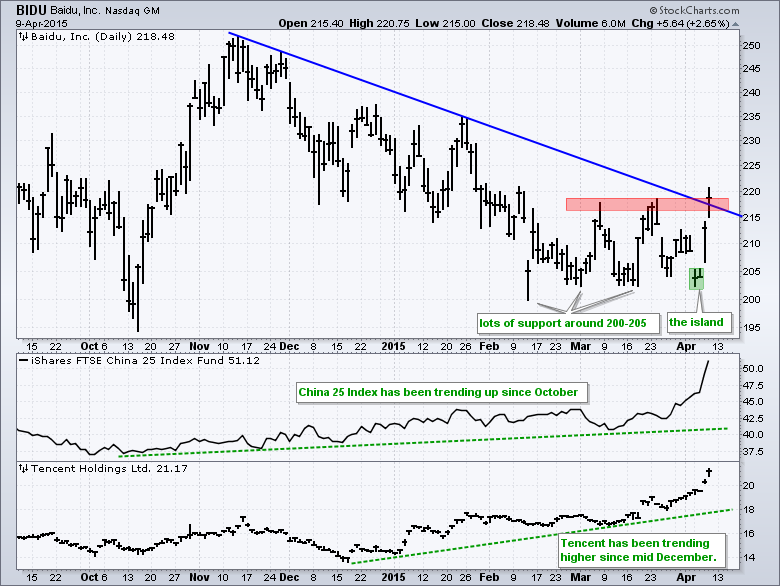
Julius de Kempenaer noted the surge in Chinese stocks in his most recent RRG post and Tom Bowley noted the breakout in SouFun in a blog post on Wednesday. I will add a third China-related post to the mix by pointing out Baidu... Read More
Don't Ignore This Chart! April 08, 2015 at 12:05 PM
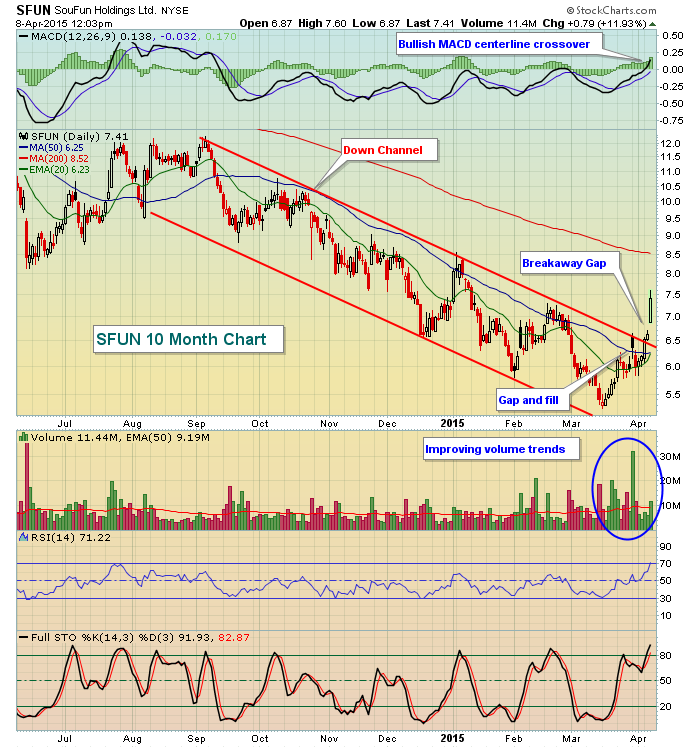
SFUN serves as a real estate internet portal in the Peoples Republic of China and is rallying strongly today on the heels of overall strength in most Chinese shares. Technically, the downtrend in SFUN has been reversed on a series of positive technical developments... Read More
Don't Ignore This Chart! April 07, 2015 at 12:09 PM
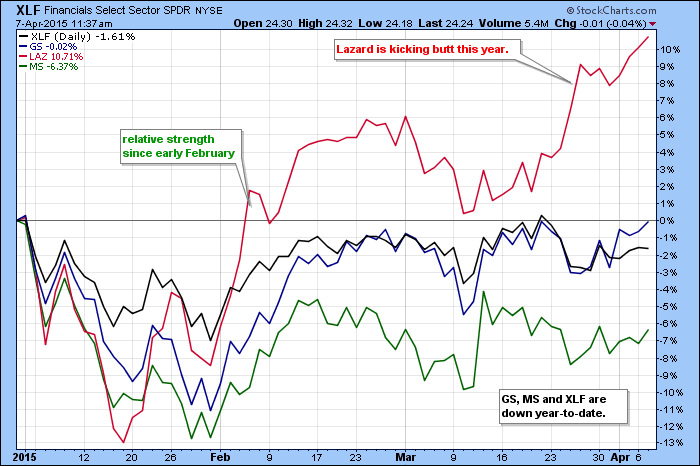
Lazard (LAZ) has left Goldman Sachs (GS) and Morgan Stanley (MS) in the dust by outperforming these two behemoths since early February. The SharpChart below shows year-to-date performance for these three stocks and the Finance SPDR (XLF)... Read More
Don't Ignore This Chart! April 06, 2015 at 11:17 AM
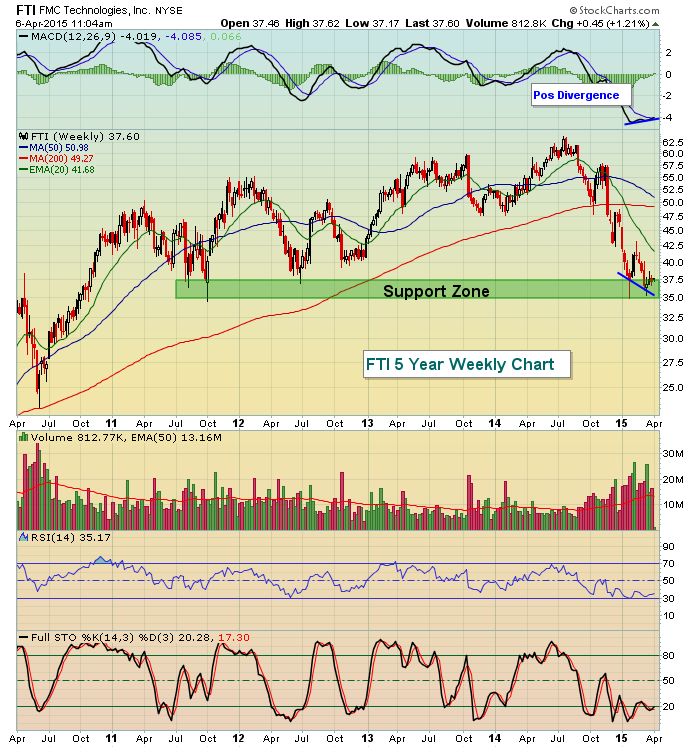
FMC Technologies (FTI) provides technology solutions for the energy sector. Much of the energy space has struggled for the last several months for a number of reasons, one of which has been the higher dollar... Read More
Don't Ignore This Chart! April 03, 2015 at 12:19 PM
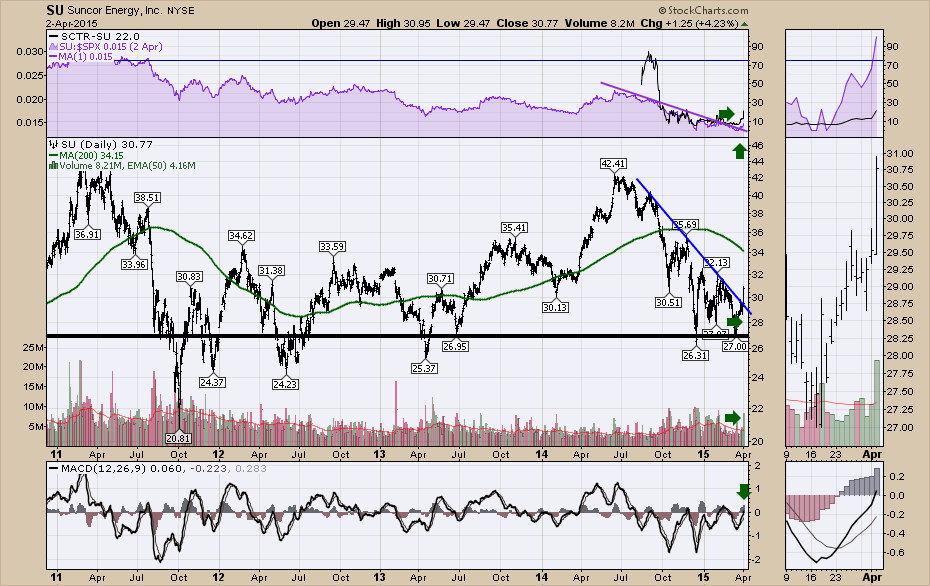
Suncor is Canada's largest energy company. It is an integrated oil company meaning it has both (Upstream) Exploration & Production as well as (Downstream) gasoline refining and marketing. Suncor markets the fuel through the Petro-Canada brand in Canada... Read More
Don't Ignore This Chart! April 03, 2015 at 06:18 AM
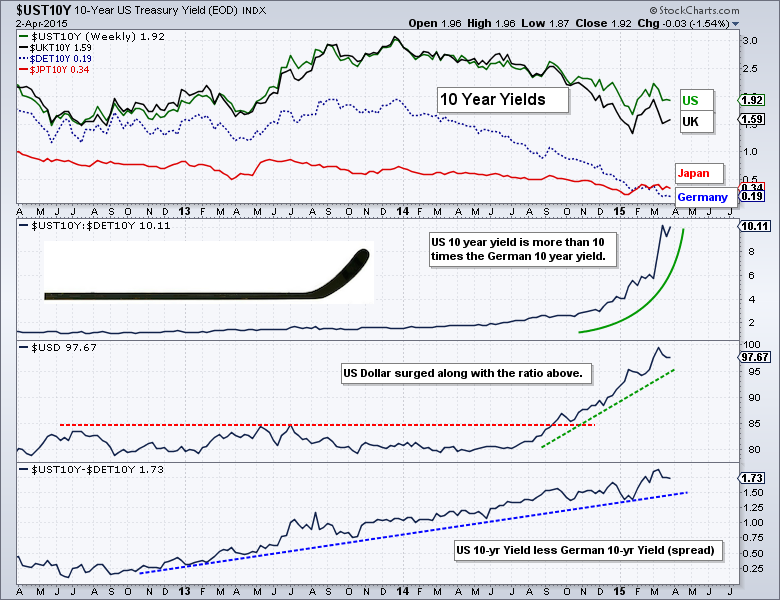
The Dollar Index has been on a tear the last four months as the spread between the 10-YR Treasury Yield ($UST10Y) and German 10-YR Bund Yield ($DET10Y) widened to historic levels. The chart below shows 10-yr yields for four countries in the top window... Read More
Don't Ignore This Chart! April 01, 2015 at 12:52 PM
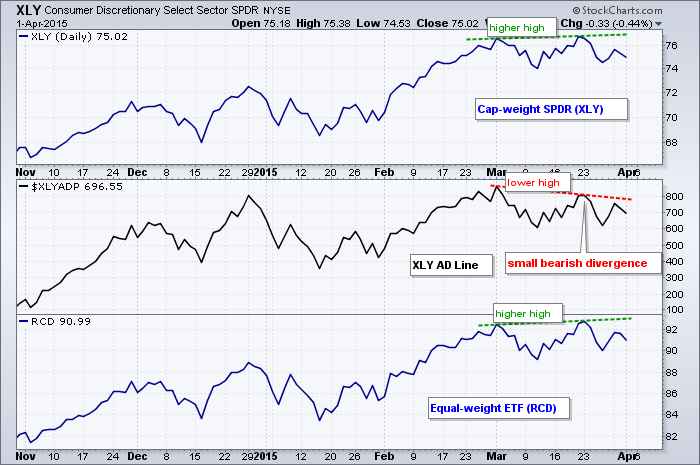
The Consumer Discretionary SPDR (XLY) is perhaps the single most important sector in the stock market because it is the most economically sensitive sector. Industry groups in this sector include retail, restaurants, autos, media and home construction... Read More