Art's Charts May 31, 2011 at 04:39 AM
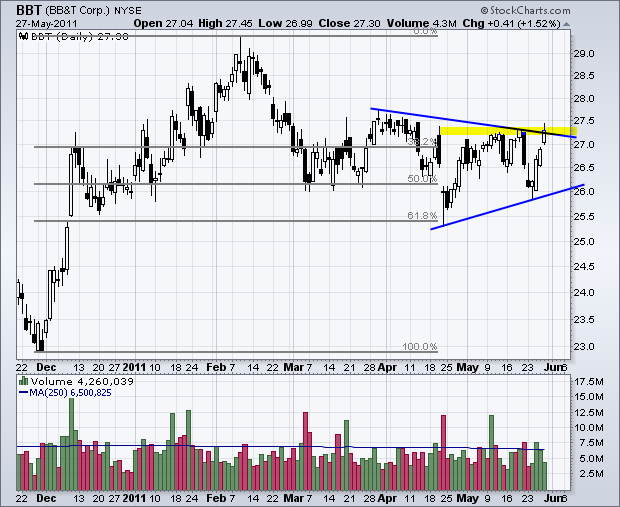
GOOG Hits Retracement Support. JBLU Forms Higher Low. NWSA Challenges Resistance with Ascending Triangle. Plus BBT, EXPD, LINTA, UAL. *********************************************** This commentary and charts-of-interest are designed to stimulate thinking... Read More
Art's Charts May 31, 2011 at 04:26 AM
With a three day bounce last week, the S&P 500 ETF (SPY) is poised to challenge the upper trendline of the falling flag/wedge. The ETF opened strong on Friday and then stalled the rest of the day to form a doji type candlestick denoting indecision... Read More
Art's Charts May 27, 2011 at 05:03 AM
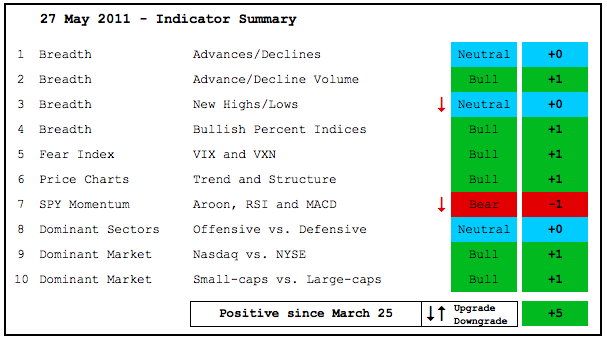
There are areas of weakness in the stock market, but the bulk of the evidence remains bullish. The Nasdaq AD Line broke below its April low, but the NYSE AD Line remains in a clear uptrend... Read More
Art's Charts May 27, 2011 at 03:29 AM
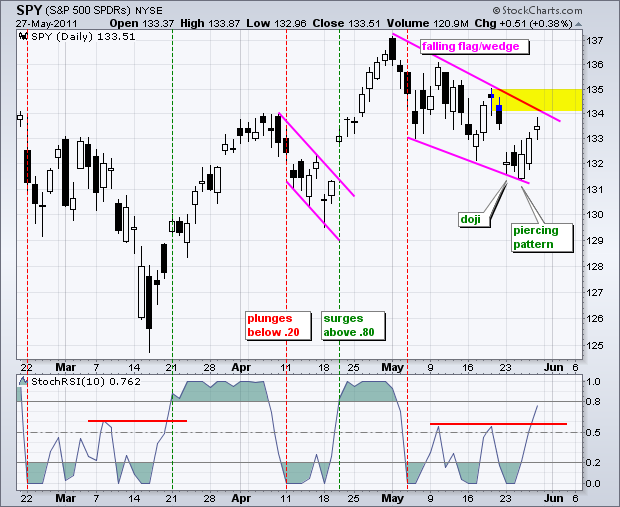
SPY followed through on the doji and piercing pattern with another modest gain on Thursday. The ETF closed up a mere .46%, but the white candlestick was once again rather long as SPY opened weak and closed fairly strong... Read More
Art's Charts May 26, 2011 at 04:57 AM
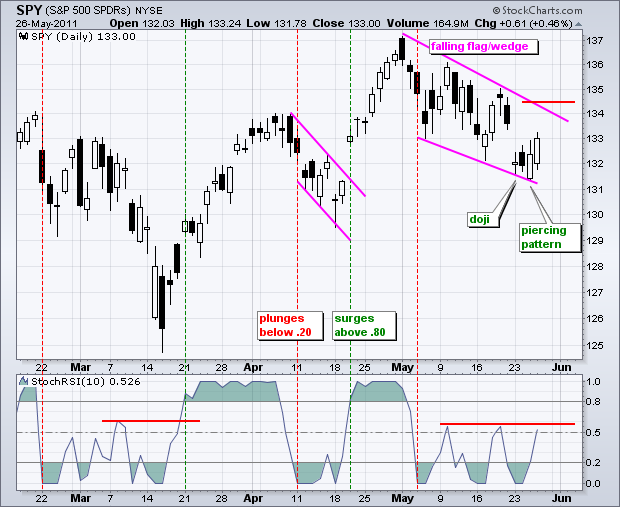
There is no real change on the charts as SPY continues to firm after Monday's gap down. The ETF formed a doji on Monday, which indicates indecision... Read More
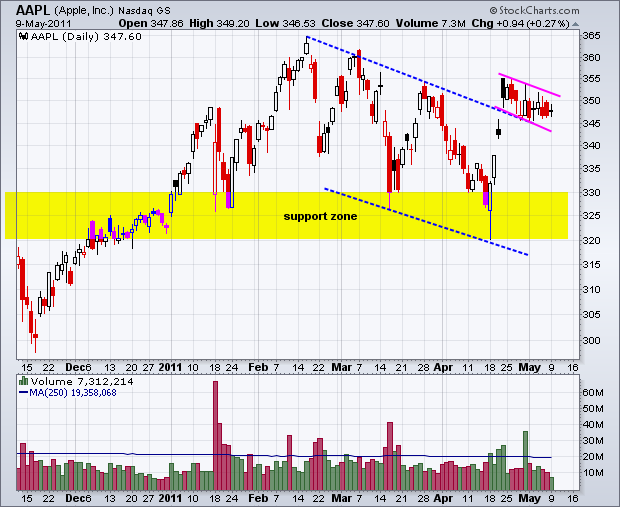
Art's Charts May 26, 2011 at 04:32 AM
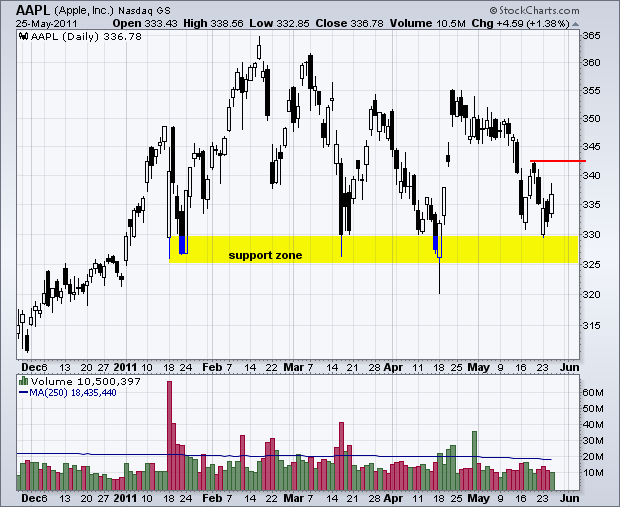
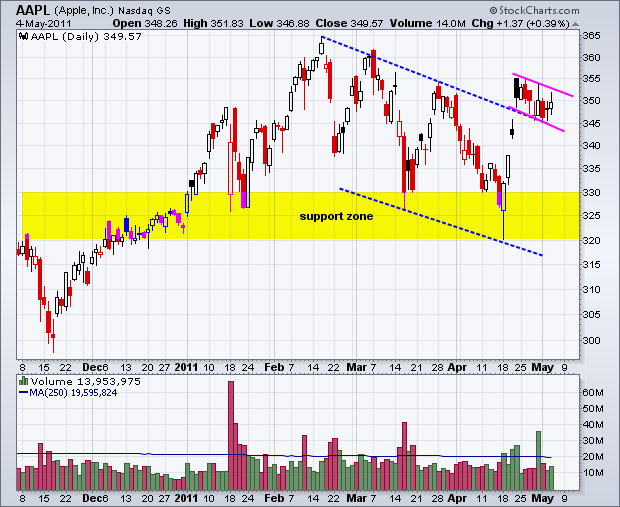
AAPL Hits Support Zone. APOL Breaks Support. SCMR Forms Large Bullish Engulfing. Plus APA,APC,CCI,DNR,EXP,IPG,PLCE,SCMR. *********************************************** This commentary and charts-of-interest are designed to stimulate thinking... Read More
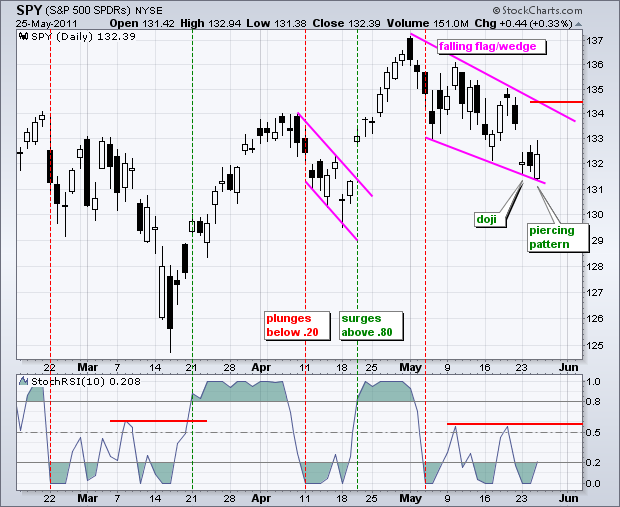
Art's Charts May 25, 2011 at 04:38 AM
After recording a fresh 52-week high four weeks ago, SPY declined in May and formed a falling flag or wedge. First, 52-week highs occur in uptrends, not downtrends. Second, SPY remains above the mid April reaction low and has yet to forge a lower low... Read More
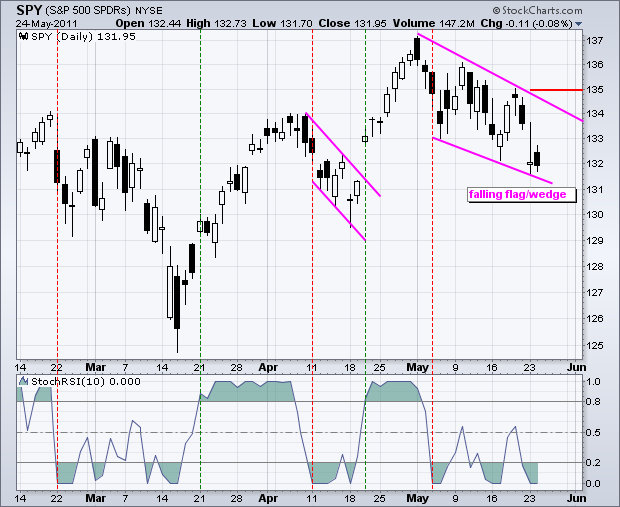
Art's Charts May 24, 2011 at 04:56 AM
With big gaps and sharp declines, the major index ETFs became oversold within short-term downtrends. This is a tricky situation because the medium-term trends (daily charts) remain up. The May decline, while sharp, is still viewed as a correction within a bigger uptrend... Read More
Art's Charts May 24, 2011 at 04:51 AM
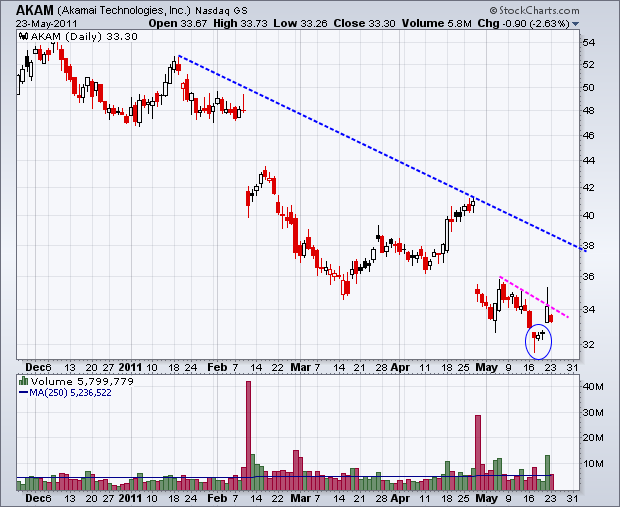
AKAM Forms Island Reversal. MON Bucks the Market with a Breakout. QCOM Consolidates above Breakout. Plus FLEX,PHM,SLB,TEVA,$TNX,USL,WNR. *********************************************** This commentary and charts-of-interest are designed to stimulate thinking... Read More
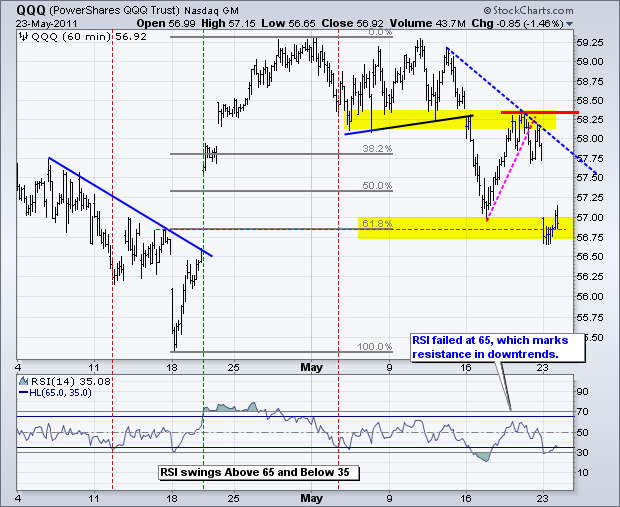
Art's Charts May 23, 2011 at 01:46 AM
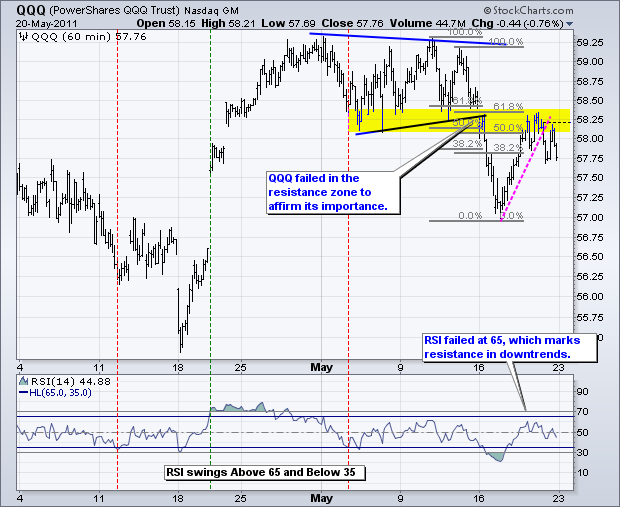
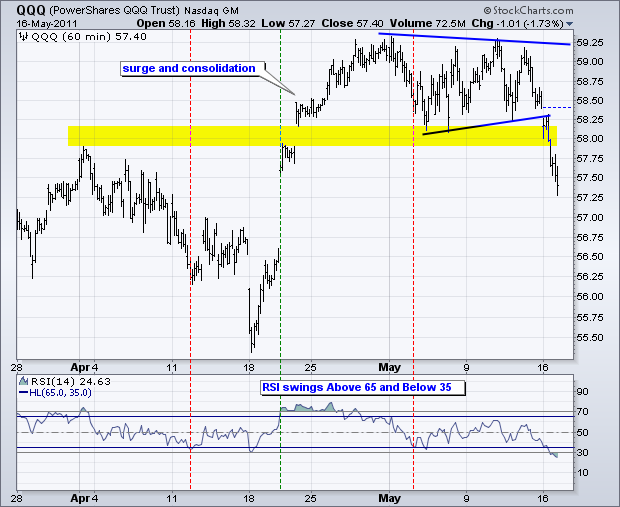
The Nasdaq 100 ETF (QQQ) broke support with a sharp decline and broken support turned into resistance over the last few days. After hitting resistance last Thursday, the ETF turned lower on Friday... Read More
Art's Charts May 20, 2011 at 06:58 AM
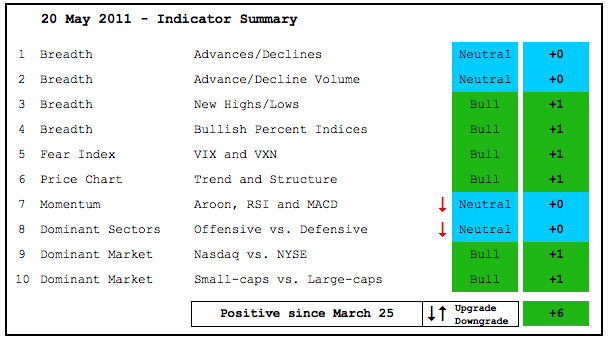
The indicator summary remains firmly positive, but downgrades in momentum and continued weakness in Nasdaq breadth are a concern. Even though SPY hit a 52-week high in April, RSI did not exceed 70 and failed to confirm strength... Read More
Art's Charts May 20, 2011 at 04:19 AM
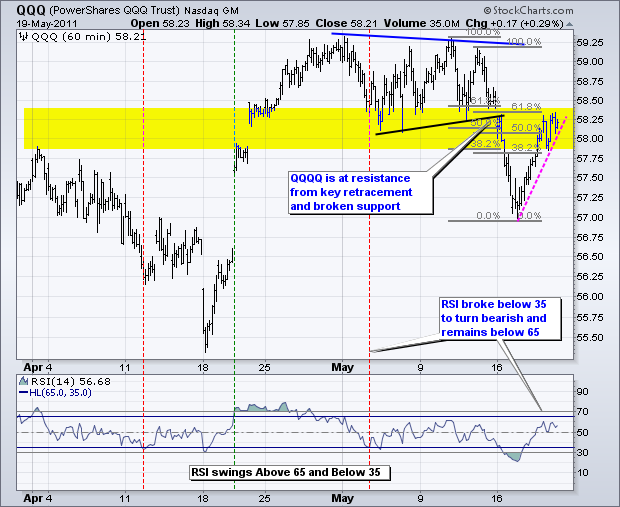
QQQ is at its make-or-break point for this oversold bounce. The ETF moved back into the broken support zone, which turns into resistance. There is also resistance in the 58.25 area from the 62% retracement cluster... Read More
Art's Charts May 19, 2011 at 01:33 AM
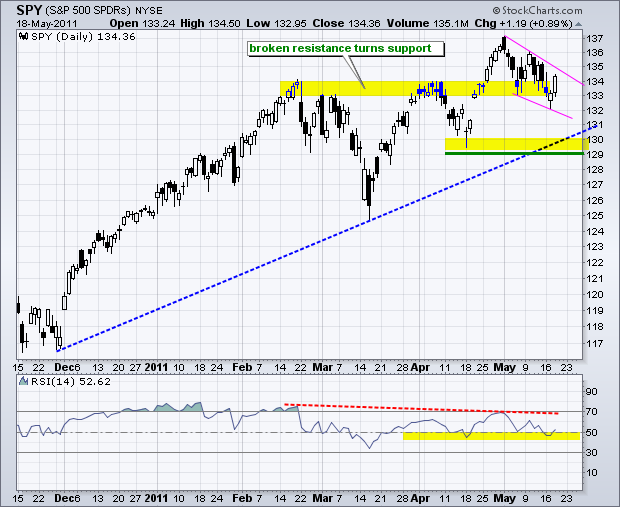
Looking the daily chart for SPY, I am struck by the fact that 14-day RSI did not reach overbought levels in late April or early May. The surge from the mid March low to the early May high was quite strong. SPY advanced over 8% in 6-7 weeks... Read More
Art's Charts May 19, 2011 at 01:31 AM
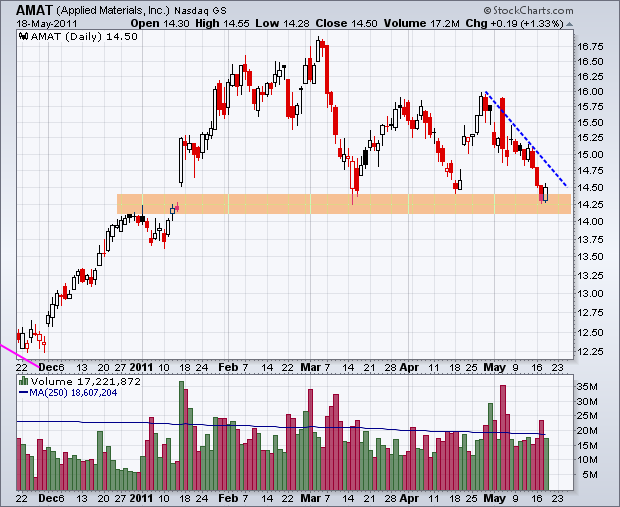
Charts of Interest: AMAT Tests Key Support Level. ETR Forms Flag After Gap. GOOG Forms Large Bullish Engulfing. Plus PMCS, TKC and UBS. *********************************************** This commentary and charts-of-interest are designed to stimulate thinking... Read More
Art's Charts May 18, 2011 at 05:45 AM
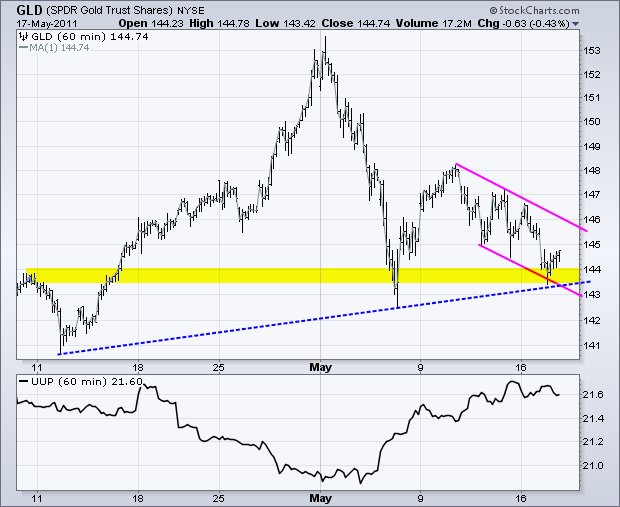
The Gold SPDR (GLD) is at support and looks ripe for an oversold bounce. The mid April trendline, broken resistance and the early May spike low mark support in the 144 area. A falling channel defines the short-term downtrend... Read More
Art's Charts May 17, 2011 at 03:52 AM
Most of the action on Monday took place outside of the S&P 500 ETF (SPY). In particular, the Nasdaq 100 ETF (QQQ) broke support with a sharp decline led by large-cap tech stocks. Apple (AAPL) and Google were down over 2% and Amazon (AMZN) was down almost 5%... Read More
Art's Charts May 17, 2011 at 03:47 AM
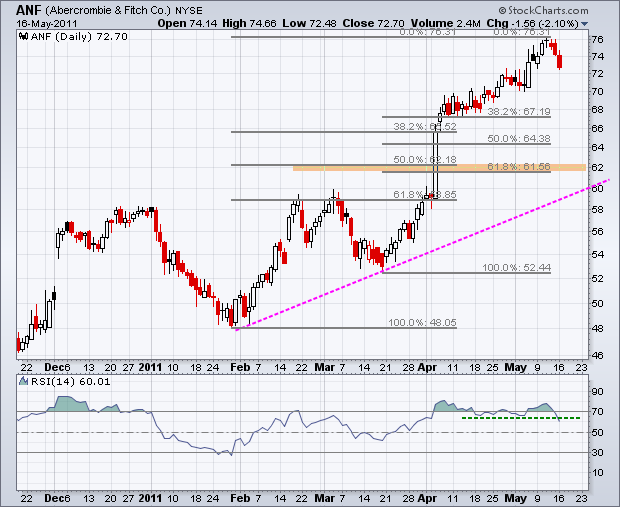
FAST Forms Tight Triangle. HD Nears Support Zone. STT Stalls at Key Retracement. Plus ANF, MAS, SBUX This commentary and charts-of-interest are designed to stimulate thinking... Read More
Art's Charts May 15, 2011 at 09:47 AM
Today we will just go straight to the 60-minute charts to review the current consolidations in the Nasdaq 100 ETF (QQQ), Russell 2000 ETF (IWM) and S&P 500 ETF (SPY). Stocks became overbought after surging from mid April to early May... Read More
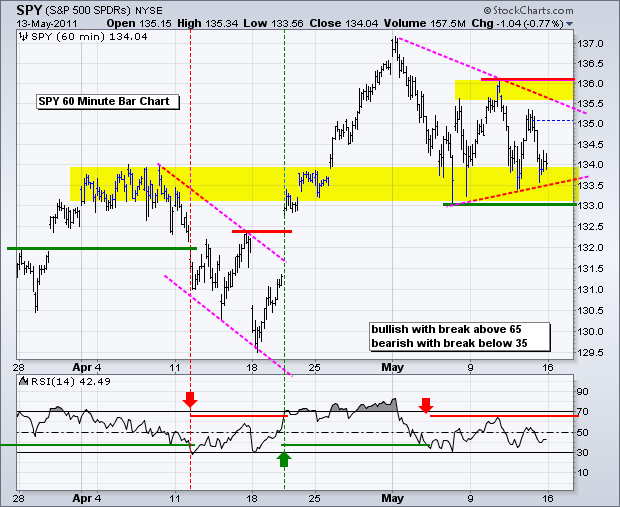
Art's Charts May 13, 2011 at 01:19 AM

Some signs of weakness are creeping into the market, but the bulk of the evidence remains bullish at this point. The major index ETFs recorded 52-week highs in April, the NYSE AD Line hit a 52-week high this week and the Nasdaq AD Volume Line is challenging its February high... Read More
Art's Charts May 12, 2011 at 11:02 AM
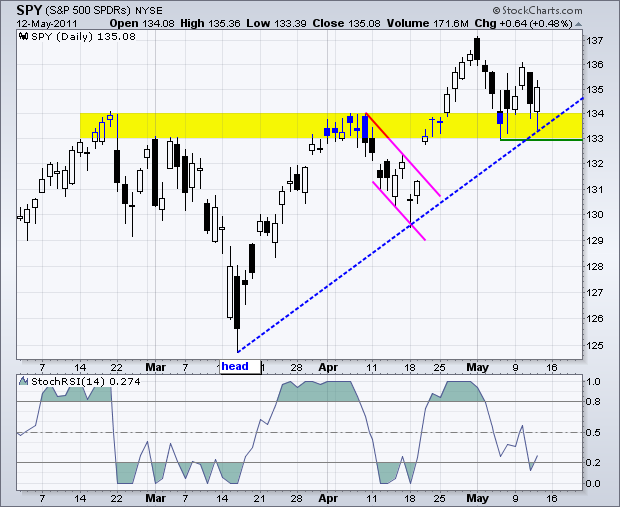
There is no change on the daily chart, which remains in an uptrend overall. SPY broke a resistance zone and this zone turned into a short-term support zone. So far, the support zone is holding as the ETF bounced off the 133-134 area twice in the last two weeks... Read More
Art's Charts May 11, 2011 at 10:43 AM
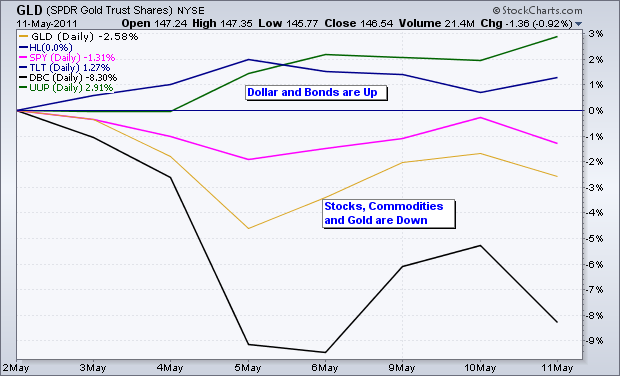
Stocks are moving in sync with the Euro and commodities, both of which have been falling this month. The Euro is under pressure with concerns over Greek debt. Oil is under pressure because the Dollar is rising and stocks have weakened this month... Read More
Art's Charts May 11, 2011 at 10:35 AM
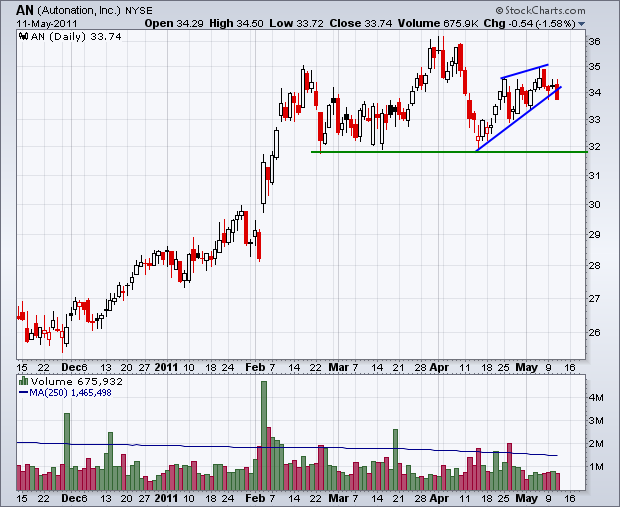
AN Breaks Wedge Support. JPM Breaks Pennant Support. RTN Consolidates after Support Break. Plus CVX, GE,LEN, LMT, TIF See ChartSchool article on Aroon for more details... Read More
Art's Charts May 11, 2011 at 07:00 AM
There is no change on the daily chart as SPY affirmed support at 133 with a bounce over the last few days. On the 60-minute chart, SPY pulled back rather sharply after the breakout surge last week, but ultimately held support and moved above 135.5 today... Read More
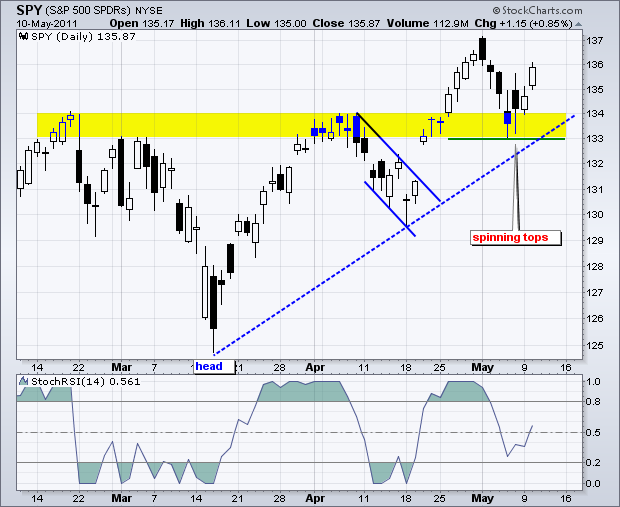
Art's Charts May 10, 2011 at 07:00 AM
There is no real change on the daily chart as SPY continues to firm at broken resistance, which turns into support. The ETF formed two spinning tops on Thursday-Friday and a small white candlestick on Monday. The bounce was rather feeble, but support is holding nonetheless... Read More
Art's Charts May 10, 2011 at 07:00 AM
ADBE Breaks Wedge Trendline. CPWR Consolidates after Gap. FISV Forms Pennant after Sharp Decline. AAPL, AMKR, FISV, JBL, SSP, SYK, TIN *********************************************** This commentary and charts-of-interest are designed to stimulate thinking... Read More
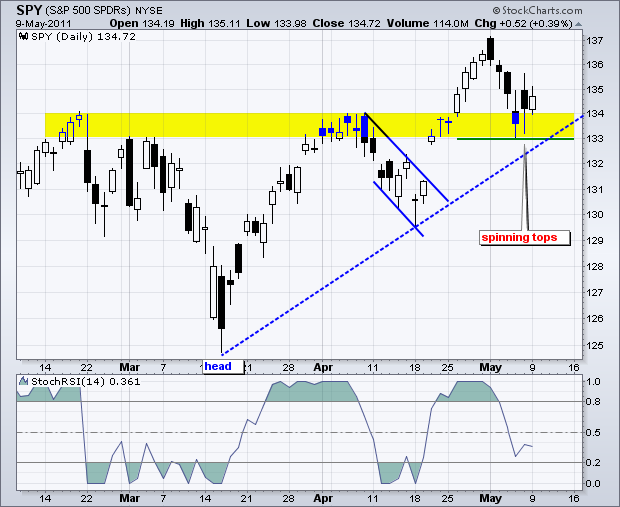
Art's Charts May 09, 2011 at 07:00 AM
SPY declined to support and firmed with two spinning tops at the end of the week. These candlesticks have relatively long shadows with a small body. The shadows represent the high and low, while the body represents the open and close... Read More
Art's Charts May 07, 2011 at 10:08 AM
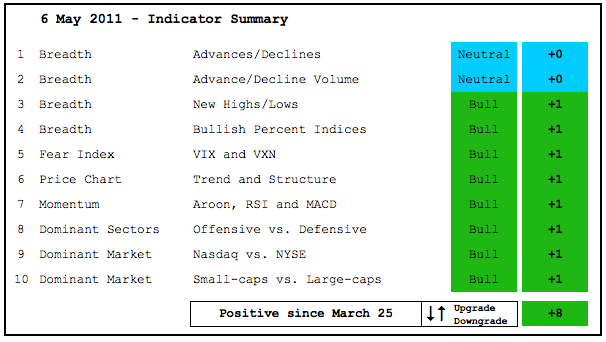
The bulk of the evidence remains bullish, but there are signs of dissent brewing out there. The bulls control the trends as the major index ETFs hit new highs in April. The AD Volume Lines are also strong and the Net New Highs Lines have yet to break down... Read More
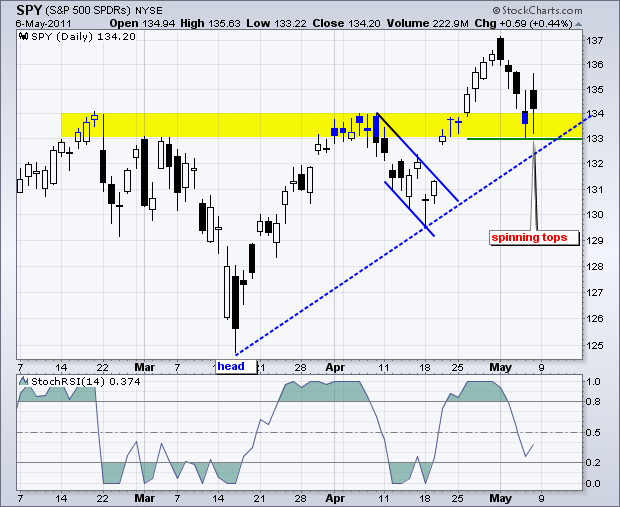
Art's Charts May 06, 2011 at 12:00 PM
Admittedly, the decline over the last four days has been sharper than expected for a mere pullback. This decline started right after Monday's gap open around 137. On a high to low basis, the ETF moved from 137 to 133 in just four days (almost 3%). And now for the big test... Read More
Art's Charts May 06, 2011 at 12:00 PM
I will wait for Friday's reaction to the employment report before updating the indicator summary... Read More
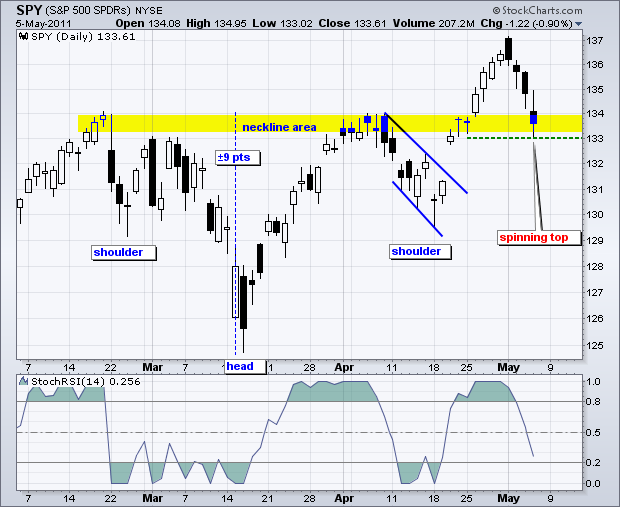
Art's Charts May 05, 2011 at 04:36 AM
SPY continued its throwback with a close below 135 and the third down day in a row. This does nothing to change the medium-term trend, which remains up. The gap and flag breakout started it all and the inverse head-and-shoulders breakout forged a new 52-week high... Read More
Art's Charts May 05, 2011 at 04:33 AM
AAPL Forms Bull Flag after Breakout. KLAC Firms at Fibonacci Retracement. CSCO Traces out Pennant Consolidation. Plus F, FFIV,MSFT,NTAP. *********************************************** This commentary and charts-of-interest are designed to stimulate thinking... Read More
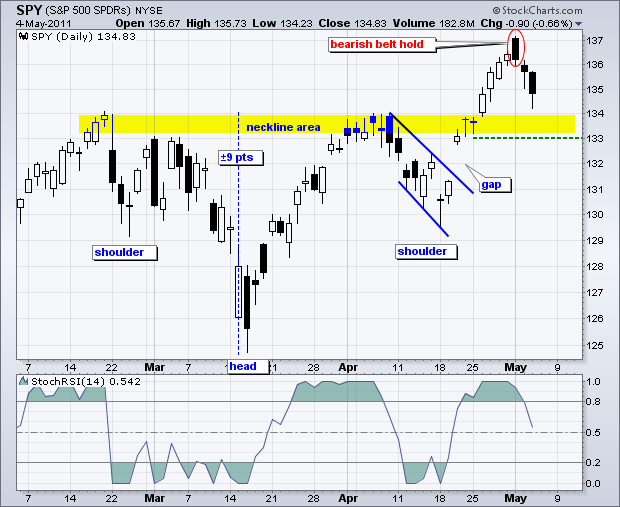
Art's Charts May 04, 2011 at 03:44 AM
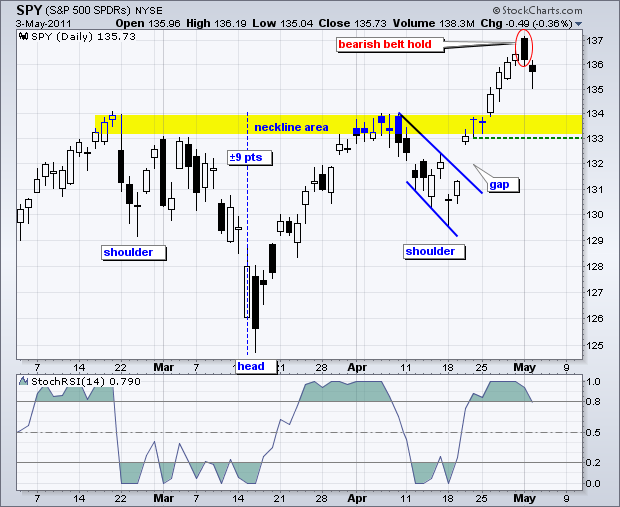
SPY followed through on Monday's bearish Belt Hold candlestick with a decline on Tuesday. The ETF dipped all the way to 135, but a late afternoon bounce pushed it back to 135.73 by the close. The decline to 135 was not a very deep dip – yet buyers took advantage... Read More
Art's Charts May 03, 2011 at 03:52 AM
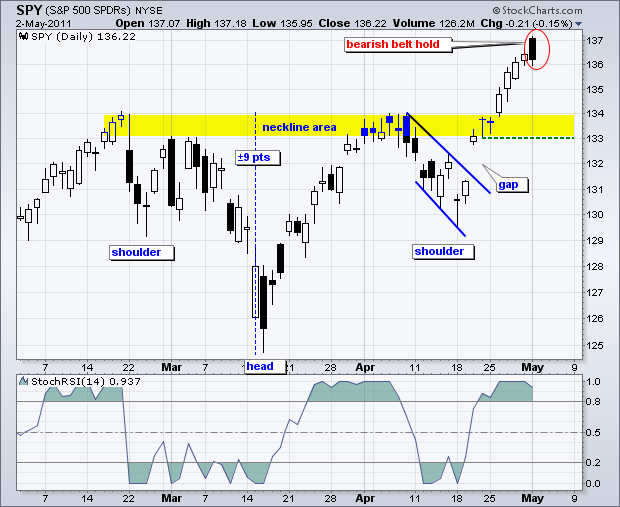
Despite a strong open and weak close on Monday, the overall picture for SPY remains unchanged. A bearish Belt Hold formed on Monday. These are long black candlesticks that form after an advance... Read More
Art's Charts May 03, 2011 at 03:50 AM
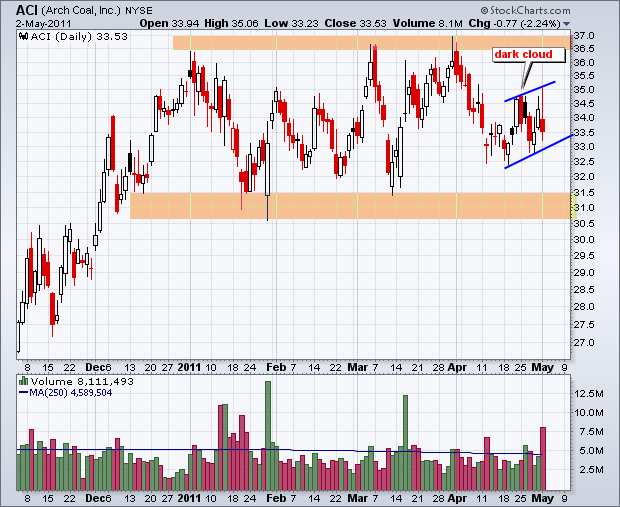
ACI Forms Bear Wedge. CAKE Gaps Down from Resistance. GCI Breaks Flag Resistance. Plus BSX,LEN and NFLX. ----------------------------------------------------------------------------- This commentary and charts-of-interest are designed to stimulate thinking... Read More
Art's Charts May 02, 2011 at 02:53 AM
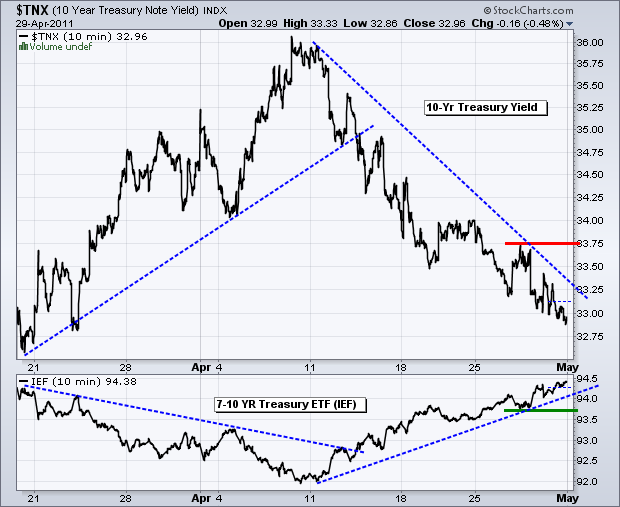
It is a strange pairing, but stocks and bonds are both in strong uptrends. We can also throw in strong uptrends for gold, oil and the Euro. The Dollar is the one left out in the cold with a strong downtrend. The rally in bonds is a bit perplexing... Read More