Art's Charts August 30, 2016 at 09:06 AM
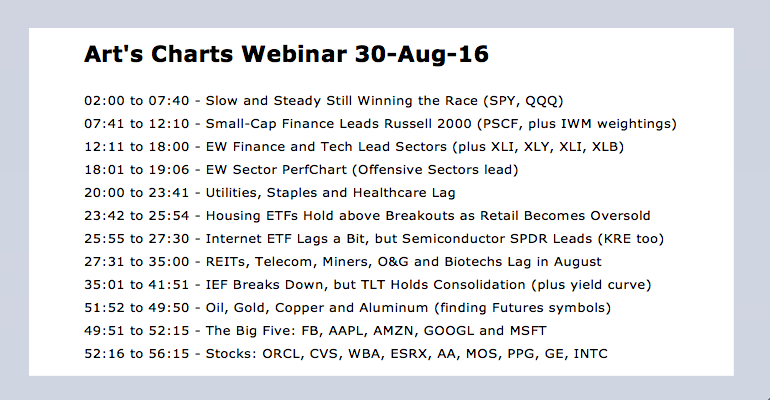
Webinar Recording ---- Webinar ChartList SPY and MDY are Barely Positive this Month // RSI(5) and the Dreaded Double Dip // The Noose Continues to Tighten for Treasuries // How Yields Effect Gold, Utilities and Finance // US 10-yr Yields Sticks Out // XLF and KRE Maintain Breakou... Read More
Art's Charts August 25, 2016 at 08:51 AM
SPY and MDY are Barely Positive this Month // RSI(5) and the Dreaded Double Dip // The Noose Continues to Tighten for Treasuries // How Yields Effect Gold, Utilities and Finance // US 10-yr Yields Sticks Out // XLF and KRE Maintain Breakouts // XLU and IYR Forge Bullish Setups //... Read More
Art's Charts August 23, 2016 at 09:13 AM
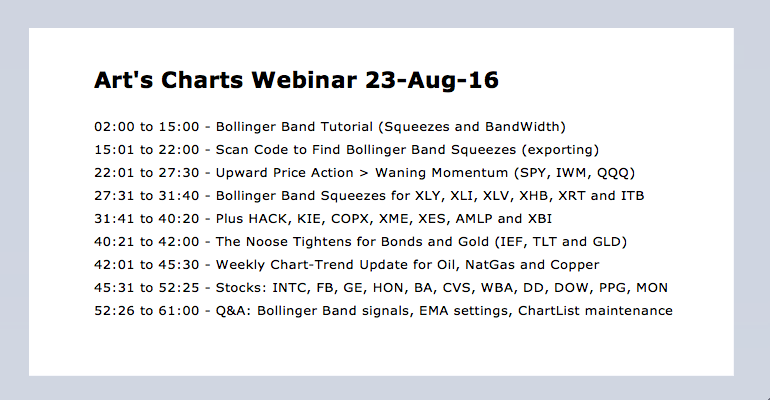
Click here for the webinar video recording The Song Remains the Same for SPY // Upward Price Action > Waning Momentum // IWM Continues to Lead // Bollinger Band Squeezes for KRE and XLF // Beware of the Head Fake // Adding a Trend Condition // Scanning for Bollinger Band Squeezes... Read More
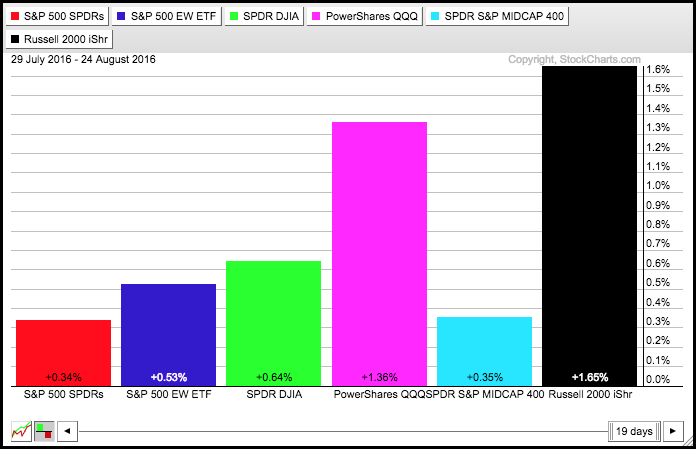
Art's Charts August 19, 2016 at 12:46 PM
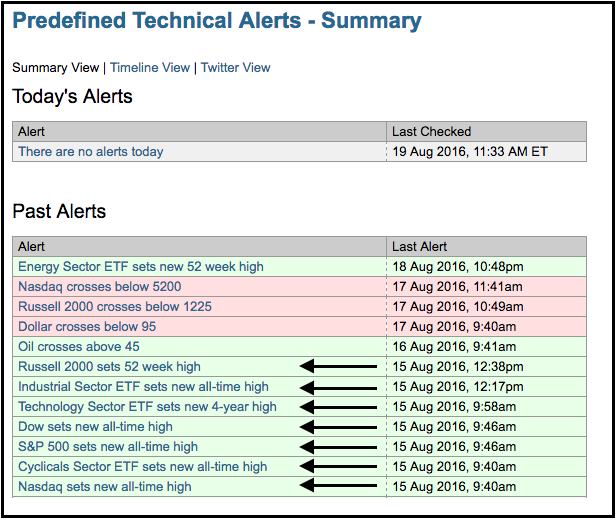
All Time Highs Set the Tone // Four Indecisive Weeks for the S&P 500 EW Index // Bandwidth Hits Lowest Level in over 10 Years // S&P 500 Clears Upper Band // Russell 2000 Remains on Bull Signal //// ....... Read More
Art's Charts August 18, 2016 at 09:17 AM
Broad Market Strength affirms Bull Market // Short-term Yields Edge Higher - Will Long-term Yields Follow? // Extrapolating from the June Swoon in Treasury Yields // Finance Sector Remains Strong // Regional Bank SPDR Holds Breakout - JPM, C, BAC, USB // Setting first Supports fo... Read More
Art's Charts August 16, 2016 at 09:01 AM
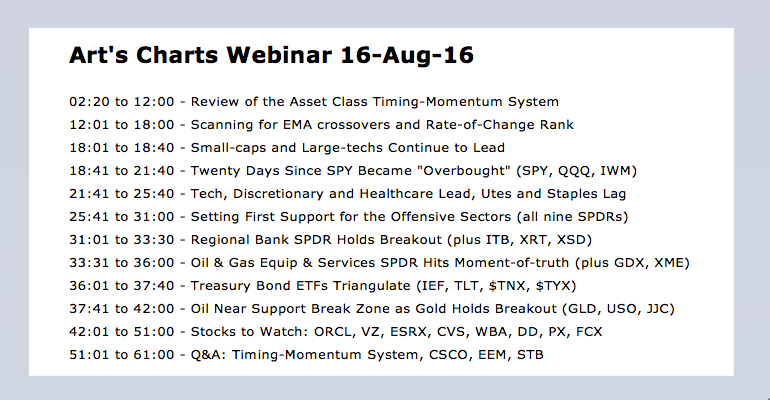
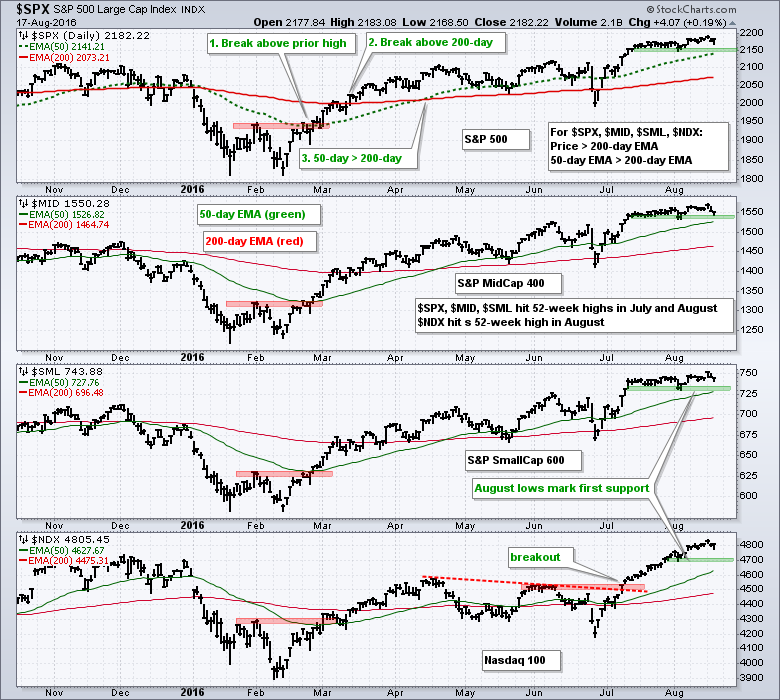
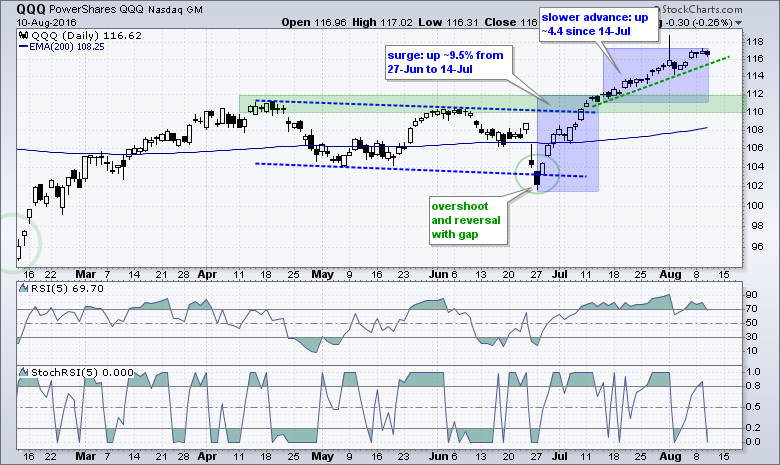
Click here for the Webinar video - Click here for the Webinar ChartList Twenty Days Since SPY Became "Overbought" // RSI for IWM finally Hits 70 // Small-caps and Large-techs Continue to Lead // Tech, Consumer Discretionary and Healthcare Lead // Utilities and Staples are Lagging... Read More
Art's Charts August 13, 2016 at 03:52 AM
SystemTrader // Introduction // Setting Ground Rules // Picking the Securities // Buy-and-Hold Performance // Reducing Drawdowns with Simple Timing // Increasing Returns with Pure Momentum // Combining Trend-Following and Momentum // Conclusions - Past Performance...... Read More
Art's Charts August 11, 2016 at 08:23 AM
Bulls Maintain Short-term Edge // Nasdaq and Russell 2000 Outperforming // Energy Complex Weakens Across the Board // Energy-related ETFs Could be Vulnerable // Bullish Setups in HealthCare Providers and Telecoms // Regional Bank SPDR and Finance SPDR Stutter after Breakouts ////... Read More
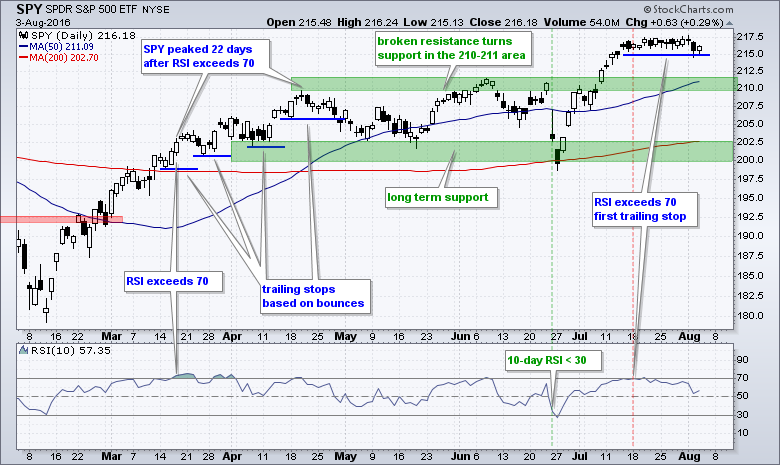
Art's Charts August 09, 2016 at 09:43 AM
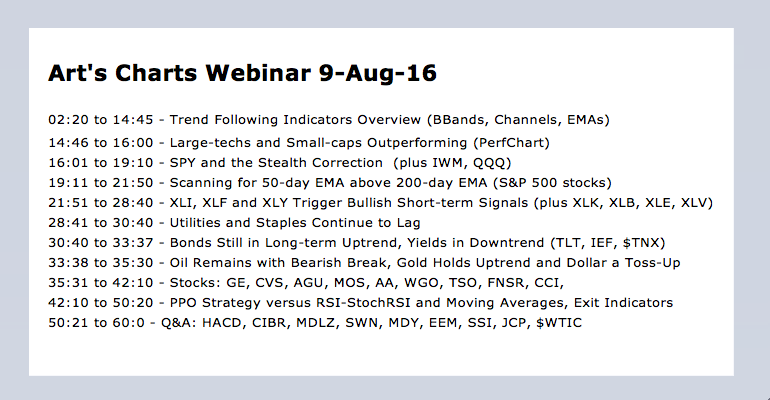
Click here for Webinar Video Large-techs and Small-caps Outperforming // SPY and the Stealth Correction // Golden Crosses remain for All Nine Sector SPDRs // XLI, XLF and XLY Trigger Bullish Short-term Signals // Utilities and Staples Continue to Lag // PPO Strategy versus RSI-St... Read More
Art's Charts August 06, 2016 at 05:32 AM
SystemTrader // Adding Trend to Broad Market Assessment // Three Trend Following Indicators // Using Donchian Channels // Hard to Beat the Humble MA Crossover // Testing Crosses of the 40 Week EMA // Optimizing and Choosing a Focus Index // Setting up the Trend Troika // ....... Read More
Art's Charts August 04, 2016 at 07:38 AM
Trend > Seasonality // QQQ and IWM Hold Support // EW Finance ETF Nears 52-week High // Measuring Correlations with the 10-yr Yield ///// ..... Trend > Seasonality ...... Read More
Art's Charts August 03, 2016 at 06:32 AM
Tuesday's webinar for Art's Charts was cancelled due to technical difficulties. Most of the webinar is based on the charts from Tuesday's commentary, which are posted again below... Read More
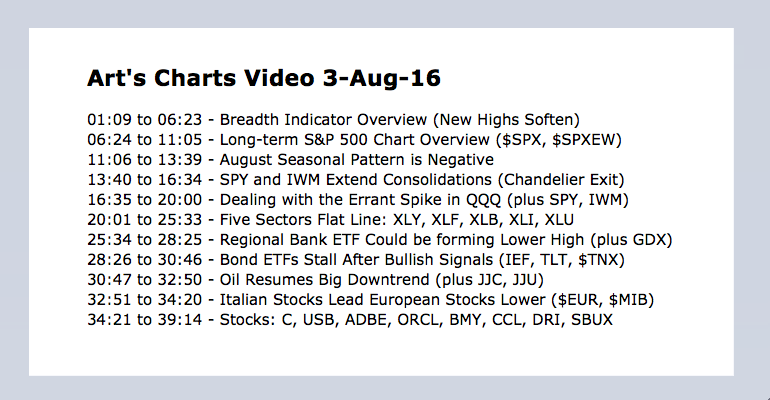
Art's Charts August 02, 2016 at 10:17 AM
Breadth Indicator Review // New Highs Soften in late July // %Above 200-day Remains Strong // Marking First Support for S&P 500 // Dealing with the Spike in QQQ // SPY Extends Trading Range //// ....... Read More