Art's Charts September 30, 2016 at 10:09 AM
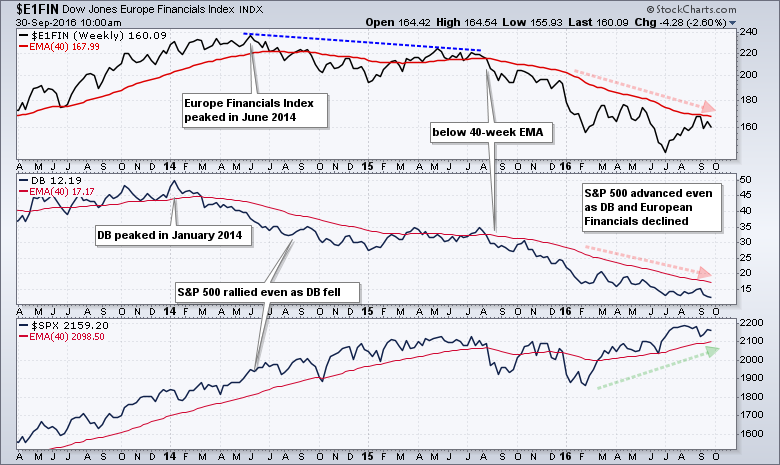
Are US Stocks Affected by European Financials? .... Five Broad Market Risk Ratios .... Small-caps are Killing It .... Junk Bonds Show No Fear .... A Selling Climax for Deutsche Bank? .... Friday Food for Thought .... //// ...... Read More
Art's Charts September 29, 2016 at 12:12 PM
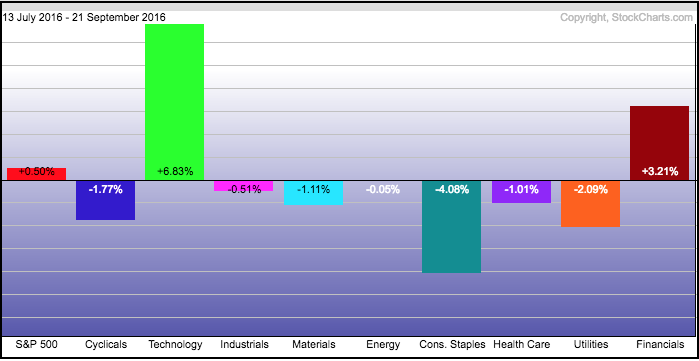
Finance and Tech Power S&P 500 .... Broad Market Stalls .... QQQ and IWM Maintain Upward Drift .... XLI and XLB Bounce with Higher Lows .... XLE Holds Uptrend as XES Challenges Resistance .... Metals & Mining SPDR Extends Breakout .... Art's Charts ChartList Update .... //// ...... Read More
Art's Charts September 27, 2016 at 04:57 PM
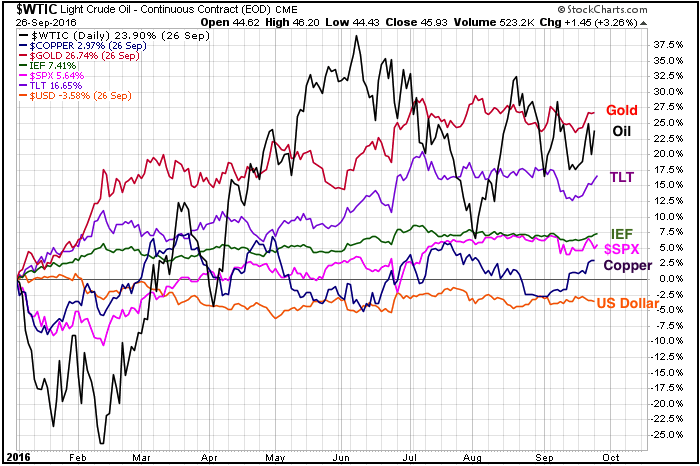
Year-to-date Performance for 3 Key Commodities .... Oil Remains Stuck in Downtrend .... Copper Consolidates with Downtrend .... Gold Stalls above Breakout Zone .... Charts to Watch - XLF, GOOGL, FDN and MSFT .... //// ...... Read More
Art's Charts September 26, 2016 at 11:45 AM
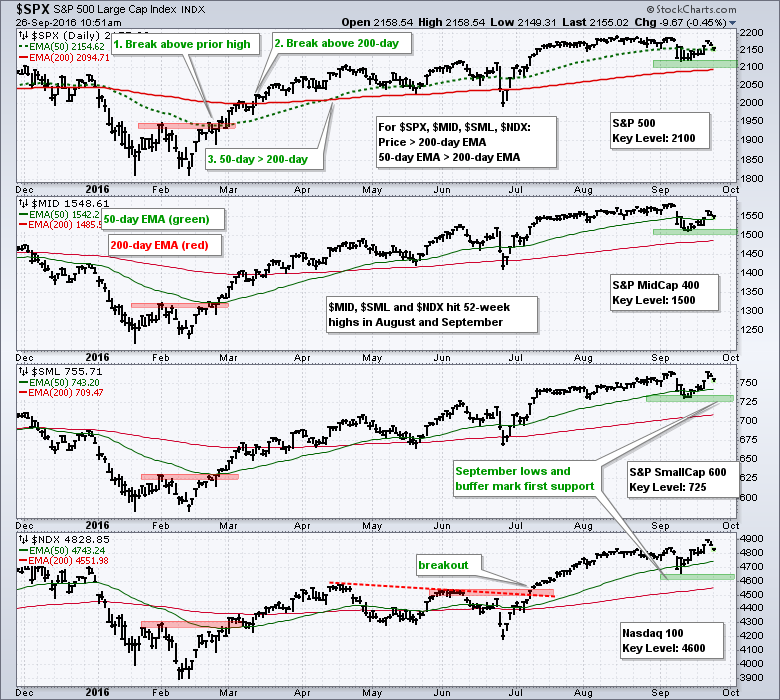
Defining the Uptrends using Benchmark Lows .... Broad Market Breadth Review .... Watch the Stock-Bond Ratio for Clues on Risk Appetite .... %Above 200-day Triggers for Consumer Discretionary Sector .... Technology Sector Shows No Signs of Weakness ...... Read More
Art's Charts September 22, 2016 at 01:25 PM
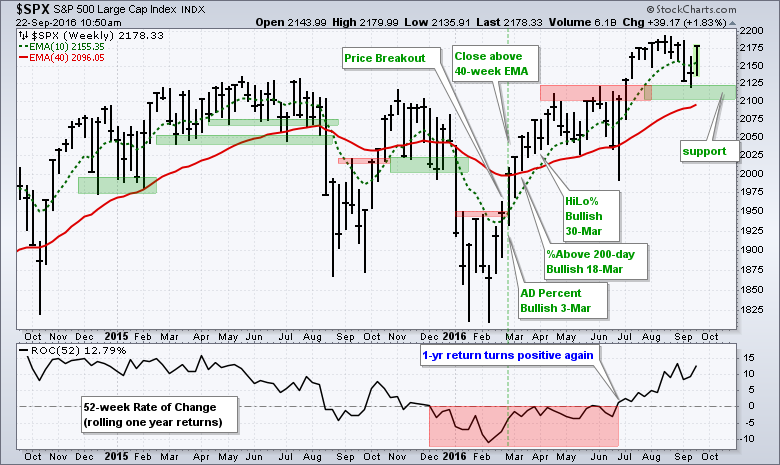
Long-term Trend Overrides Short-term Weakness .... Percent above 200-day EMA Remains Strong .... SPY Follows Through on Inside Day Reversal .... QQQ Leads as IWM Challenges High .... Housing and Retail are Still Lagging .... Regional Banks Extend Correction ...... Read More
Art's Charts September 16, 2016 at 04:57 PM
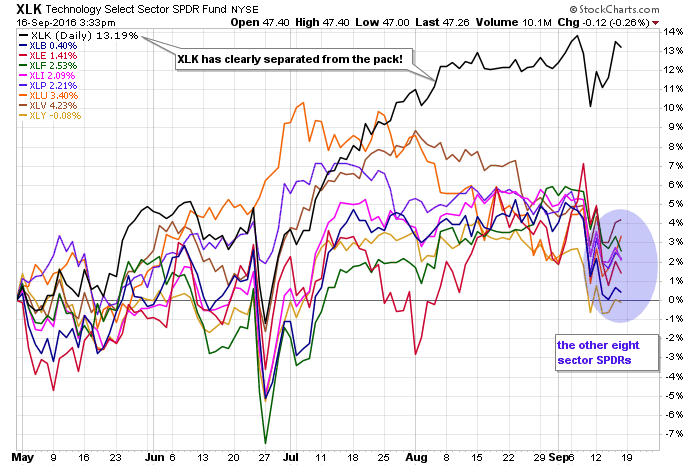
Technology ETFs Establish Key Levels to Watch .... Semis and Networking ETFs Follow Suit .... Cisco Forms a Pair of Inside Days .... A Big Counter-Trend Advance in XLE .... Crude Remains in Long-term Downtrend .... Biotech SPDR Holds its Breakout ...... Read More
Art's Charts September 15, 2016 at 09:09 AM
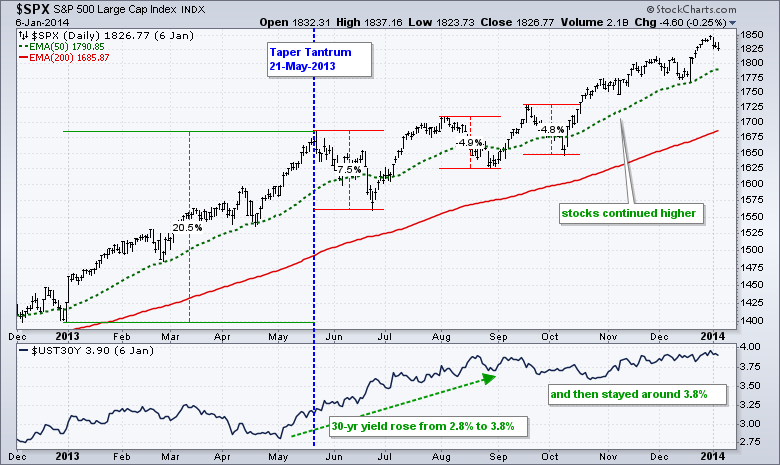
Revisiting the 2013 Taper Tantrum .... Stocks Entitled to a Correction .... Oversold within an Uptrend .... Watching Inside Days in XLY and XLI .... XLE and XES Go their Separate Ways .... Exxon and Chevron Lead XLE Lower .... Radware Breaks Out as Icon Firms .... //// ...... Read More
Art's Charts September 13, 2016 at 11:29 AM
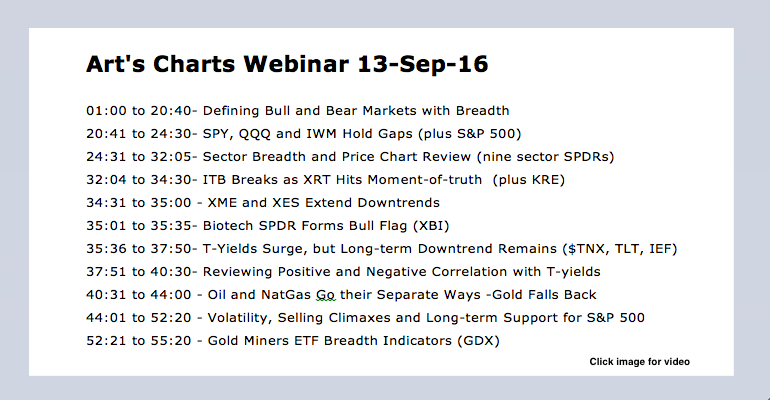
Webinar Video (here) -- Art's Charts ChartList (here) Gap and Volatility Hold .... Measuring Broad Market Breadth .... Using AD Percent for Early Warning .... New Highs Lag in S&P 500 .... Vast Majority of Stocks Still Trending Up .... Putting it All Together ...... Read More
Art's Charts September 12, 2016 at 07:42 AM
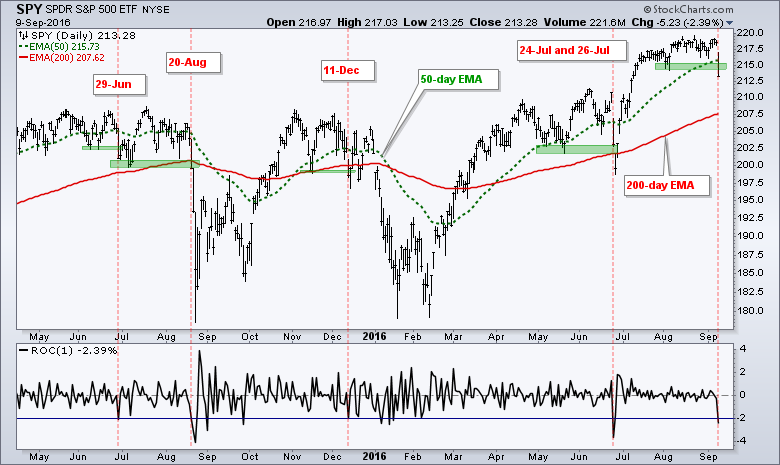
Comparing the Current Decline with Prior Events .... Measuring Selling Climaxes .... Just a Pullback or More? .... Three Items Marking Next Support for the S&P 500 .... Putting EMA Crosses to the Test .... Mean Reversion Systems have Positive Expectancy .... //// ...... Read More
Art's Charts September 09, 2016 at 09:45 AM
Marking Pullback Support for the S&P 500 .... QQQ Stalls as Apple Lags the Fab Five .... Apple Falls on High Volume .... Alphabet and Microsoft Hold above Breakouts .... Amazon and Facebook are the Clear Leaders .... XLY Shows Internal Weakness ...... Read More
Art's Charts September 08, 2016 at 09:45 AM
A Stealth Correction ... Stocks to Watch on the Art's Charts ChartList ... An Impressive Parade of New Highs ... XBI Successfully Tests Breakout ... XOP is Outperforming XES ... Volatility Calendar ... //// ..... Read More
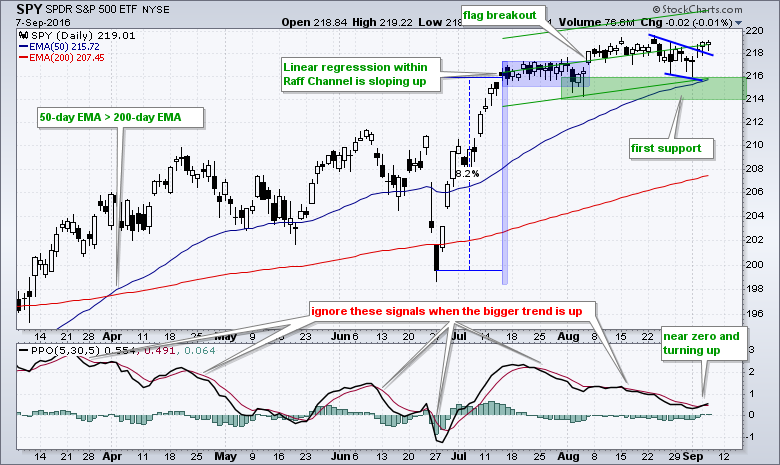
Art's Charts September 06, 2016 at 10:16 AM
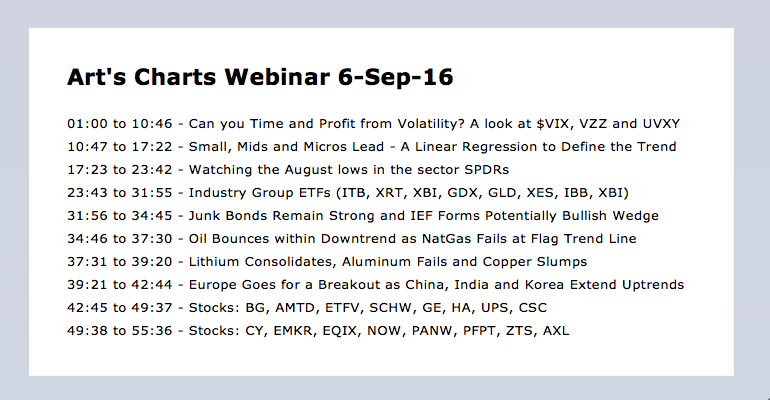
Click here for Webinar recording .... Linear Regression Defines the Trend .... Small, Mid and Micro Lead the Charge .... IWM Works its Way Higher .... The Volatility Calendar .... Is it Possible to Profit from Volatility? .... Webinar Preview .... //// ..... Read More
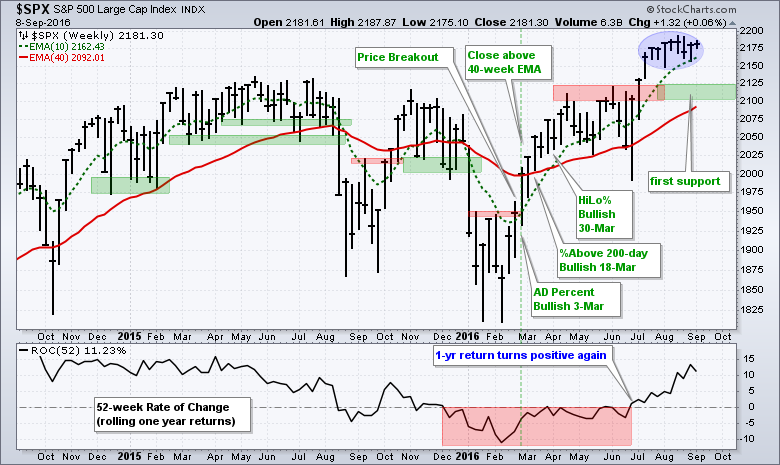
Art's Charts September 02, 2016 at 08:49 AM
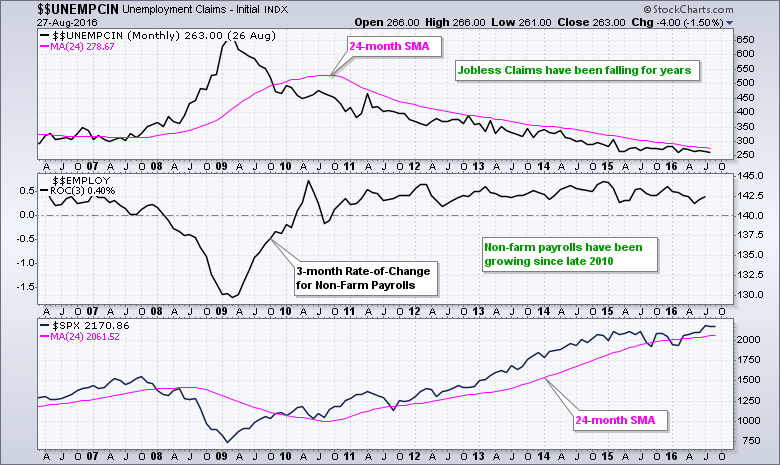
Taking the Emotion out of Jobless Claims and Non-Farm Payrolls .... No Issues with Weekly SPY Chart .... Backtest Review for Key EMA Crossover .... ChartCon Strategy Preview .... QQQ Stalls with Very Tight Range .... Small-caps and Large-caps Continue to Outperform ...... Read More
Art's Charts September 01, 2016 at 10:47 AM
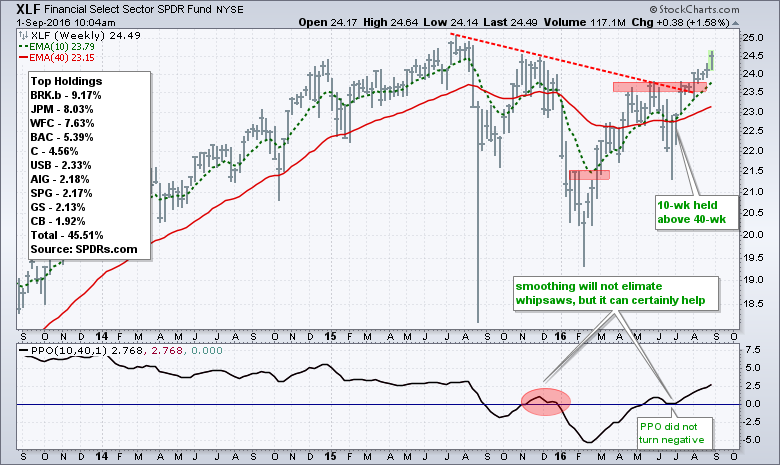
REITs and Banks go their Separate Ways // Financial Services Starts to Outperform // Real Estate Starts to Underperform // Notes on XLRE and XLFS // REITs are Negatively Correlated to Treasury Yields // Banks are Positively Correlated to Yields //// ....... Read More