Art's Charts July 28, 2016 at 07:25 AM
Waning Momentum is Not Always Negative // Selling Pressure Remains Muted // IWM Breaks Out of Flag // Here Comes August // Positive Correlation between Bonds and Gold // Adding Parabolic SAR to IEF Signal // Gold Follows Through on Bullish Signal // Scanning the S&P 1500 for RSI-... Read More
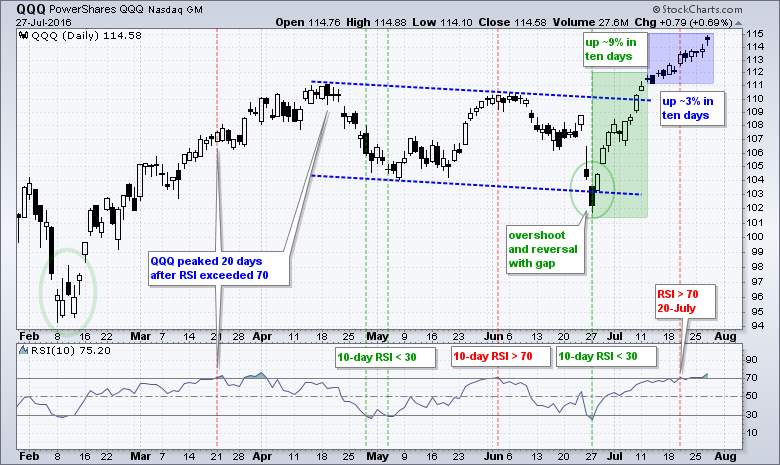
Art's Charts July 26, 2016 at 07:35 AM
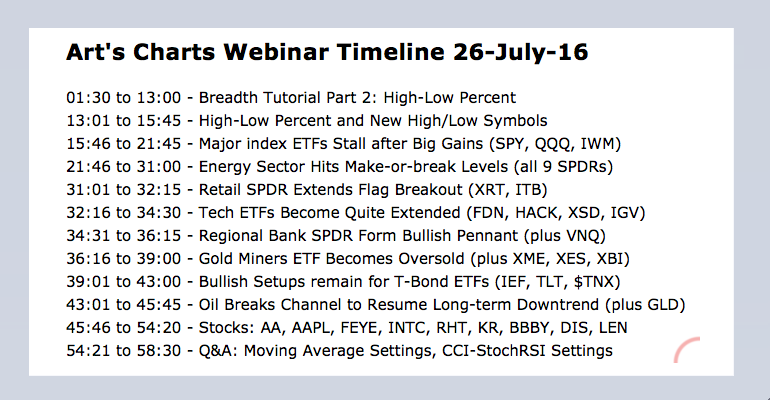
SPY Stalls and Gains Hold // Marking First Support for QQQ // IWM Forms High and Tight Flag // Energy Sector Nears Make-or-break Level // XES Breaks Channel Trend Line // Oil Resumes Long-term Downtrend // Webinar Preview //// ....... Read More
Art's Charts July 25, 2016 at 12:12 PM
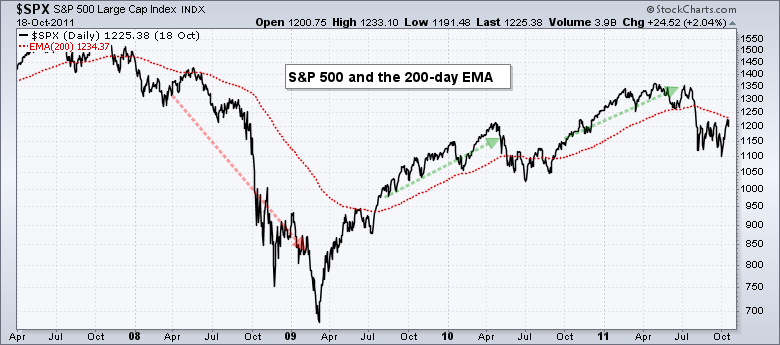
SystemTrader // Introduction - Measuring Trend Participation // 200-day EMA versus 200-day SMA // Backtesting the Moving Averages // Percent above 200-day Breadth Indicator // Smoothing and Reducing Whipsaws // Capturing Broad Market Participation // Conclusions on Trend Particip... Read More
Art's Charts July 23, 2016 at 03:17 AM
SystemTrader // System Rules and Conditions // Why 5-day RSI? // Testing with S&P 500 Trend Condition // Surviving Some Bad Signals // Sensitivity Testing // Reducing the MDD with Another Trend Condition // Testing Each SPDR Individually // The Power of the Portfolio // Further S... Read More
Art's Charts July 21, 2016 at 07:55 AM
Nothing to Do but Trail a Stop // Reviving the Raff Regression Channel for QQQ // Chandelier Exit for IWM // Retail Continues to Impress // Applying the 5-day RSI-StochRSI Strategy to IEF and TLT // USO, BNO and XES Stutter after Bullish Signals // Scan Code for RSI-StochRSI Stra... Read More
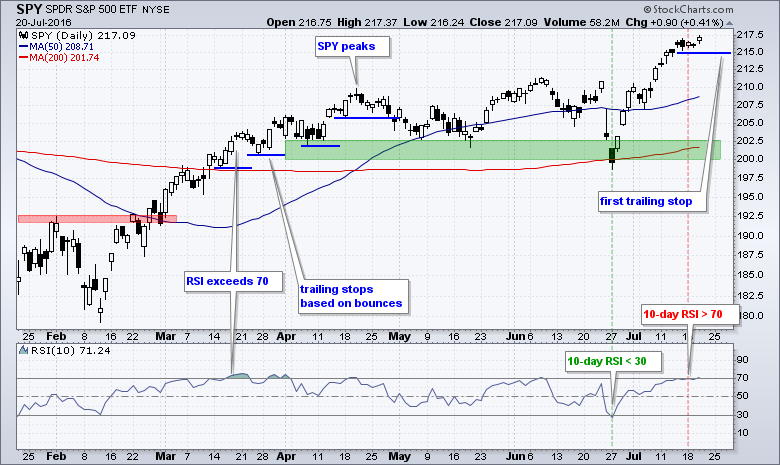
Art's Charts July 19, 2016 at 10:32 AM
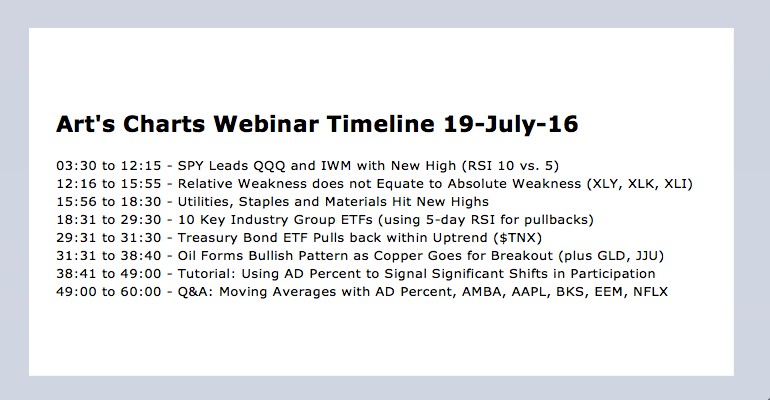
Webinar Video SPY Continues to Lead the Big Three // RSI Nears 70 for IWM // Sector SPDRs Reflect Broad Market Strength // Webinar Preview - Using Breadth Indicators // Submit a Webinar Question //// ....... Read More
Art's Charts July 18, 2016 at 11:02 AM
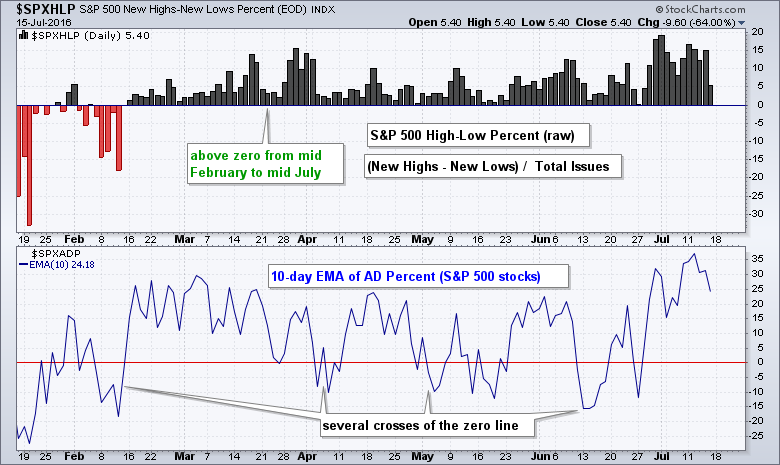
SystemTrader // Introduction - the Bias is Obvious // High-Low Percent Calculation // Massaging the Data with Different Indicators // Setting Bullish and Bearish Thresholds // Breaking Down the S&P 1500 for more Clues // Conclusions on this Trend Following Indicator // High-Low P... Read More
Art's Charts July 13, 2016 at 01:44 AM
SystemTrader // Introduction // Picking the Market Benchmark // Advance-Decline Percent // Massaging the AD Data // Measuring Significant Shifts // Dividing, Conquering and Affirming // Conclusions AD Percent Indicators at StockCharts //// . . . . ... Read More
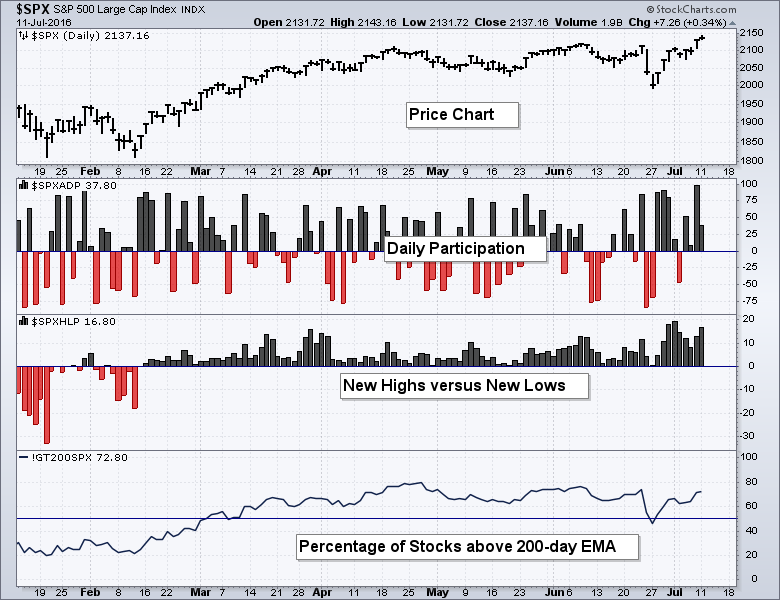
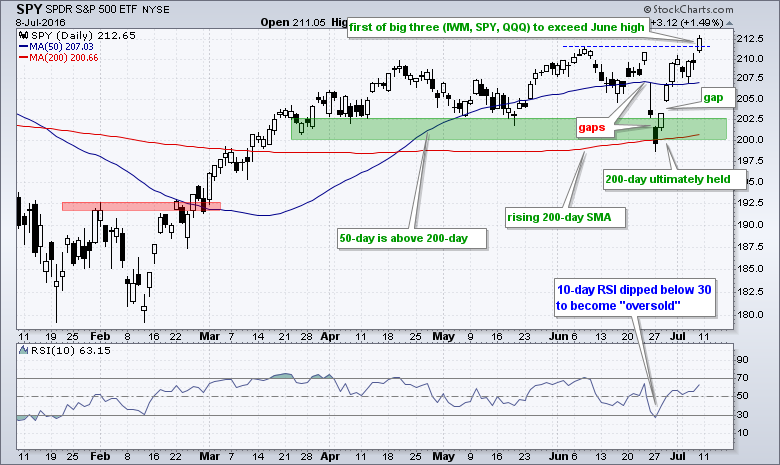
Art's Charts July 12, 2016 at 09:04 AM
Webinar Video for Tuesday, July 12th S&P 500 Reaches Uncharted Territory // Support and Resistance for Indexes and ETFs // Small-caps and Mid-caps Outperforming // S&P 500 Breadth Finally Confirms // Small-cap New Highs Surge // Percent above 200-day Stays Bullish // Webinar Prev... Read More
Art's Charts July 09, 2016 at 06:39 AM
Bullish Resolution to an Already Bullish Chart // QQQ Breaks Channel Trend Line // New Highs Surge in Nasdaq 100 // Creating an Up-Down Pair Chart // Small-caps Come Alive // Consumer Discretionary Leads all Sectors // RCD Breaks June High //// ....... Read More
Art's Charts July 07, 2016 at 09:01 AM
SPY Looks More Bullish than Bearish // QQQ and IWM Hold the Gaps // Measuring the Sector Balance in the S&P 500 // All Nine Sector SPDRs have Golden Crosses Working // Healthcare SPDR Clears Benchmark High // Overbought, Oversold and the Bigger Trend // Amazon and Home Depot Powe... Read More
Art's Charts July 05, 2016 at 11:28 AM
Still Watching the Swing within Trading Range // Mid-caps Outperform Large-caps // Small-caps Hold Support Zone // Breadth Indicators Hit New Milestones // Bonds Extend Surge as Yields Fall // Falling Yields Weigh on Finance-related Groups // Break Down Holds for Finance SPDR // ... Read More
Art's Charts July 01, 2016 at 08:43 AM

SystemTrader // Testing a Basic Mean-Reversion System // Tweaking RSI for Sensitivity // Setting the Ground Rules // Mean Reversion Scan Code // Buy the Falling Knife // Buy after the Bounce // And the Best System Is...... Read More