Don't Ignore This Chart! July 31, 2015 at 04:40 PM
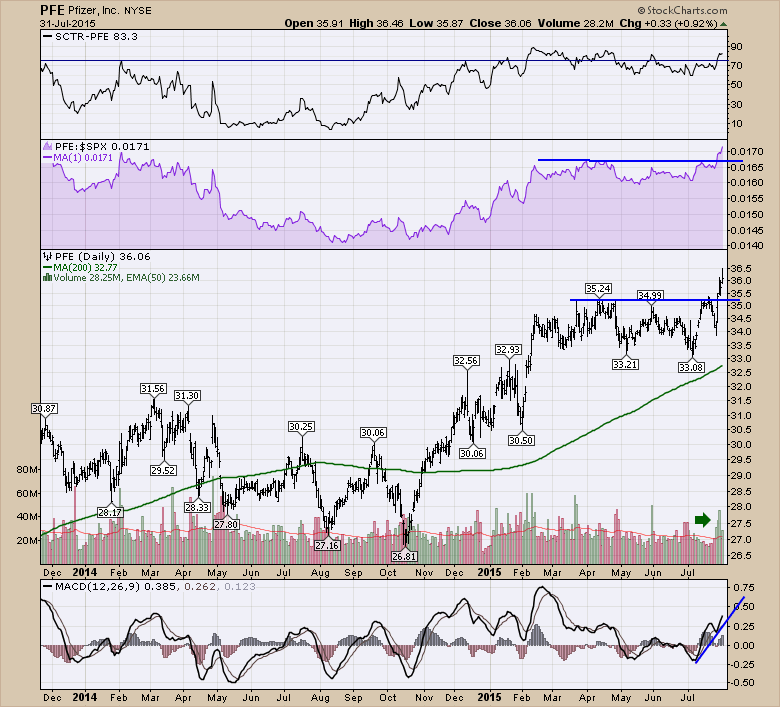
Pfizer (PFE) is breaking out to new 52 week highs after consolidating for 6 months. The SCTR jumped back above 80% this week which is a sign of strength... Read More
Don't Ignore This Chart! July 30, 2015 at 12:01 PM
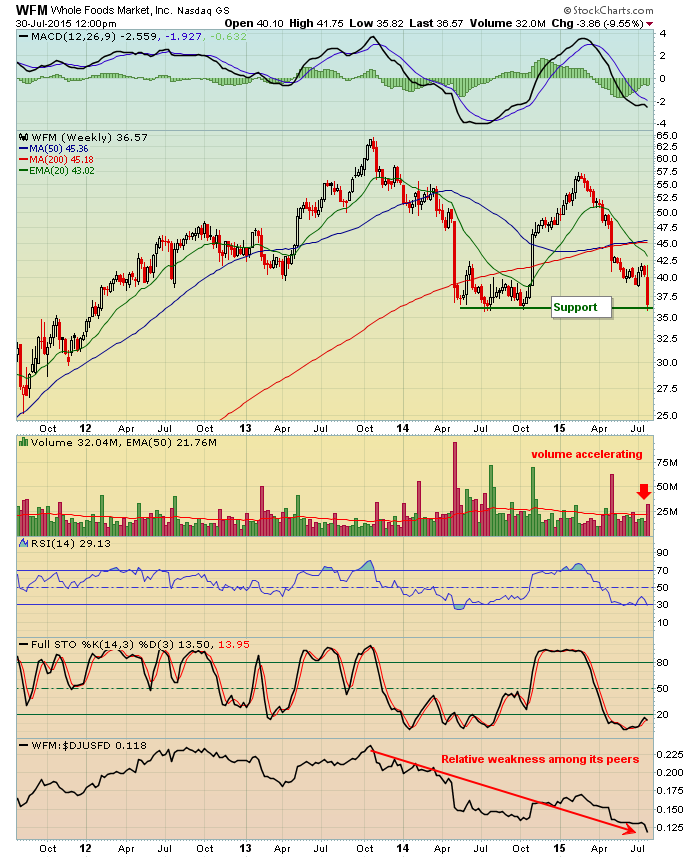
WFM posted underwhelming quarterly earnings results and the stock is down significantly in early action today. More importantly, however, is the longer-term price support that's being tested. WFM has not had an open or a close beneath 35... Read More
Don't Ignore This Chart! July 29, 2015 at 09:50 AM
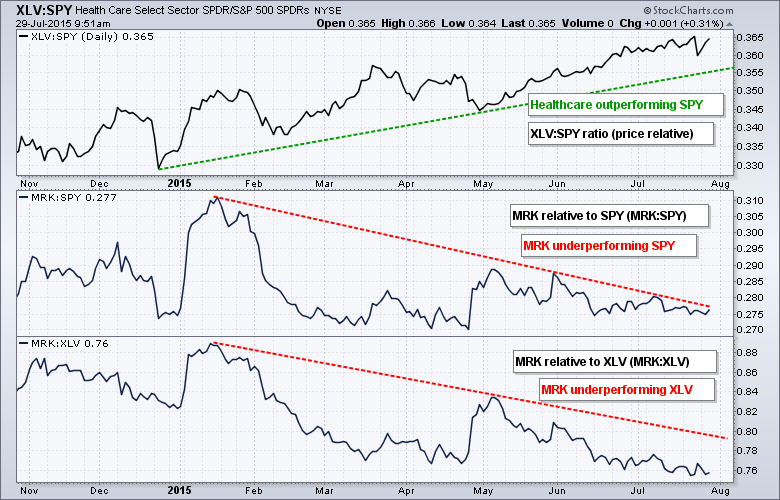
The HealthCare SPDR (XLV) has been one of the strongest sectors in 2015, but Merck (MRK) has lagged both the market and the sector. The first chart shows the HealthCare SPDR (XLV) relative to the S&P 500 SPDR (SPY) using the price relative (XLV:SPY ratio)... Read More
Don't Ignore This Chart! July 28, 2015 at 09:20 PM
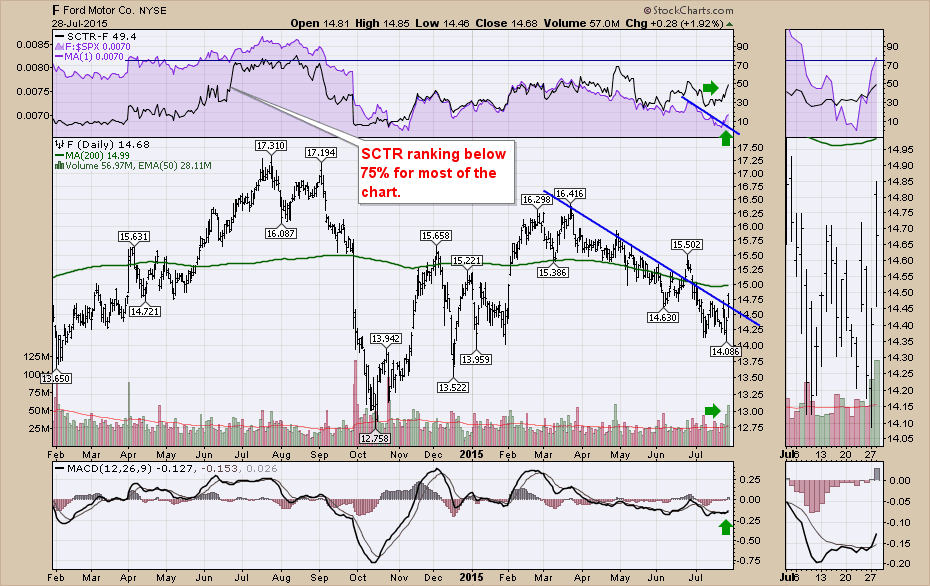
Ford (F) announced earnings and they were well above the street estimates. I wondered if that would send the stock price rocketing up on a big bullish day today. Here is the chart after earnings. A few positives showed up today. Ford moved up more than the indexes did... Read More
Don't Ignore This Chart! July 27, 2015 at 01:40 PM
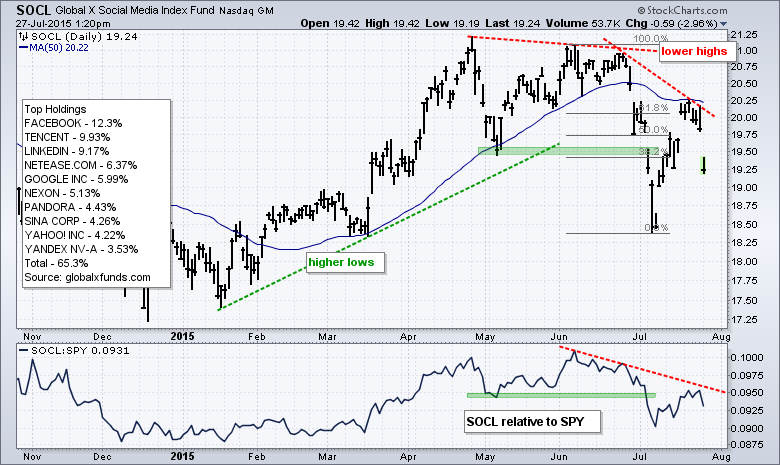
The Social Media Global ETF (SOCL) fell sharply on Monday to signal a continuation of the prior decline. The chart below shows SOCL breaking support with a sharp decline in late June and early July. This is the break that broke the bull's back... Read More
Don't Ignore This Chart! July 25, 2015 at 06:12 PM
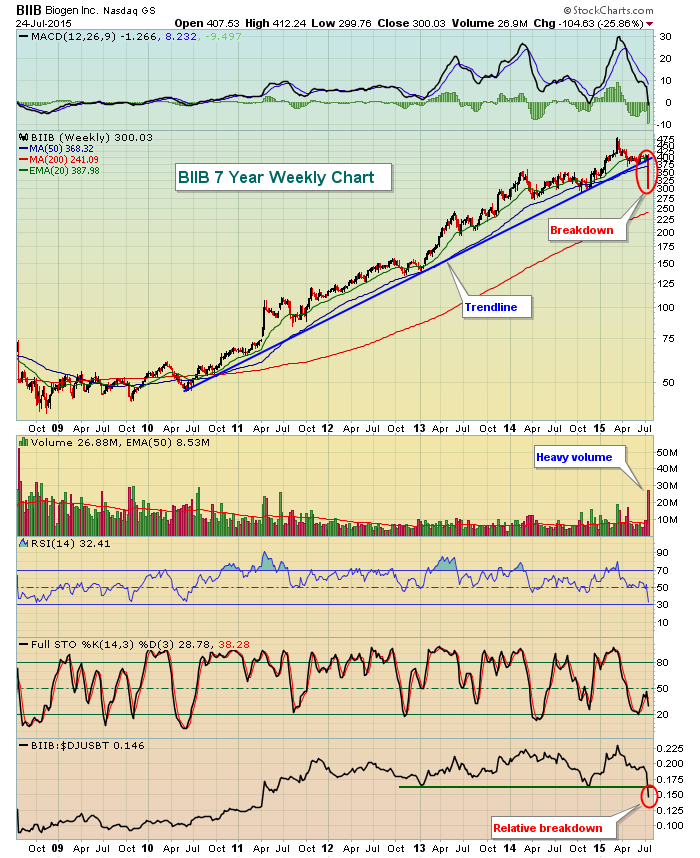
There are pullbacks in uptrends and then flat out trend reversing breakdowns. We never know for sure which is which until history plays out. But Biogen's (BIIB) massive selling on Friday has all the makings of the latter... Read More
Don't Ignore This Chart! July 24, 2015 at 03:13 PM
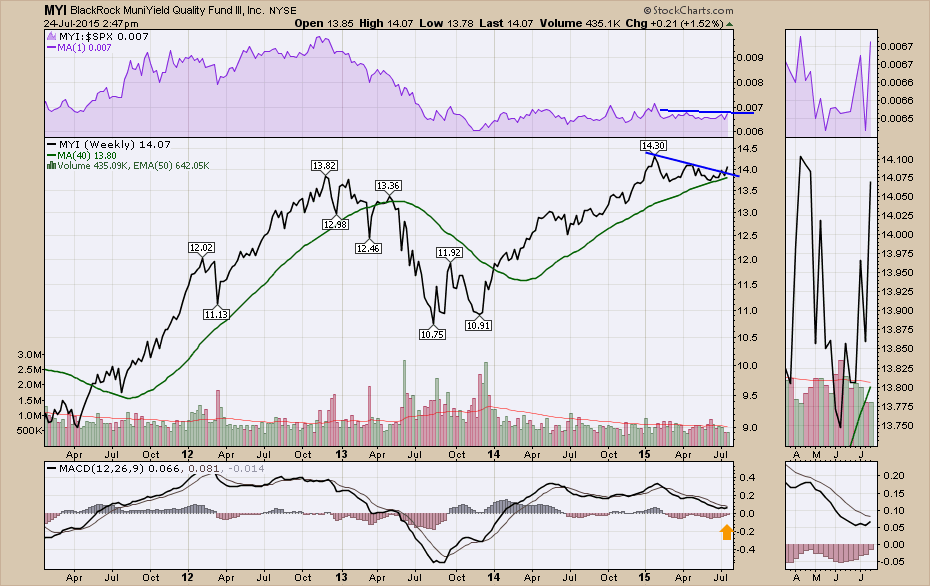
The BlackRock MuniYield Fund (MYI) broke above the trend line this week. This move into Munis and the TLT's move to higher ground all point to a change in trend on the bond side of the landscape... Read More
Don't Ignore This Chart! July 23, 2015 at 04:30 PM
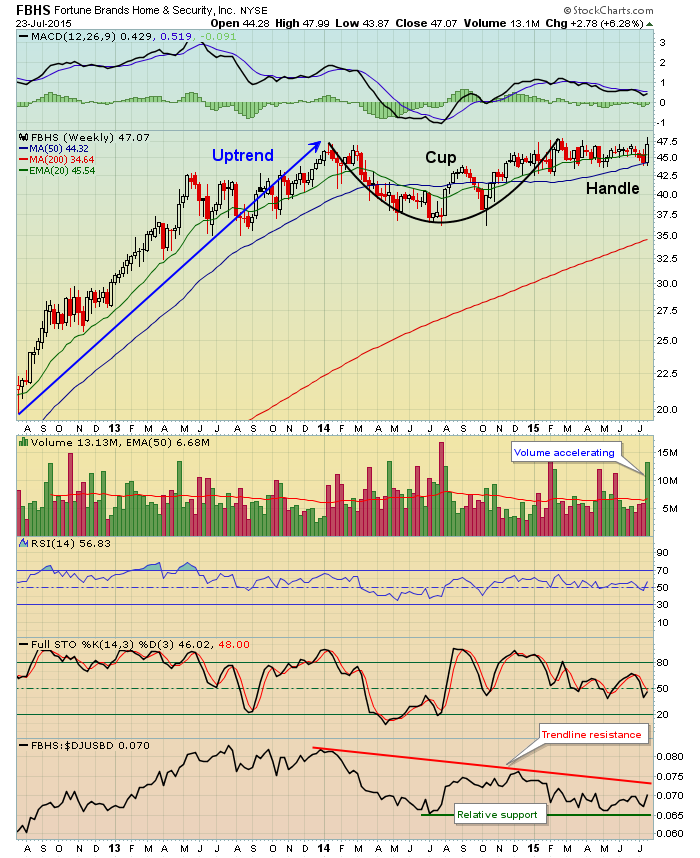
Fortune Brands Home & Security, Inc (FBHS) surged in volume today and appeared to be on its way to a breakout above closing price resistance near 48.00. FBHS actually printed an intraday high of 47.99 before reversing and finishing weak the final two hours... Read More
Don't Ignore This Chart! July 22, 2015 at 10:44 AM
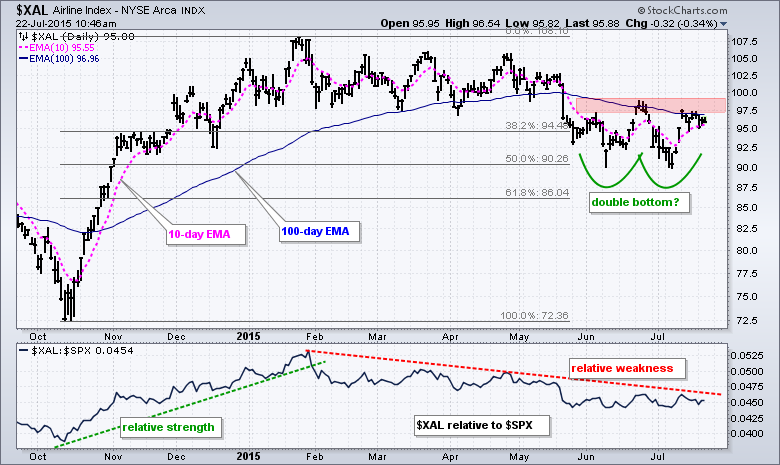
The Airline Index ($XAL) has been a real dog in 2015, but the index is showing signs of support and a double bottom could be emerging. The chart below shows $XAL peaking in January and moving lower the last six months... Read More
Don't Ignore This Chart! July 21, 2015 at 01:59 PM
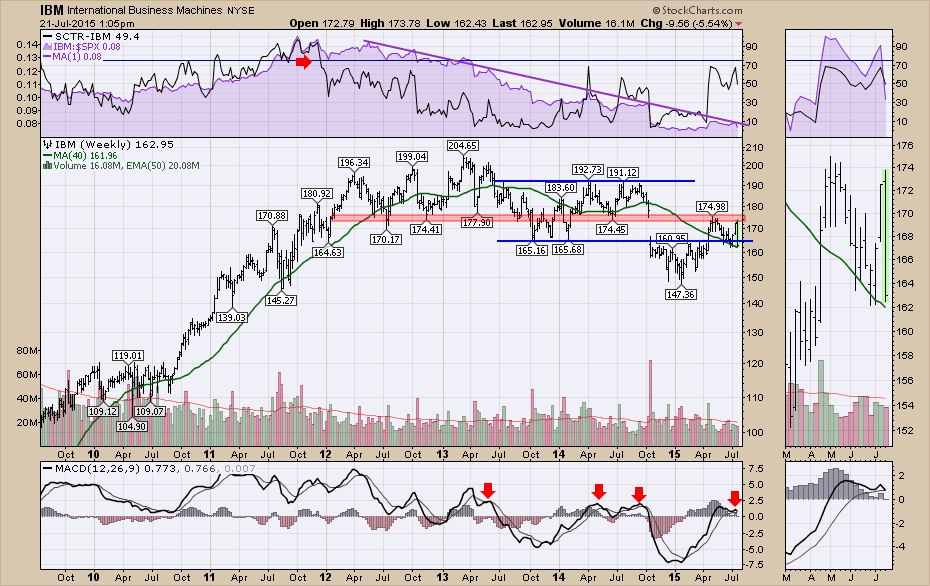
IBM (IBM) has been a difficult stock for years. Investors keep holding 'Big Blue' expecting a turn around. This difficulty is the stock has no credibility as a safe investment. The last time IBM was a top quartile stock according to the SCTR is marked with a red arrow... Read More
Don't Ignore This Chart! July 20, 2015 at 01:39 PM
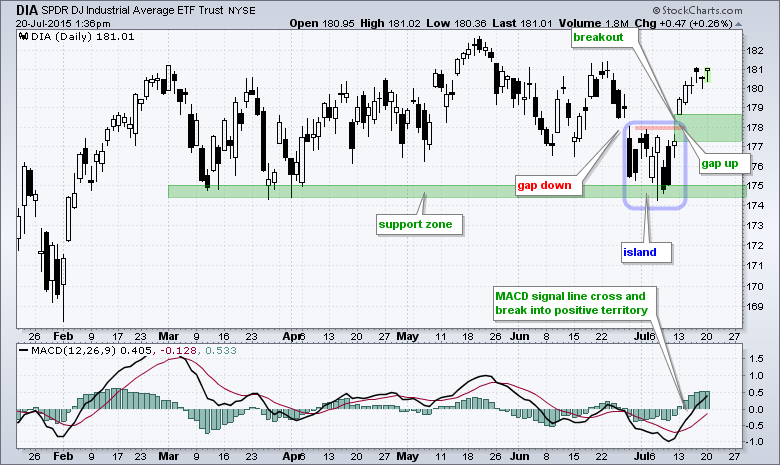
With a gap and big surge, the Dow Diamonds (DIA) triggered a series of bullish signals that remain valid until proven otherwise. First, let's look at the bullish signals. DIA bounced off support in the 174-175 area in early July and broke resistance with a surge above 178... Read More
Don't Ignore This Chart! July 17, 2015 at 03:48 PM
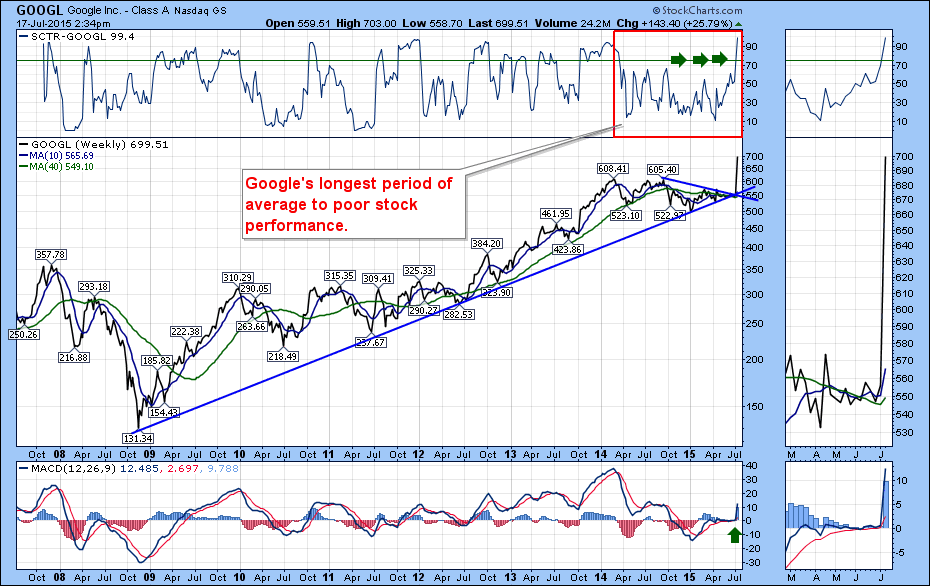
Anyone who had doubted Google (GOOGL) and their ability to make money got routed to the Pocket of Pain in today's trading. Google surged 25% in trading and was up $140 from Thursday's close. This massive ramp up is clearly a house cleaning for all those caught shorting Google... Read More
Don't Ignore This Chart! July 16, 2015 at 10:02 AM
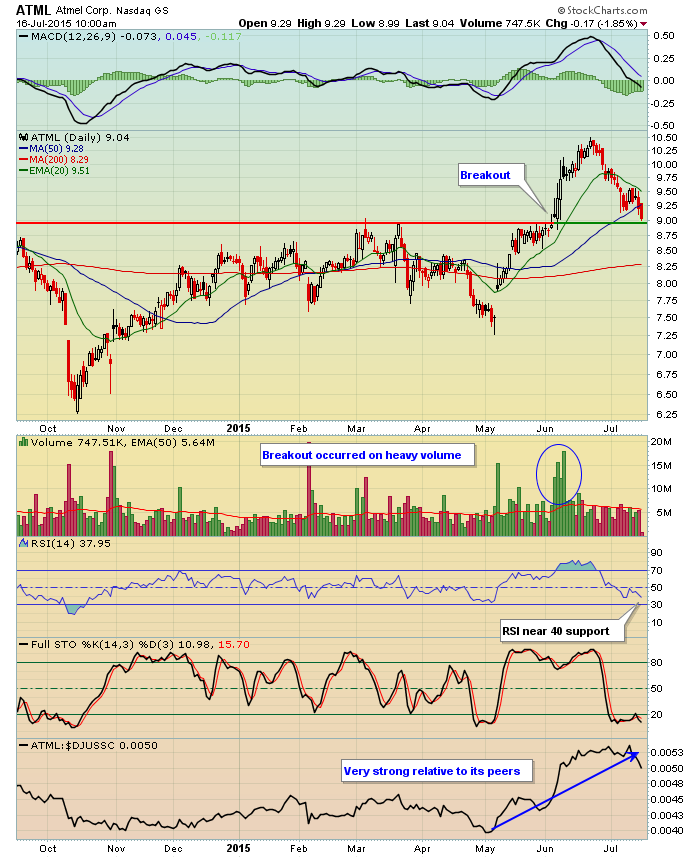
Just a couple months ago in early May, ATML gapped higher on big volume and hasn't looked back since. Along the way, it cleared price resistance just below 9.00 on very heavy volume and subsequently surged to 10.50 before becoming violently overbought and in need of relief... Read More
Don't Ignore This Chart! July 15, 2015 at 03:37 PM
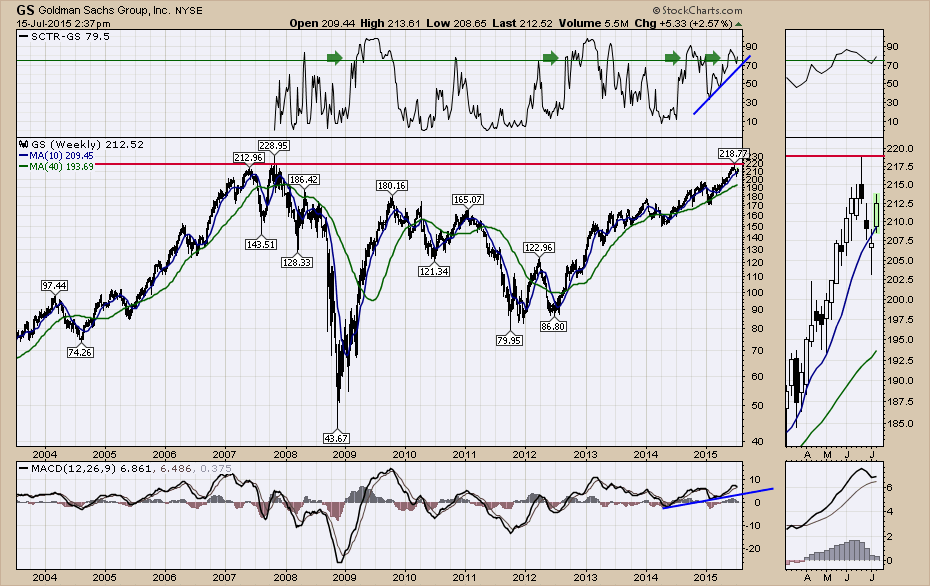
Goldman Sachs (GS) continues to look towards Pluto for direction. After dipping 80% in the 2009 financial pullback, Goldman bounced well. On its return to the $180.00 level, Goldman decided to drop 60% again back to $79.95. But the low in 2012 at $86... Read More
Don't Ignore This Chart! July 14, 2015 at 09:49 AM
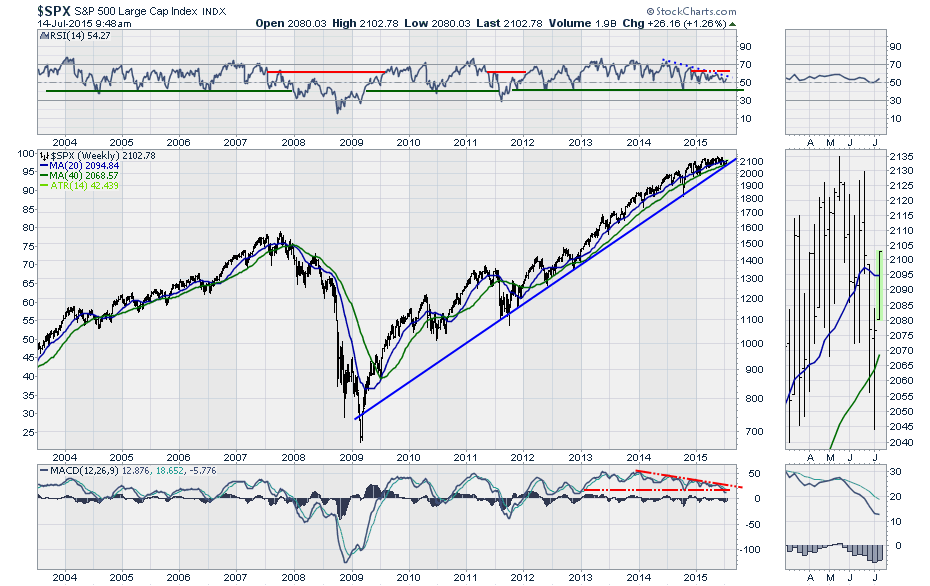
For fundamental investors, the price action is still in the top right corner so why worry? For technicians the bull market message became more muted last week... Read More
Don't Ignore This Chart! July 13, 2015 at 12:48 PM
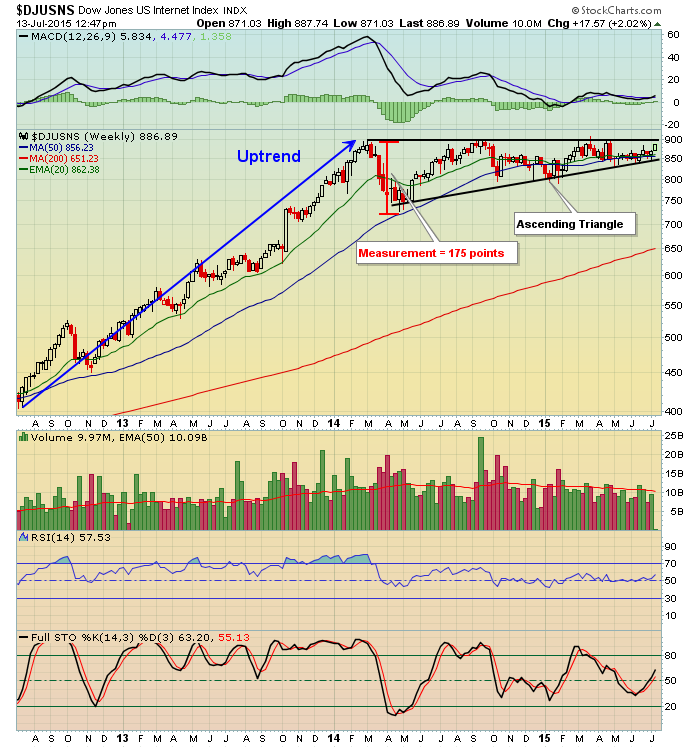
Many traders are believing the Dow Jones U.S. Internet Index ($DJUSNS) is dead money and for the past 18 months or so, that's been mostly true... Read More
Don't Ignore This Chart! July 11, 2015 at 03:24 PM
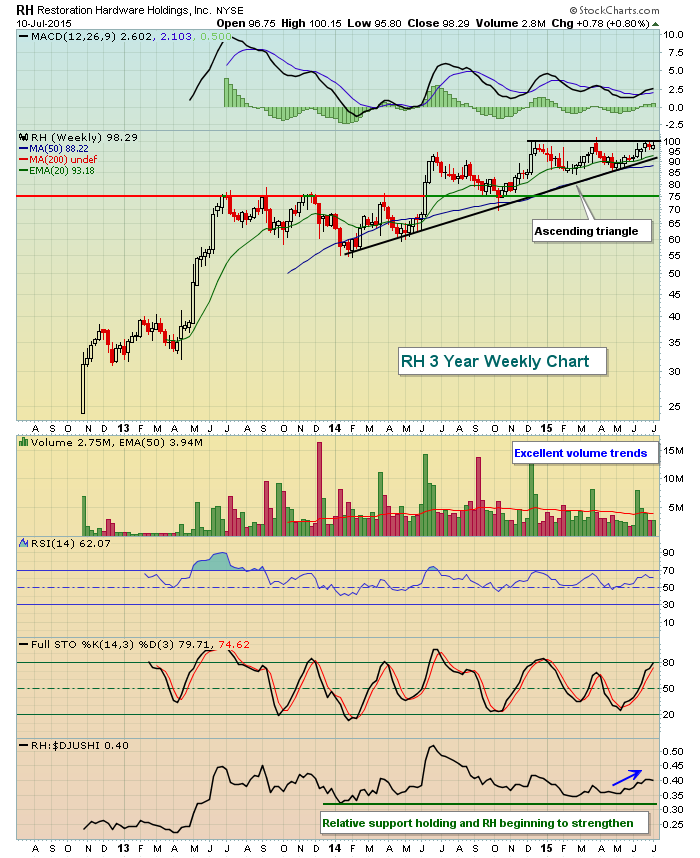
Restoration Hardware (RH) engages in the retail of home furnishings. Over the past three months, the home improvement retail index ($DJUSHI), to which RH belongs, is down more than 4% while RH consolidates ahead of what could be a triple top breakout... Read More
Don't Ignore This Chart! July 10, 2015 at 09:41 AM
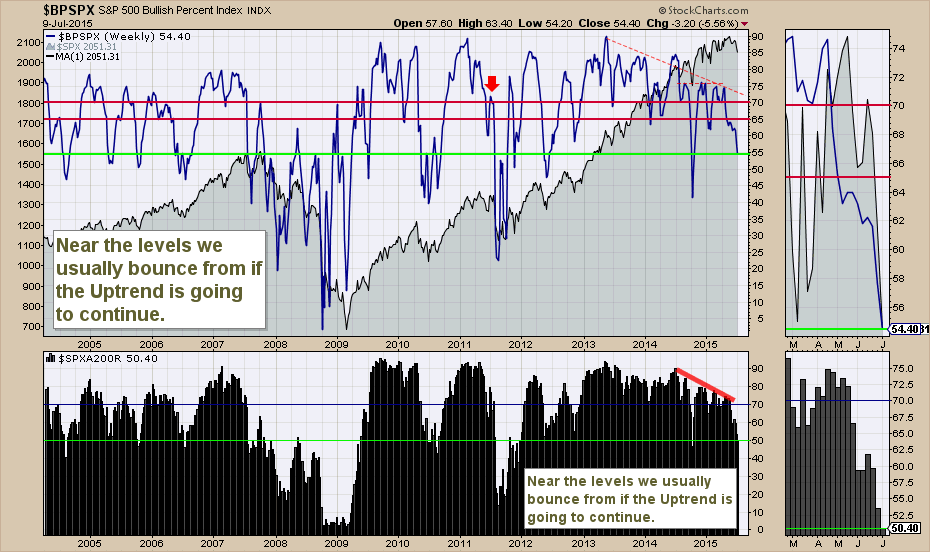
The Bullish Percent charts are one of the technical tools that quickly demonstrate how broad or narrow the rally is. I like to look at them together with the Number of Stocks above the 200 DMA ($SPXA200R)... Read More
Don't Ignore This Chart! July 09, 2015 at 03:22 PM
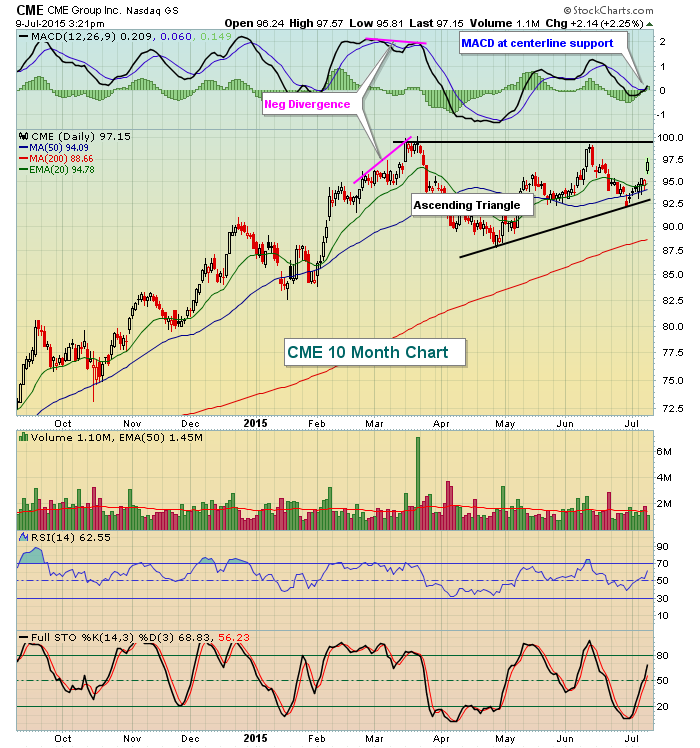
The recent movement in CME shares back and forth is nothing but noise. The technical picture here is very solid with an uptrend in place that began in early 2013, preceding the current ascending triangle formation... Read More
Don't Ignore This Chart! July 08, 2015 at 03:53 PM
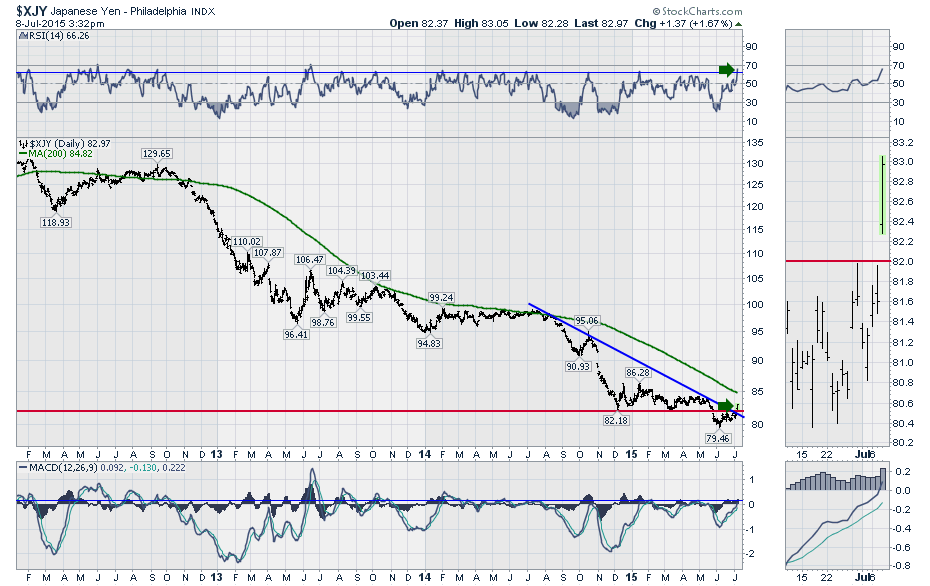
The Japanese Yen ($XJY) gapped above resistance and the major down trend that has been in place for years. The real question is if this is a interim low in the Yen or a much more important low... Read More
Don't Ignore This Chart! July 07, 2015 at 10:33 AM
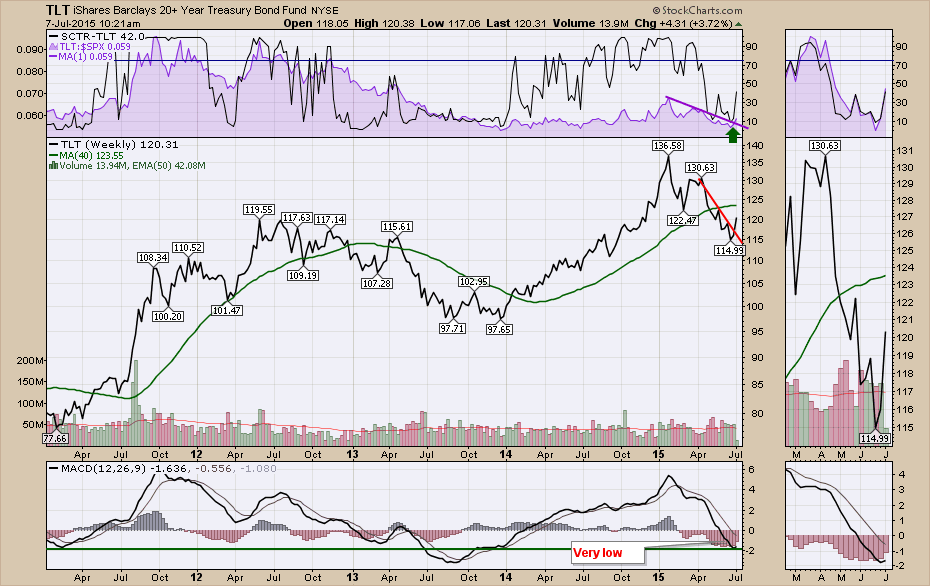
The news in Greece has turned a few charts. The news from China is equally newsworthy. The chart of the TLT is one of the most sensitive as it potentially shows investors looking for safety in US treasuries... Read More
Don't Ignore This Chart! July 06, 2015 at 02:44 PM
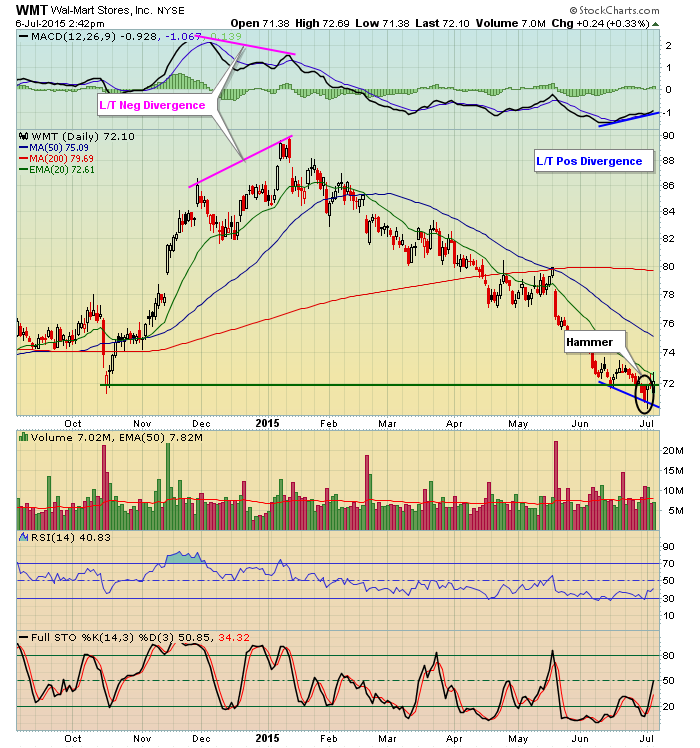
Wal-Mart Stores (WMT) has been under tremendous selling pressure since it topped at an all-time high near 90 back in early 2015. The selling began after a long-term negative divergence printed during the second week of the year... Read More
Don't Ignore This Chart! July 03, 2015 at 07:41 PM
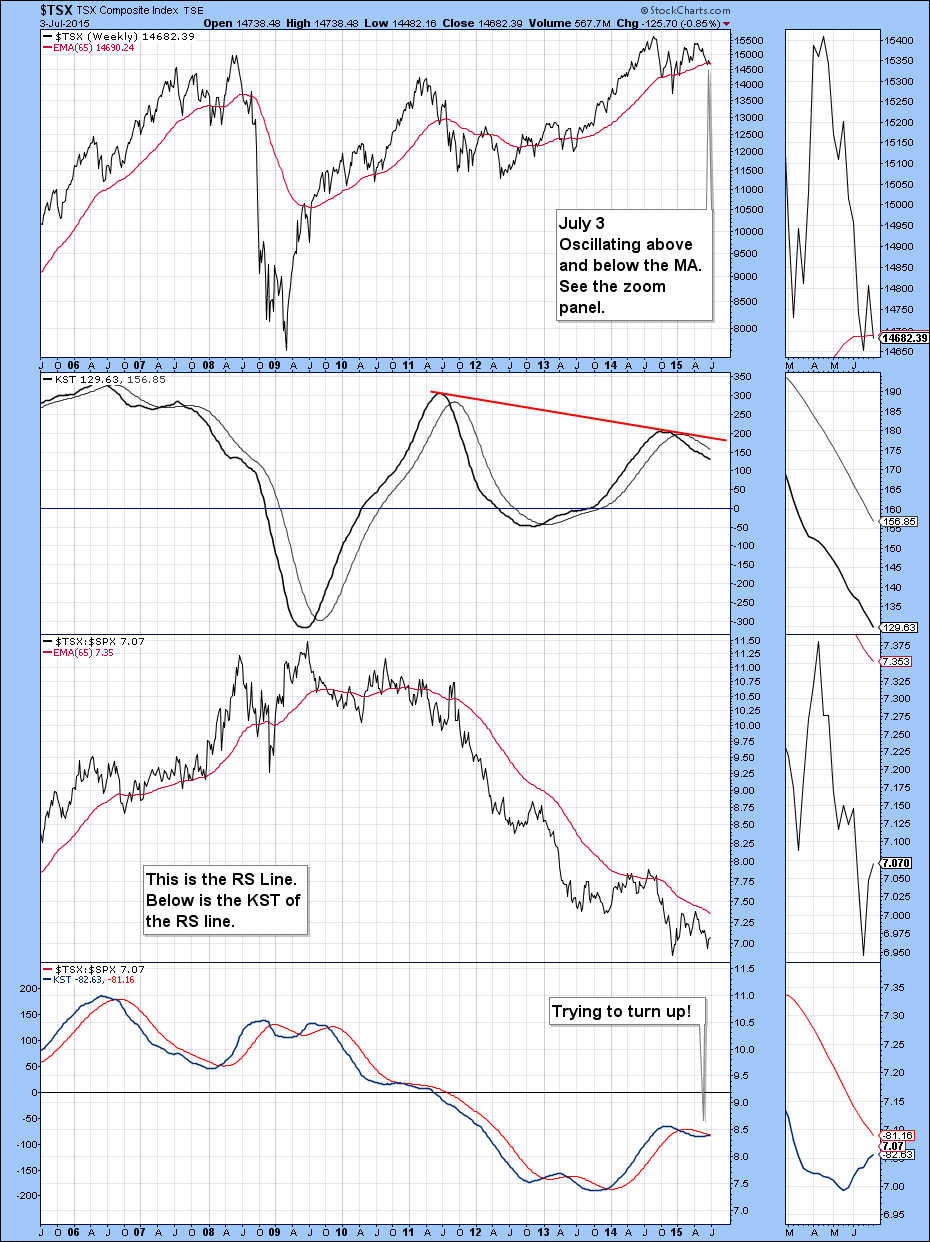
The Toronto Stock Exchange was open Friday while the US markets celebrated Independence Day. So it was a potential candidate for the Don't Ignore This Chart blog anyway. However, after using Martin Pring's Nirvana settings, it really is an important time to look at the $TSX... Read More
Don't Ignore This Chart! July 02, 2015 at 10:47 AM
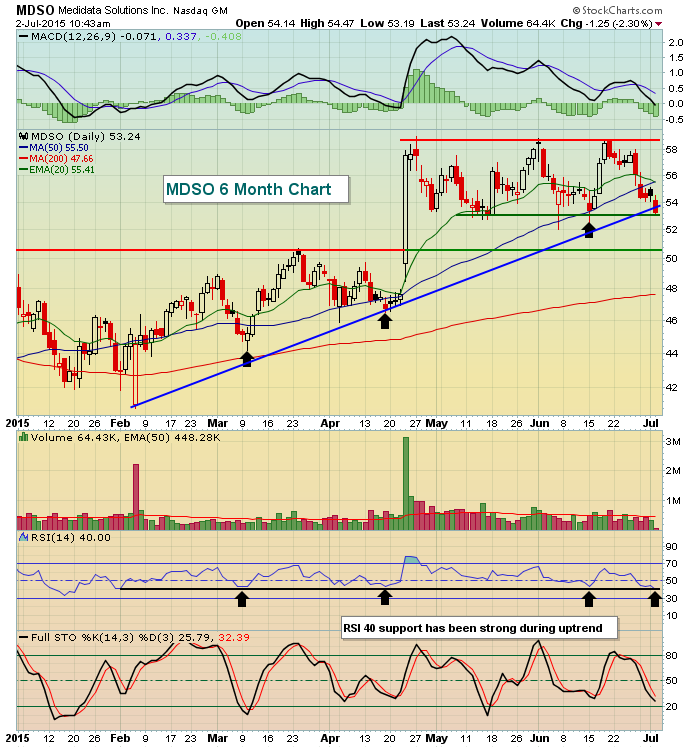
Medidata Solutions (MDSO) posted better than expected revenues and EPS in late April and the stock exploded higher as a result. Since that time, MDSO hasn't been able to add to those gains, instead consolidating in rectangular fashion with its RSI dropping to 40... Read More
Don't Ignore This Chart! July 01, 2015 at 10:56 AM
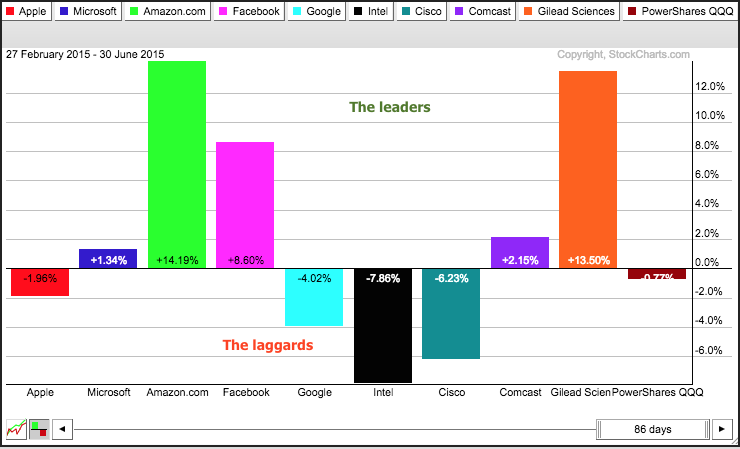
A look at performance for the top holdings in the Nasdaq 100 ETF (QQQ) explains a lot about performance since March. The PerfChart below shows the percentage change for QQQ and its top nine holdings... Read More
Don't Ignore This Chart! June 30, 2015 at 08:02 PM
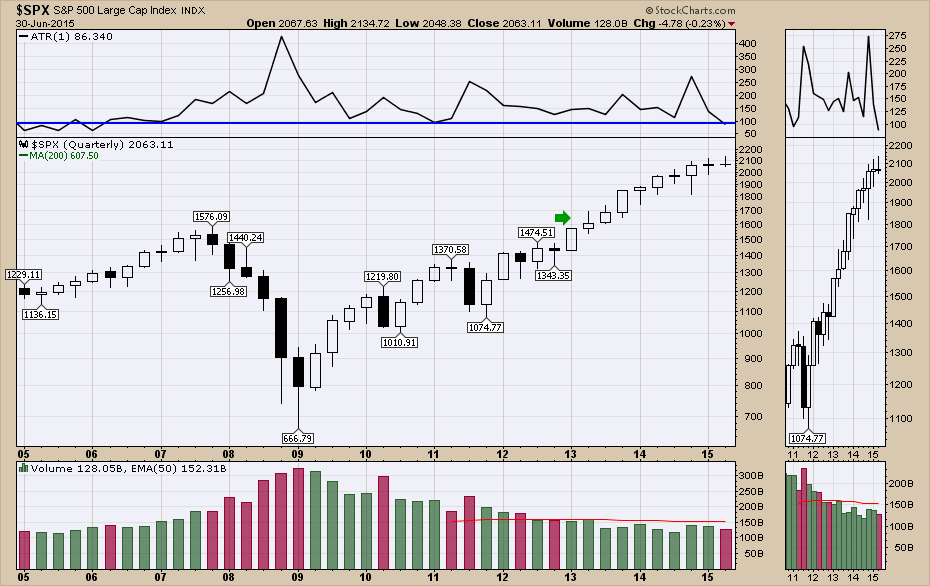
The $SPX has been moving in a tight range for the last six months. In December 2014 we closed at 2059, in March 2015 we closed at 2067, in June we closed at 2063. Quarterly data can take a lot of the weekly machinations of the market and make it look more normal... Read More