Hello Fellow ChartWatchers!
Is the market too expensive right now? Our P/E ratios for the various market indexes can show you the answer to that question. Currently, we have P/E values for the following indexes:
- The Dow (!PEDOW)
- The S&P 500 (!PESPX)
- The S&P 100 (!PEOEX)
- The Nasdaq 100 (!PENDX)
These symbols are updated on a daily basis after the market closes. Basically, we add up all the prices (i.e., closing values) for each stock in those groups and then we divide that total by the total of the TTM Earnings value for each of those stocks. We store the results in the appropriate database and voila!
OK, so let's chart these bad boys and see what they can tell us about current market conditions:
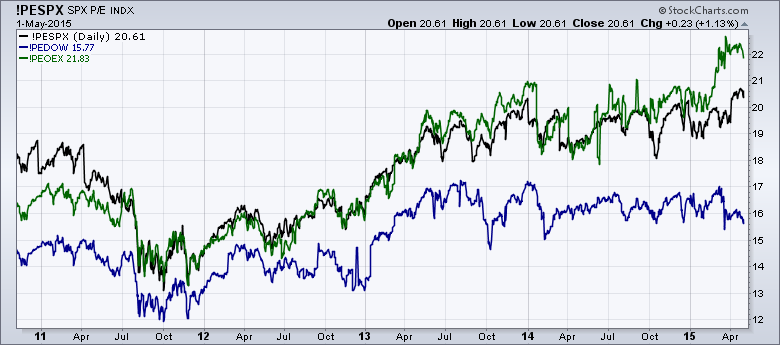
This chart shows the P/Es for the Dow, the SPX and the OEX going back to late 2010. Unfortunately, if we go back much further, things start to get jumbled due to the echos of the 2008 Financial Crisis. Late 2010 is where these charts start to become useful again. In addition, you'll notice that I've left off the Nasdaq 100 P/E graph. The Nasdaq 100 P/E numbers are much higher than these P/E numbers and that makes sense considering the higher P/Es of the companies than make up the tech-heavy Nasdaq.
So what is this chart telling us? First off, the P/E for the S&P 100 (green line) has recently surged up to around 22 - higher than it has been in quite some time. Similarly, the P/E for the entire S&P 500 (black line) has also moved higher recently and is retesting the high it set at the start of 2014. Finally, the P/E for the Dow Industrials (blue line) has been treading water for months now and is actually towards the bottom of its recent range.
So how does this compare the "historical norms?" Well, unfortunately, our historical data for all of these symbols only goes back to the middle of 2004 (and, as I mentioned, the data from 2008-2010 is jumbled). Here's a chart of the pre-Crisis years:
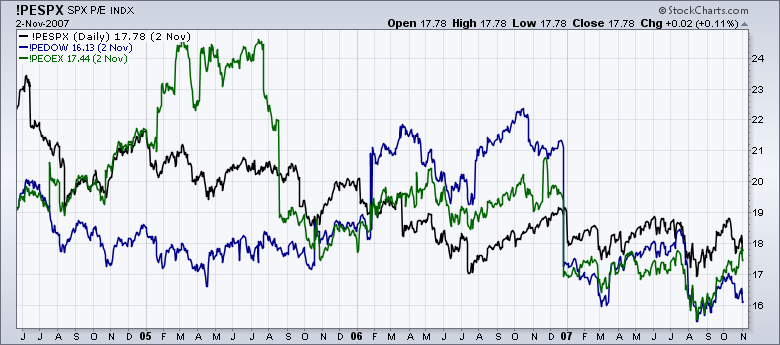
So we can see that - under "normal" conditions - the OEX P/E has been as high as 25 and the Dow P/E has been as high as 22.5 which suggests that the current P/E values for those indexes are not unusually high at all.
There's good news with respect to historical data for the S&P 500's P/E chart. We have data for its P/E ratio going back all the way back to 1926(!). You can see several historical charts of the S&P 500 and its P/E ratio in our Historical Chart Gallery - yet another "hidden gem" on our website. Here's the current version of the S&P P/E ratio chart (click to see the full-scale version):
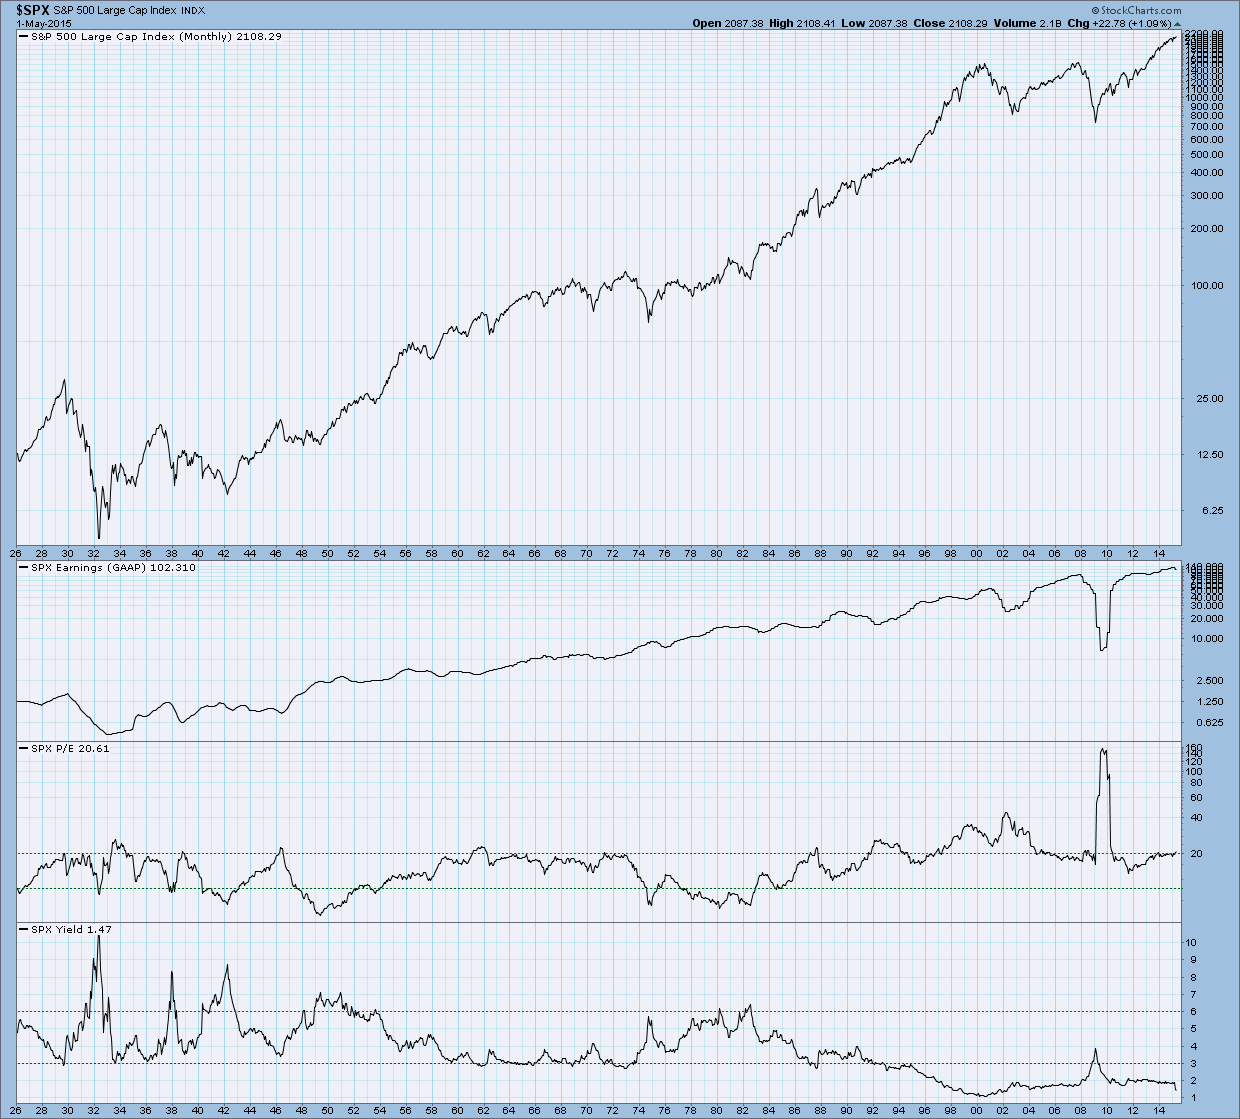
On this chart, the S&P 500's P/E ratio is the second line from the bottom of the chart. You can see that - excluding the Financial Crisis - the number has stayed near 20 since 2004. You can also see that it hovered near 20 for the entire 1960s. Based on this chart, I think it is fair to say that 20 is the "new normal" for the S&P 500's P/E ratio. Given that, the current value (20.61) seems fine. Looking at the data around the time of the "Dot Com" bubble, it looks like readings above 30 would be cause for concern.
Here's a list of the other P/E ratio datasets that we track. Next time, I'll drill down into the Sector P/E charts!
- Chip
SITE NEWS
RECENT ADDITIONS TO STOCKCHARTS.COM
WELCOME INDIAN INVESTORS!
Today marks the official launch of our Indian Stock Market service. Now Indian investors have full access to the power of StockCharts.com charts and analysis. We now track over 1000 NSE-based stocks and over 30 India-specific market indexes. All Indian stocks have ticker symbols that end with the suffix ".IN" - Here's a link to a complete list of all the NSE symbols we now provide.
In addition to creating high-quality technical charts for NSE stocks and indexes, Indian investors can also create and run technical scans (screens) and technical alerts based on Indian data. And very soon, we will begin publishing our very popular SCTR ranking values for NSE stocks!
Finally, we are thrilled to also announce the start of a new commentary blog dedicated to Indian markets and Indian investors. The new blog is called "Analysing India" and it is written by Vipul Ramaiya. Be sure to read Vipul's first article to learn more about his background and his plans for the blog going forward. Welcome aboard Vipul!
If you have any interest in Indian markets or Indian stocks, please help us spread the word! Tapping into the Indian market is a big challenge and we would appreciate any help you can give us. Forward this email to anyone you know that has any interest in Indian investing at all. We want as many people as possible to use our website.
Finally, the month of May is the perfect month to let other people know about StockCharts.com because...
> > ANNOUNCING OUR 2-FOR-1 REFERRAL SPECIAL! < <
As many of your know, we have always had a reward for members that refer new subscribers to StockCharts.com. For each new subscriber that you refer to us, we usually give you one free month of additional service. Over the years, this program has resulted in literally tens of thousands of free months gratefully given to our subscribers.
This month, everything changes...
Well, OK, not everything... just the number of months that you get for each referral. During the month of May, you can earn TWO FREE MONTHS of service for every new member that you refer to our website! Depending on your service level, that could be worth up to $100!
There is no limit to the amount of free time you can earn via referrals. And with the recent additions of Indian and London data to our website, members in the UK and Indian should be able to easily collect lots of additional free time!
HERE'S HOW IT WORKS:
- Tell your friends/acquaintences/family members/investing club/random-people-on-the-street all about StockCharts.com and how it has helped your investing results.
- Convince them to join any of our paid services (Basic, Extra, ExtraRT, or PRO) for at least one month.
- Tell them to enter your UserID (i.e., your email address) into the box at the bottom of the "Terms of Service" agreement that appears when the login to their new account for the first time.
- Wait one month. (We have to make sure they don't cancel their account.)
- Your account will automatically be credited with TWO free months of additional service. You'll get an email informing you when this happens.
What could be easier? (No, seriously, let us know if there's anything we can do to make this easier. We want as many referrals as humanly possible.)
The Market Message
Please visit The Market Message for John's latest article.
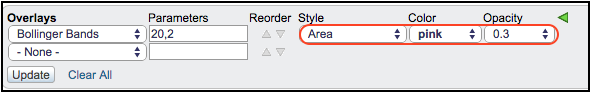
The Finance SPDR (XLF) has become the most boring of the nine sector SPDRs over the last five weeks. Boring today does not mean it will be boring tomorrow though. The chart below shows the Finance SPDR (XLF) surging to new highs in December, bouncing around in January-February and then moving into a narrowing range. The pink shaded area shows the Bollinger Bands in area format and the distance between the bands is the narrowest in years. We can quantify this by adding the BandWidth indicator, which is at its lowest level in years as well. The low Bandwidth tells us that volatility is contracting and chartists should prepare for a volatility expansion. I
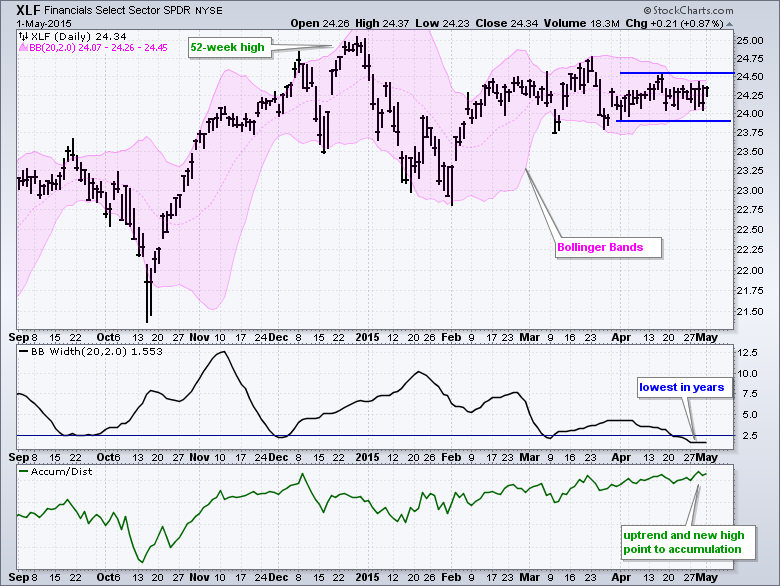
Bollinger Bands do not give us a directional bias so chartists should turn to the price action and indicators for a signal. The bottom indicator shows the Accumulation Distribution Line (ACDL) moving to a new high last week. This is rather interesting because it points to accumulation within this trading range, and this favors an upside breakout. The blue lines mark the April range and my support-resistance levels. Look for a break above the mid-April high for a bullish signal and a break below the early April low for a bearish signal. StockCharts users can click this chart to see the settings and save it to their favorites list. You can read more about Bollinger Bands and the Accumulation Distribution Line in our ChartSchool articles.
Thanks for reading and have a great weekend!
Arthur Hill CMT
ARE BONDS ABOUT TO TAKE A MAJOR DIVE?
by Greg Schnell | The Canadian Technician
The long bond price looks to be at a level of major reversal. Diving into the chart, we can see that the PPO is at another one of the extreme levels in the entire 30 year bond run. The extreme reading on the MACD is not as clear a signal because the MACD will form higher waves as the price moves higher. The PPO is a percentage oscillator. It shows us when there is an extreme percentage price move. So a 4% move on the PPO is significant throughout the time frame of the chart. The bond price bottomed out in 2014 after a nice divergence showed up on both the PPO and the MACD. Chart 2 shows a zoomed in version.
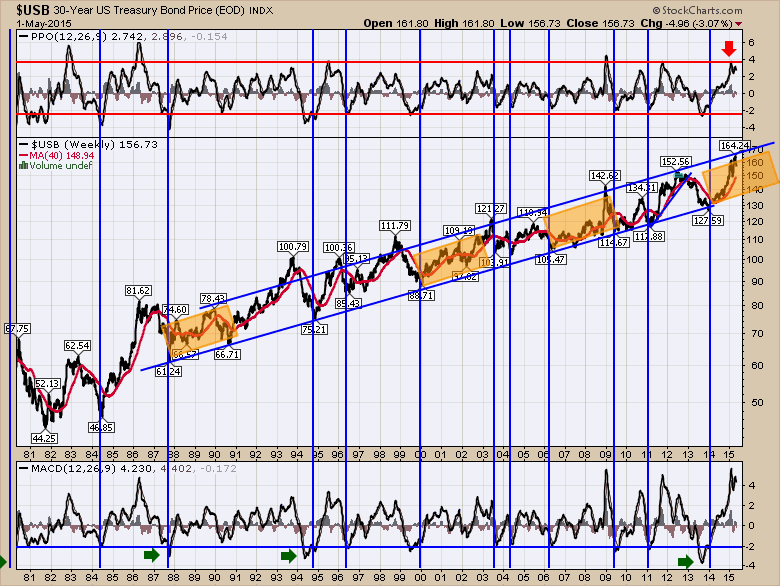
Chart 1
Notice the positive divergence on the $USB price in January 2014 on Chart 2. Now in April 2015, we have a typical negative divergence.
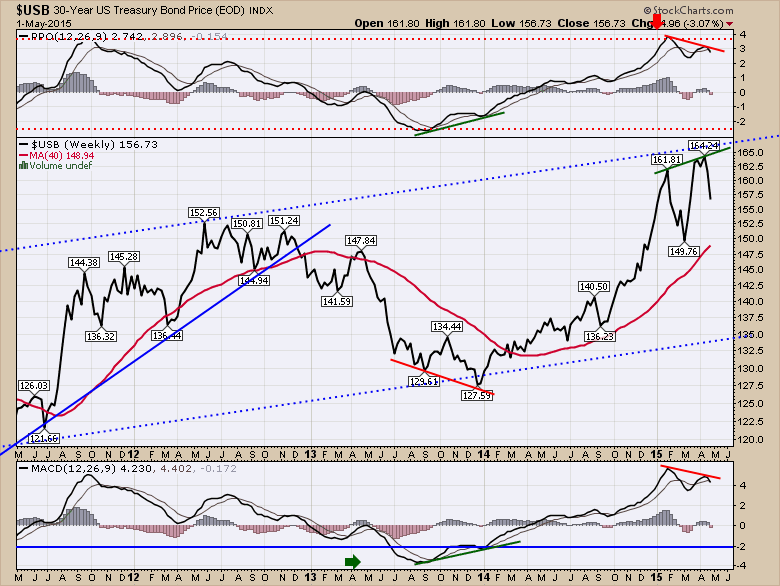
Chart 2
For a foreign investor, this reversal in bonds is a problem. However, this also coincides with the reversal in the $USD. If the $USD rolling over is added in, the bonds will lose value much faster to create losses very quickly.
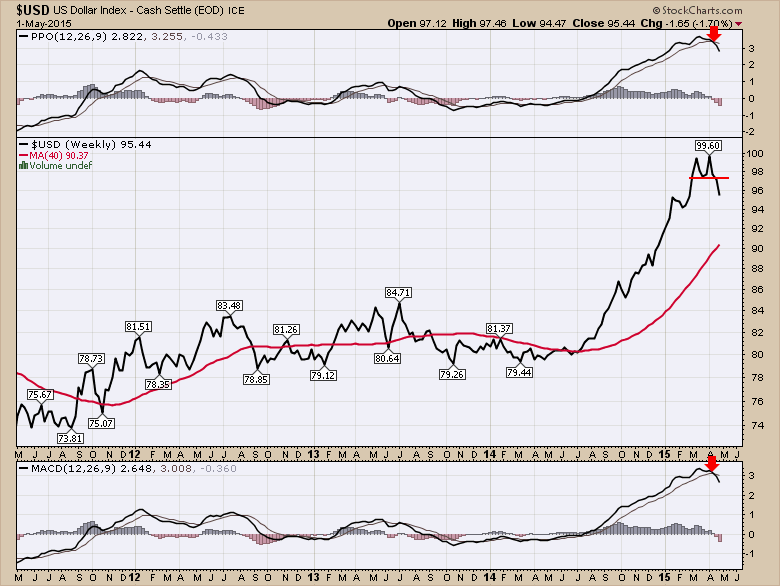
Chart 3
The main problem here is that no one expects the bonds to sell off, whereas a year ago, no one expected the bonds to be the upcoming trade of the year.
I expect the bonds to retrace quickly as foreign bondholders abandon their positions. We'll see if that happens. Investors would buy TBT to try to profit in this trade. Foreign investors will have trouble making money in a TBT trade if the $USD is falling. This is a trade for US investors. Because of all the global turmoil, this could reverse but it looks to me that the signals are clear at this point in time. As always, an exit strategy is as important as an entry strategy.
Good trading,
Greg Schnell, CMT
ULTRA-SHORT TERM SPIKES BULLISH
by Erin Heim | DecisionPoint.com
Last week was not only an interesting for price, ultra-short-term indicators finally woke up. With indicators staying mostly mum this week, it was exciting to see movement in the shorter-term.
Below is a chart of our ultra-short-term indicators taken from the DP Chart Gallery (available free here). When observing our ultra-short-term indicator chart, we look for climactic movement, that is, spikes in one direction or the other. In the case of the chart below, on Thursday we saw spikes on the Climactic Volume Indicator (CVI) and Participation Index - DOWN. You will also notice in the thumbnail that the VIX moved just outside its band. This was an exhaustion climax as it signaled selling fatigue.
I'd also like to point out the short-term price pattern of a rising trend channel. I've been watching the development of a bullish ascending triangle, but price is now getting too close to the apex which dulls the pattern's outcome. I say this because at the apex, it wouldn't require significant price action for it to breakout of the pattern. It could even end up drifting through. Upon further inspection, I decided that a rising trend channel was a better descriptor of what the market is doing in the shorter-term.
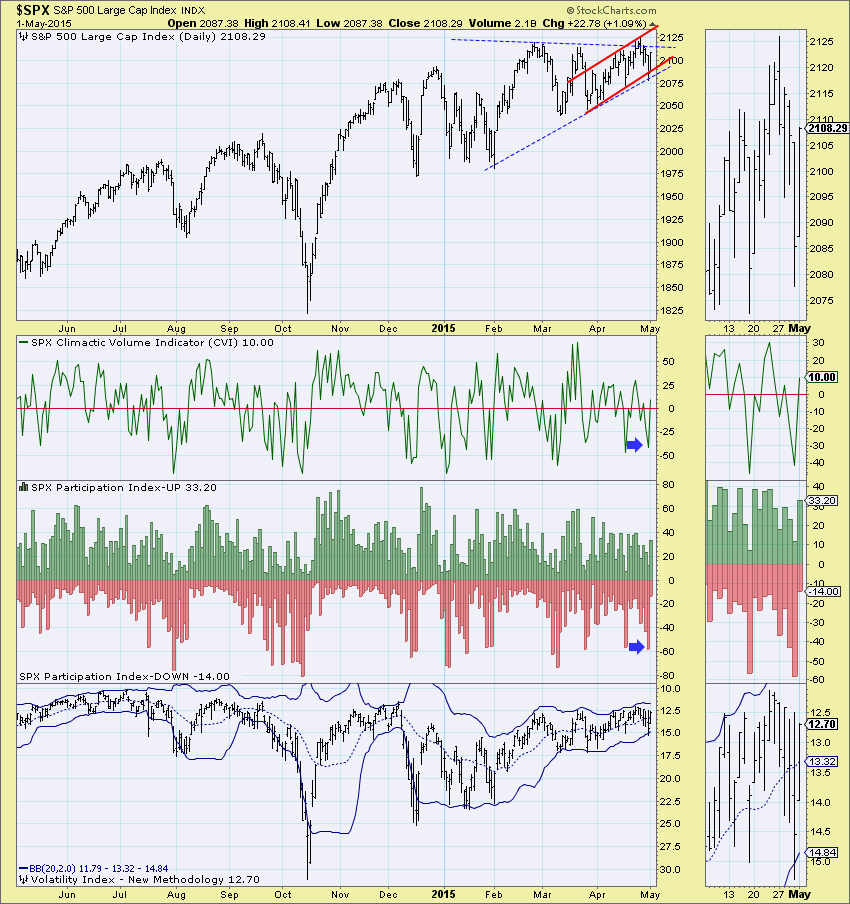
Our short-term indicators all bottomed in recently "oversold" territory. True oversold territory would be at the lows around -40. In the context of a short-term rising price trend, it's bullish.
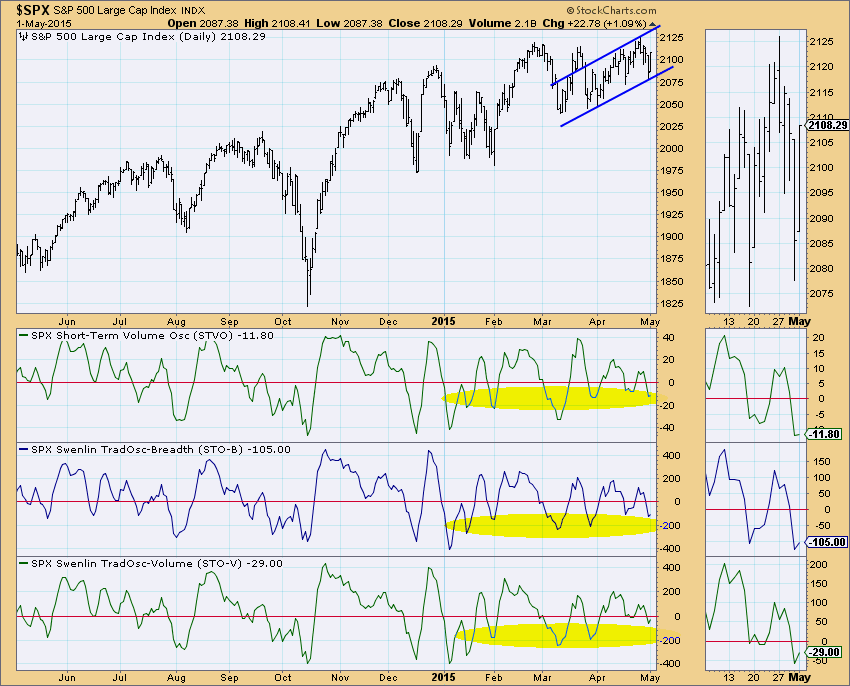
Based on these shorter-term indicators and the identifiable rising trend channel, a test of the top of the channel is likely on the agenda.
Happy Charting!
Erin
PLACE YOUR WAGERS PLEASE
by Tom Bowley | Trading Places
It's Kentucky Derby Day so of course! Oops, wrong blog! :-)
We know that the stock market goes through periods of consolidation and rotation. Groups that lead for a period of time eventually fall out of favor as new groups emerge as leaders. Then we rinse and repeat. So the question is whether it's time for the Dow Jones U.S. Gambling Index ($DJUSCA) to "repeat" because they are thoroughly rinsed, downright soaked, at this point. On March 7, 2014, the DJUSCA hit an all-time high at 1096.46. From that point through Friday's close, the DJUSCA had fallen over 420 points, or 38.4% in 14 months. This drop occurred while the benchmark S&P 500 index was rising more than 12%. Check out the diverging charts of these two since March 2014:
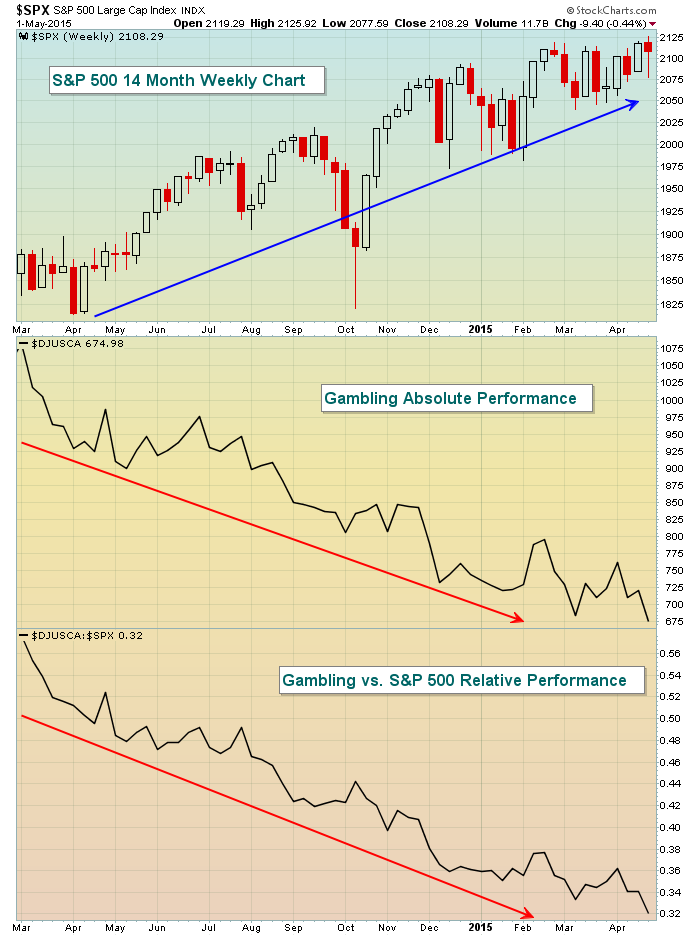
What would ever compel you to consider buying anything to do with gambling stocks? According to this chart, not much. However, this is a snapshot of the last 14 months and doesn't tell the entire picture. For instance, prior to this 420 point drop, did you know that the DJUSCA gained 153% in just 20 months? Did you also realize that the DJUSCA is currently hitting long-term trendline support, relative strength support, while at the same time printing a long-term positive divergence on its weekly chart? Perhaps stepping back and looking at the big picture would provide us a completely different picture. See what you think:
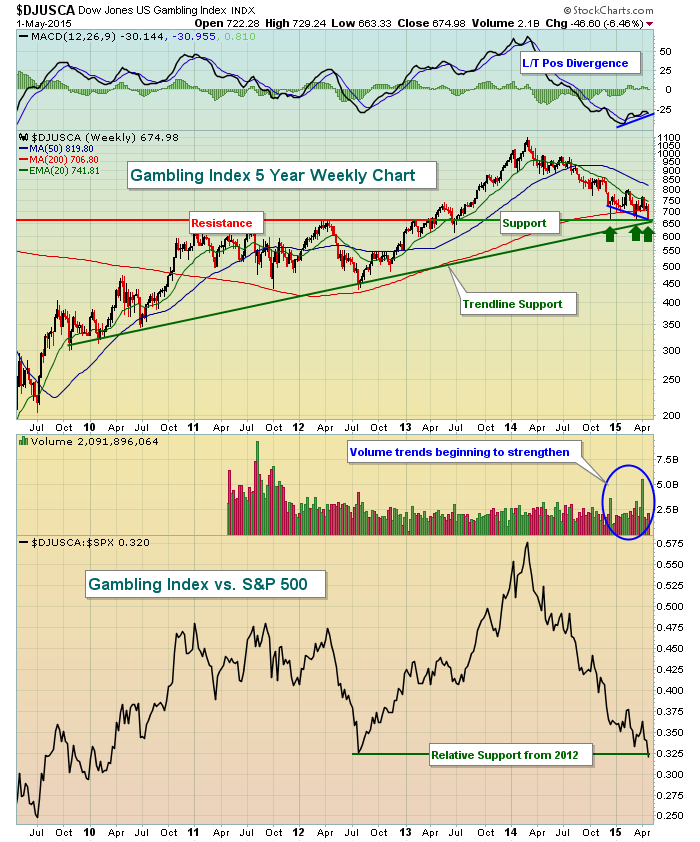
Now you might look at this chart and still decide to stay away from this group. But you have to admit the long-term weekly chart gives us a much different perspective. I always like to have a solid reward to risk scenario and I believe the DJUSCA certainly gives me one at current prices. While it may be a "longshot" on Derby Day, I believe gambling stocks are moving closer and closer to a solid entry point.
By the way, I'm taking Firing Line (#10) over Dortmund (#8) in the Run for the Roses!
Happy trading and enjoy your weekend!
Tom
DO EARNINGS REALLY MATTER?
by John Hopkins | InvestEd Central
And the answer is...You bet!
Why do earnings reports matter? Because it gives investors a quarterly snapshot of how a company is performing and what they can look forward to down the road. And when you stop to think about it, when you filter out everything else out there going on day to day, just about the only thing investors care about is a company's bottom line.
All of us have seen instances where a company comes out with earnings that blow away expectations only to see the stock tank after hours. But that usually happens when, a)The market has already priced in blow out numbers and/or b)The company lowers its earnings forecast for the future. But, the combination of strong earnings plus a strong going forward forecast is generally bullish for a stock.
Now, to take this even further, imagine a company reports strong earnings, raises its forecast for the future PLUS has a strong technical chart. THAT is the type of company you want to invest in because they've demonstrated actual success plus guided forward plus show technical strength, giving the company the edge in even weaker market environments.
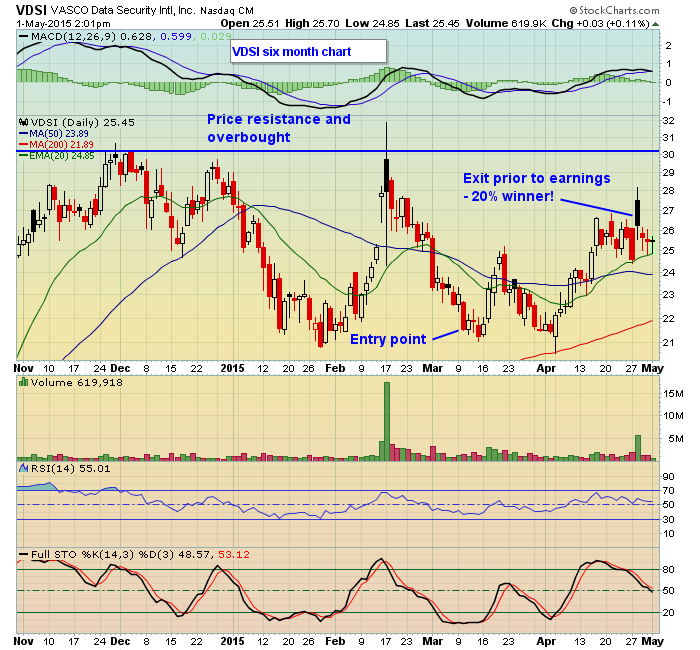
Here's a a perfect example below of what I'm talking about and one of the stocks we put on our "Candidate Tracker" at EarningsBeats.com on February 17. It made our list because it beat earnings and we liked the way the chart looked. BUT that wasn't the best time to enter the stock as it was up against price resistance and was technically overbought. Instead we remained patient and suggested an entry at $21.54 three weeks later with a closing stop of $17.75 and a target of $30, We removed it from our Watch List near $26 and just before earnings were reported, so a nice 20% winner!
The point is, the combination of strong fundamentals and strong technicals can be potent. In fact, I want everyone to get a chance to see what I'm talking about by offering a "One Week Pass" so you can explore the Earnings Beats site, check out our full Watch List and our new "Candidate Tracker" feature that currently has almost 100 stocks that fit the initial criteria of beating earnings plus strong charts. Just click here to get your pass!
At your service,
John Hopkins
President
Invested Central/EarningsBeats.com

I just read The Buy Side, Turney Duff's book about his years as the biggest and most successful healthcare hedge fund manager on Wall Street. Let me say up front that I am not reviewing or endorsing the book or its content in any manner. In fact, I'm certain that I'll take heat from my trading buddies for even acknowledging this particular Wall Street insider's sordid story...
Read More


 I just read The Buy Side, Turney Duff's book about his years as the biggest and most successful healthcare hedge fund manager on Wall Street. Let me say up front that I am not reviewing or endorsing the book or its content in any manner. In fact, I'm certain that I'll take heat from my trading buddies for even acknowledging this particular Wall Street insider's sordid story...