Art's Charts January 29, 2016 at 10:42 AM
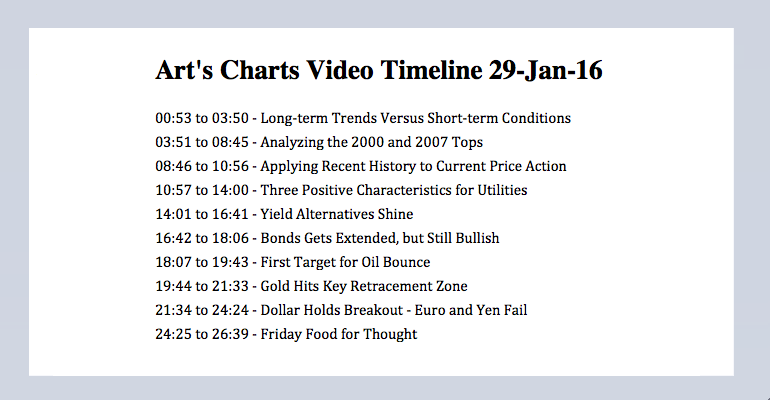
Long-term Trends Versus Short-term Conditions // Analyzing the 2000 and 2007 Tops // Applying Recent History to Current Price Action // Three Positive Characteristics for Utilities // Yield Alternatives Shine // Bonds Gets Extended, but Still Bullish // First Target for Oil Bounc... Read More
Art's Charts January 28, 2016 at 08:28 AM
Small-caps and Large-techs Lead Lower // SPY Fails to Follow Through // QQQ Nears 52-week Low // Dragonfly Doji versus the Hammer // Between a Huge Rock and a Hard Place (FDN, SMH, IGV, SKYY, IGN, XBI, ITB, KRE) //// QQQ and IWM Lead Lower Last week's hammers remain on the weekly... Read More
Art's Charts January 26, 2016 at 10:39 AM
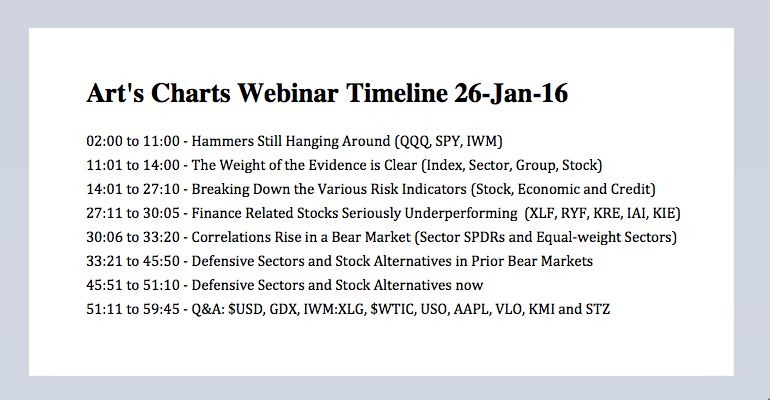
Hammers Still Hanging Around // The Weight of the Evidence is Clear // Correlations Rise in a Bear Market // Defensive Sector Performance in Prior Bear Market // Performance of Stock Alternatives in Prior Bear Market // Webinar Highlights //// Hammers Still Hanging Around There w... Read More
Art's Charts January 22, 2016 at 01:07 PM
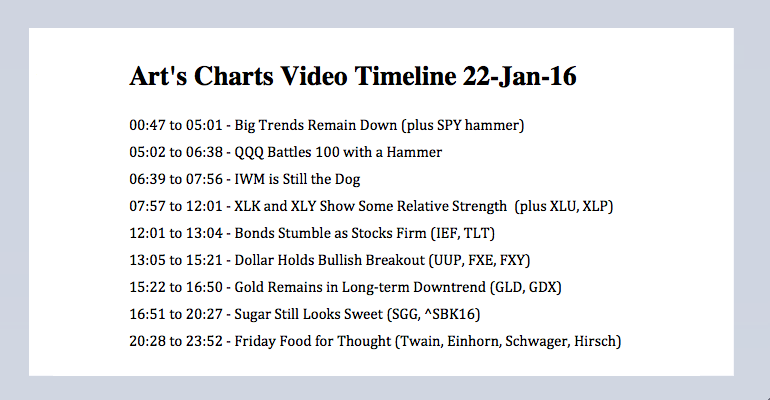
Big Trends Remain Down // IWM is Still the Dog // QQQ Battles 100 with a Hammer // XLK and XLY Show Some Relative Strength // Bonds Stumble as Stocks Firm // Dollar Holds Bullish Breakout // Gold Remains in Long-term Downtrend // Sugar Still Looks Sweet // Friday Food for Thought... Read More
Art's Charts January 21, 2016 at 11:07 AM
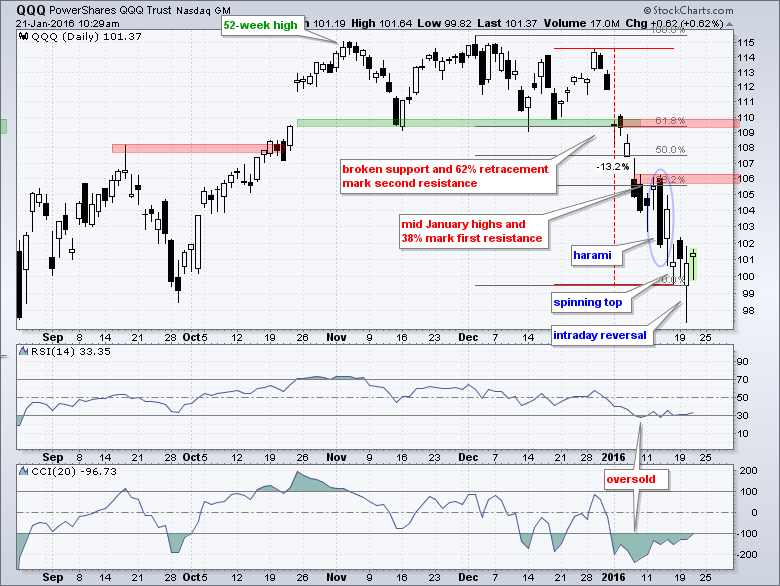
Candles Show Firming, but Closes say Otherwise // Trading Counter-trend Patterns and Signals in Bear Markets // Using Retracements to Anticipate Counter-trend Peaks // Understanding ZigZag Extensions //// Candles Show Firming, but Closing Prices say Otherwise There is certainly a... Read More
Art's Charts January 19, 2016 at 09:34 AM
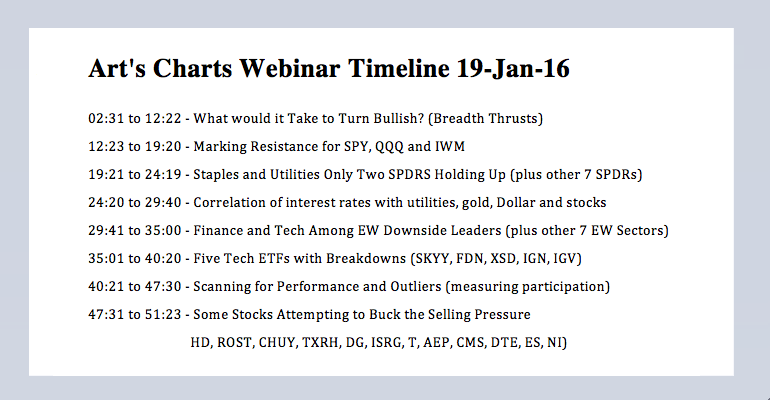
SPY Sets up Oversold Bounce // QQQ Firms with Spinning Top // What Would it take to Turn Bullish? // Finance and Tech Among the Downside Leaders // Webinar Highlights //// SPY Sets up Oversold Bounce // QQQ Firms with Spinning Top // What Would it take to Turn Bullish? // Finance... Read More
Art's Charts January 15, 2016 at 11:57 AM
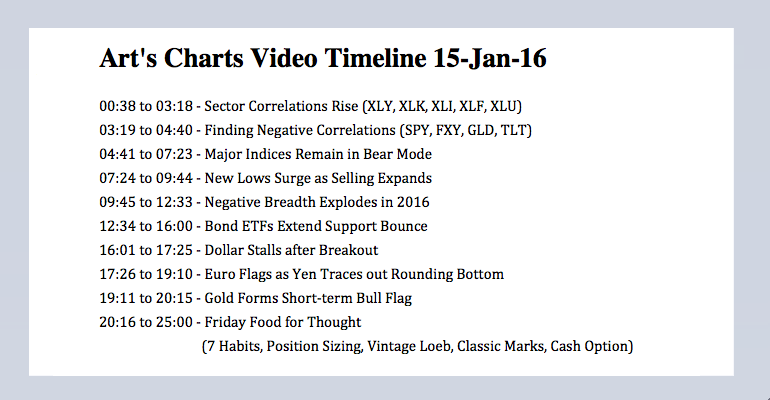
Finding Negative Correlations // Major Indices Remain in Bear Mode // New Lows Surge as Selling Expands // Bond ETFs Extend Support Bounce // Dollar Stalls after Breakout // Yen Traces out Rounding Bottom // Gold Forms Short-term Bull Flag // Friday Food for Thought //// Finding ... Read More
Art's Charts January 14, 2016 at 11:49 AM
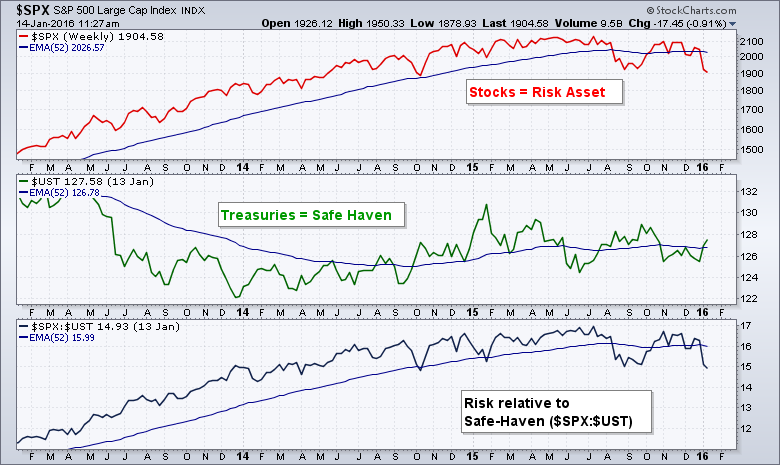
High Beta Stocks Versus High Quality Stocks // Equal-weight versus Large-caps // Small-caps versus Mega-caps // Charting the Economy with Four ETFs // Junk versus Investment Grade and Treasuries // TED Spread Surges // Charting the Financial Stress Index // Conclusions //// Intro... Read More
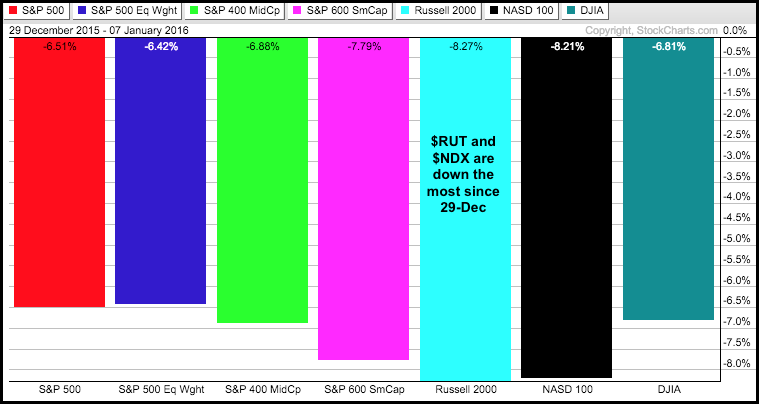
Art's Charts January 12, 2016 at 09:20 AM
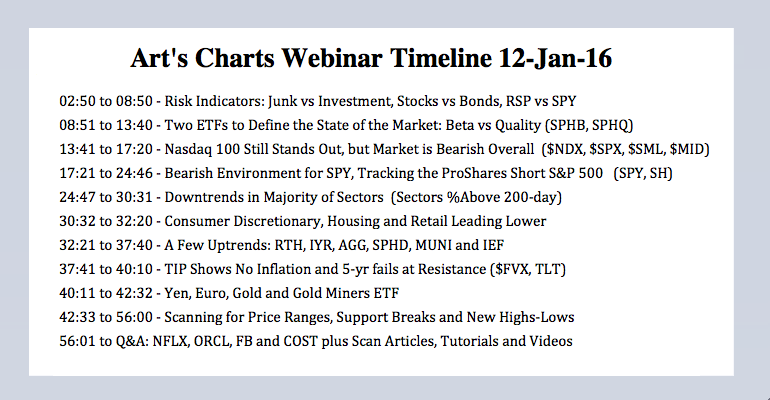
Nasdaq 100 Still Stands Out // Bearish Environment for SPY // Tracking the ProShares Short S&P 500 // Webinar Highlights (Scans!) //// Chartists can get an overview of the "market" by charting the S&P 1500, S&P 500, S&P MidCap 400, S&P Small-Cap 600 and Nasdaq 100 on one chart... Read More
Art's Charts January 08, 2016 at 01:07 PM
Large-caps Crack // S&P 500 Breaks 2K with Ease // IWM Hits 52-week Low // Using the Stochastic Oscillator to Gauge Price Levels // Small-caps and Mid-caps Lead New Low List // High-Low Percent Triggers for S&P 500 // IEF Holds Breakout as TLT Struggles // A Wild Ride for the Gre... Read More
Art's Charts January 07, 2016 at 09:40 AM
Don't Blame China for December // Sector Shift Defines Large-cap Breakdown // Industrials and Finance Leading Lower // XRT and ITB Break Down Further // Gold Miners ETF Bounces off Support // Treasuries Surge and Outperform //// Don't Blame China for December Stocks extended thei... Read More
Art's Charts January 05, 2016 at 10:50 AM
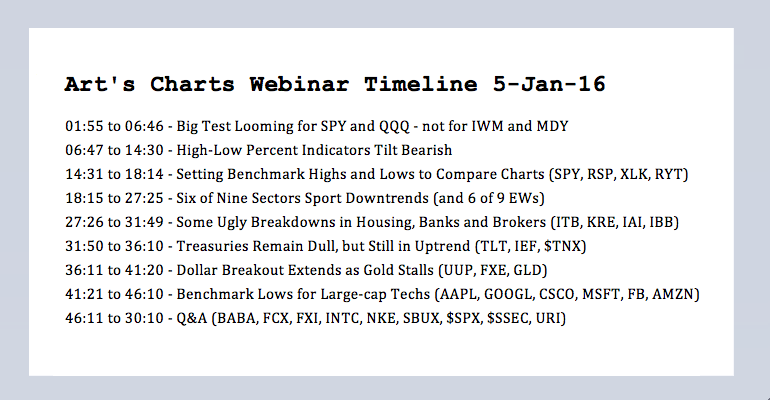
A Tale of Two S&P 500 Indices // The Last Three Sectors Standing // Sector Breadth Tilts Bearish // Index High-Low Indicators Remain Split // Short-term Bullish Signal for Dollar // Treasury Trading Turns Dull // Webinar Video //// The easiest way to visualize the current split i... Read More
Art's Charts January 04, 2016 at 07:06 AM
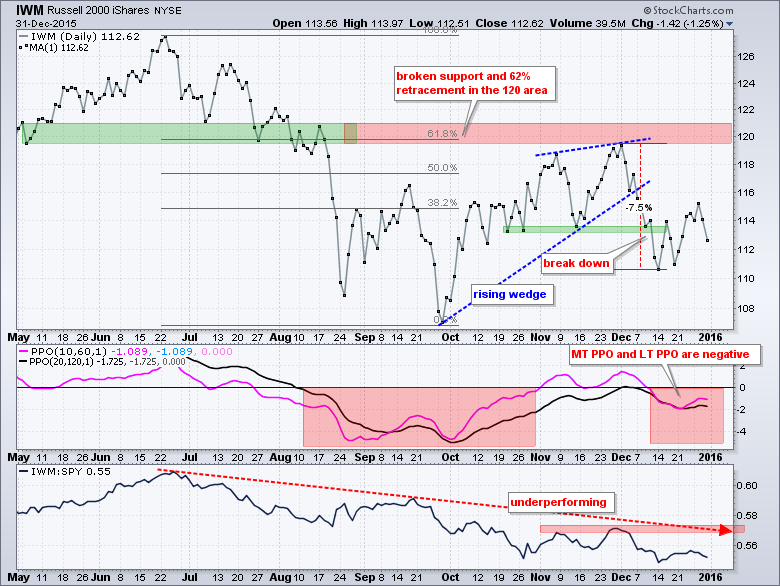
Once again, we have small-caps and mid-caps breaking down and weighing on the market. This is nothing new because the Russell 2000 iShares (IWM) and S&P MidCap SPDR (MDY) have been lagging the S&P 500 SPDR (SPY) and Nasdaq 100 ETF (QQQ) for the last six to nine months... Read More