Art's Charts May 30, 2018 at 07:43 AM

Small-caps and Large-Techs Still Leading. IJR Holds above Breakout Zone. QQQ Falls Back into Pennant. Six Flags over the Nasdaq 100. Strike One on SPY. Selling Pressure Concentrated in Large-caps. On Trend Highlights..... Read More
Art's Charts May 29, 2018 at 07:21 AM

Is the Dollar Strong or the Euro Weak? Yen Bounces as Euro Falls. A Big Surge for Treasuries. Gold is Oversold in an Uptrend. Italy and Spain Lead Europe Lower. Looking for International Indexes? On Trend: Tuesdays at 10:30 AM ET. Dollar Strength or Euro Weakness? ..... Read More
Art's Charts May 25, 2018 at 09:46 AM

SPX New Highs Continue to Drag. Triangle Breakout Holds. Bulls and Bears Fight to Go Nowhere. Watching the Swing within the Wedge. IJR Holds above Breakout Zone. QQQ and XLK Form Tight Consolidations. XLF Stalls Near April High. XLI Stays Strong as XLV Hits Make-or-Break Level... Read More
Art's Charts May 23, 2018 at 06:51 AM

The Last Thing You Expect .... Another Ominous Wedge Takes Shape. $SPX-$SML Correlation is High. QQQ Shows Short-term Weakness. Regional Banks Outperform Big Banks. Highlights from On Trend. The Last Thing You Expect .... ... is probably what will happen... Read More
Art's Charts May 18, 2018 at 09:41 AM

The Mother of all Double Bottoms. The Shifting Relationship between Stocks and Bonds. S&P SmallCap iShares Hit New High. Small-caps Lead Breadth Indicators. S&P 500 Pauses Near Breakout Zone. Materials and Industrials Show Upside Leadership... Read More
Art's Charts May 17, 2018 at 07:29 AM

Materials Sector Leads in May. Metals & Mining SPDR Breaks Out of Consolidation. Steel Dynamics, Allegheny and Reliant Lead Group. The Long Correction in Copper. Copper Miners ETF Challenges Resistance. Continuous Commodity Contracts are Mixed... Read More
Art's Charts May 16, 2018 at 05:17 AM

Ranking Sectors by High-Low Percent. Sector SPDR Chart Analysis (big wedges). Oil and Energy-Related ETFs Continue to Work. 10-yr T-Yield Turns Back Up. Winners and Losers in Rising Rate Environment. Stocks: TSLA, DHR, NKE, ROST, SYK, UNH... Read More
Art's Charts May 14, 2018 at 11:01 AM

Biotechs Perk Up. Average-Cap XBI versus Large-cap IBB. IBB Surges off Support. XBI Holds Above Support. Health Care SPDR Bounces off Retracement Zone. Biotechs showed some upside leadership with a big surge last week, most of which occurred on Friday... Read More
Art's Charts May 11, 2018 at 08:21 AM

Weighing the Evidence. S&P 500 Breaks April High and Reverses Downswing. Small-caps Lead with New High. Small-caps are Really Really Small. Nasdaq 100 Leads New High List. Small-cap Sectors Lead. Tech, Finance and Industrials Dominate. Small-cap Industrials Sector Leads... Read More
Art's Charts May 09, 2018 at 06:18 AM

Banks Lead on Multiple Timeframes. Regional Bank SPDR Extends Upturn. Big Banks are Mixed. Wedge Corrections for JPM and MS. Small-caps Get Dollar Tailwind. Energy ETFs Break Out of Consolidations. Bond Market Breakdown Holds. Utilities Look Poised to Continue Downtrend... Read More
Art's Charts May 07, 2018 at 10:10 AM

One-Day Breadth Thrust. SOXX Surges off Support. Four Semiconductor Stocks to Watch. A Bollinger Band Squeeze for Akamai. Five Stocks to Watch: ABT, ACN, ANTM, HCA, SLB. One-Day Breadth Thrust..... Read More
Art's Charts May 04, 2018 at 09:29 AM

S&P 500 Caught in the Crossfire. SPY Reverses Upswing. Large-cap Tech Holds up Well. A Bull Flag in the S&P SmallCap iShares. Finance and Industrials Weigh. Healthcare Breakdown Tilts the Balance. Mind the Gap in Tech-Related ETFs. Oil Forms Bull Flag... Read More
Art's Charts May 03, 2018 at 04:15 AM

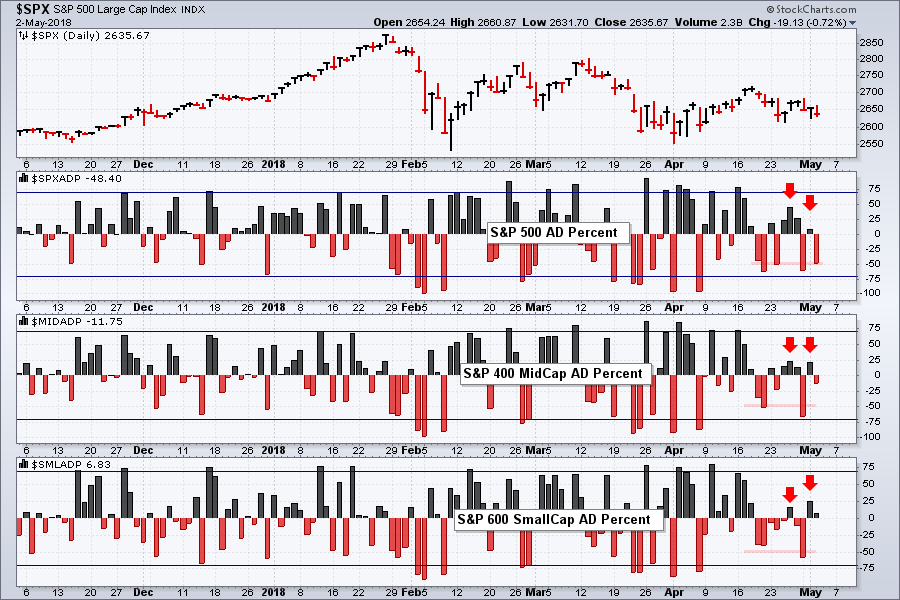
Breadth Falls Short. Chart Links and Video. Looking for a Breadth Thrust. Still a Correction? %Above 200-day Indicator Waffles. The Weight of the Evidence. Where to Find the Symbols... Read More