Art's Charts May 29, 2015 at 03:58 AM
Stocks sank on the open, but quickly firmed and rebounded somewhat in the afternoon. For the day, the major index ETFs finished fractionally lower, but the S&P SmallCap iShares (IJR) bucked a little with a fractional gain... Read More
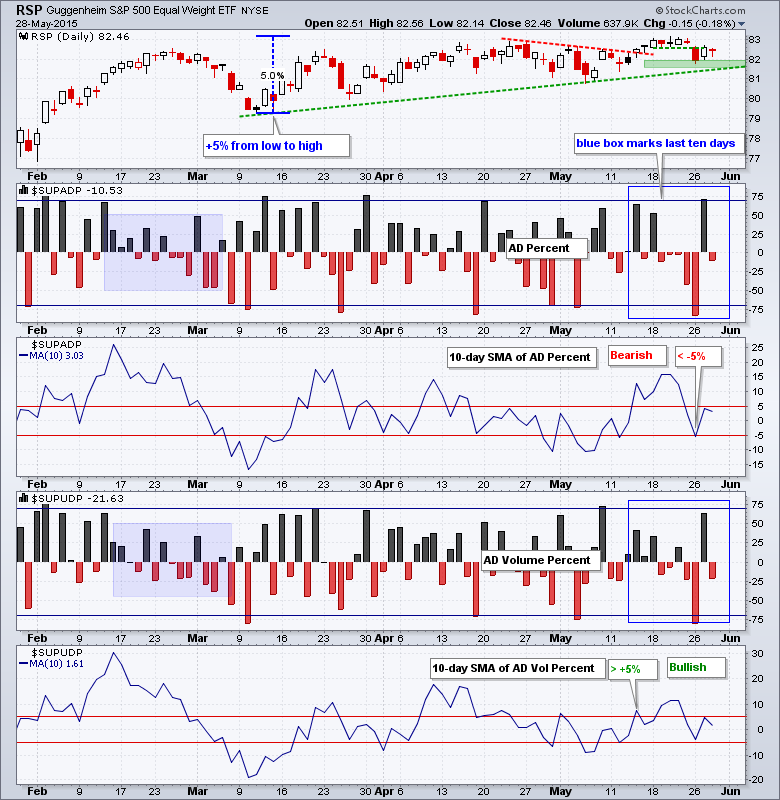
Art's Charts May 28, 2015 at 07:00 AM
Stocks swooned on Tuesday and then recovered most of their losses on Wednesday. Techs led the way as the Technology SPDR (XLK) hit a new high and QQQ closed at a new closing high. Semiconductors led the rebound as the Semiconductor SPDR (XSD) surged over 3% and hit a new high... Read More
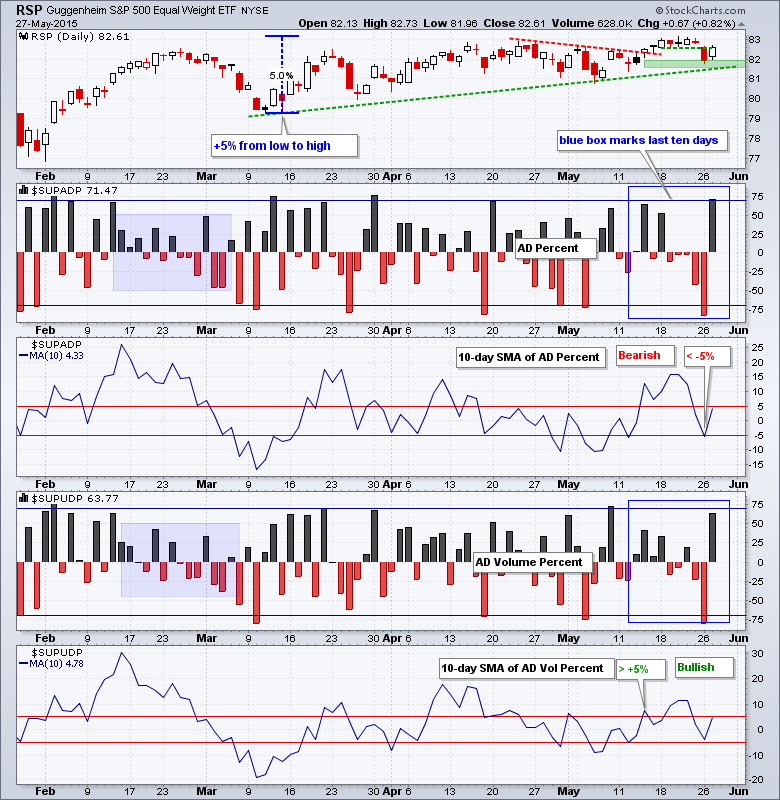
Art's Charts May 27, 2015 at 05:13 AM
Stocks fell with selling pressure across the board. The major index ETFs were all down around 1% and the declines were pretty even. All sector SPDRs and equal-weight sector ETFs were down. The Consumer Discretionary SPDR (-.71%) and the Utilities SPDR (-... Read More
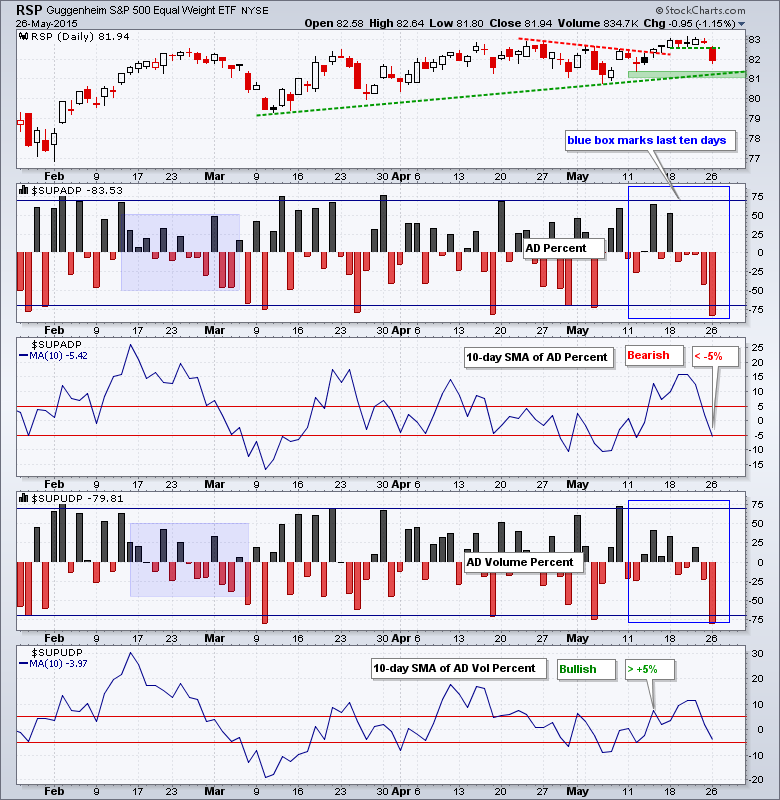
Art's Charts May 26, 2015 at 01:36 PM
The S&P 500 finished the week with a gain, but was hit with selling pressure in the final hour on Friday. For the week, the index surged on Monday and then traded flat from Tuesday to Friday. Small-caps led Friday's pullback as the Russell 2000 iShares (IWM) lost around .43%... Read More
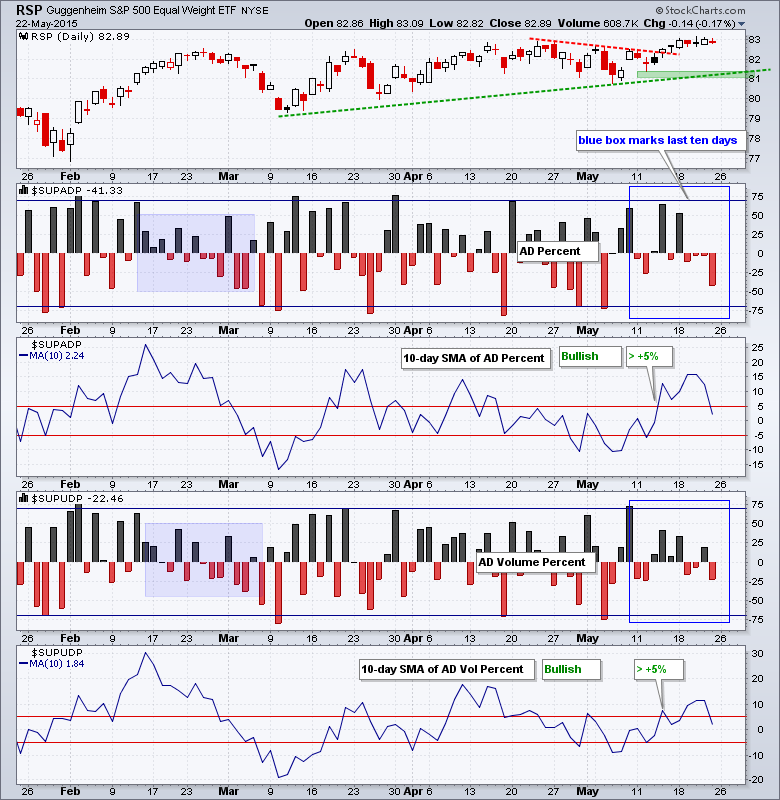
Art's Charts May 22, 2015 at 04:08 AM
The S&P 500 edged higher on Thursday, but market action was mixed overall. QQQ and SPY closed slightly higher, while IWM closed slightly lower. Seven of the nine sector SPDRs were up with energy, industrials and technology leading the way... Read More
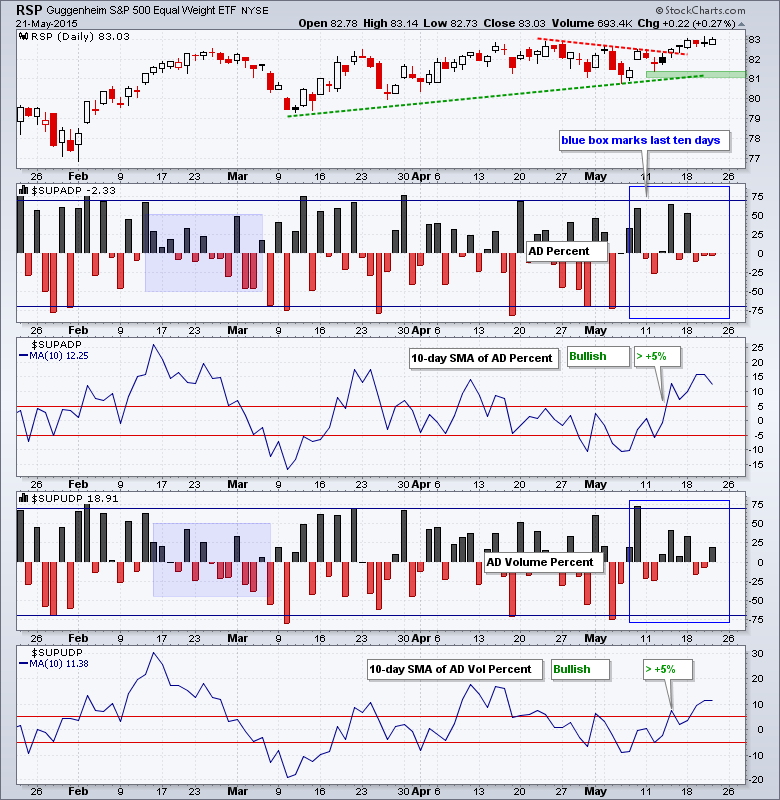
Art's Charts May 21, 2015 at 04:08 AM
Stocks did the old pop and drop as the S&P 500 surged to 2135 after the Fed minutes and then plunged back to its starting point (2125). The index ended the day unchanged and nothing has changed regarding the trend... Read More
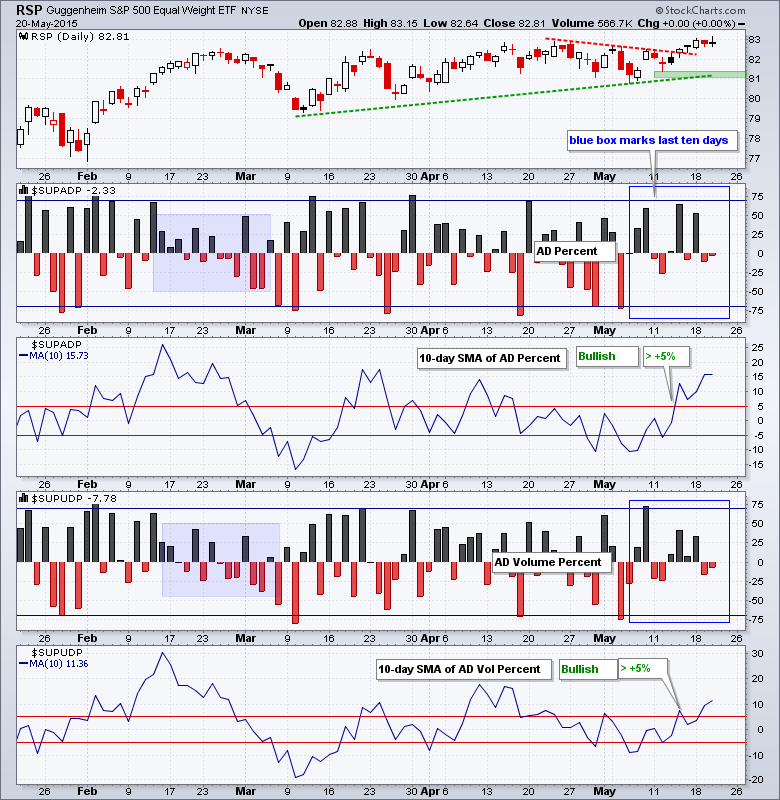
Art's Charts May 20, 2015 at 04:59 AM
Stocks meandered on Tuesday with the S&P 500 trading on either side of 2130 the entire day. The ETF fell below 2130 in the afternoon and closed at 2127 (-.06%). The sectors were mostly lower with energy leading the decline. The Finance SPDR (XLF) was the strongest sector with a ... Read More
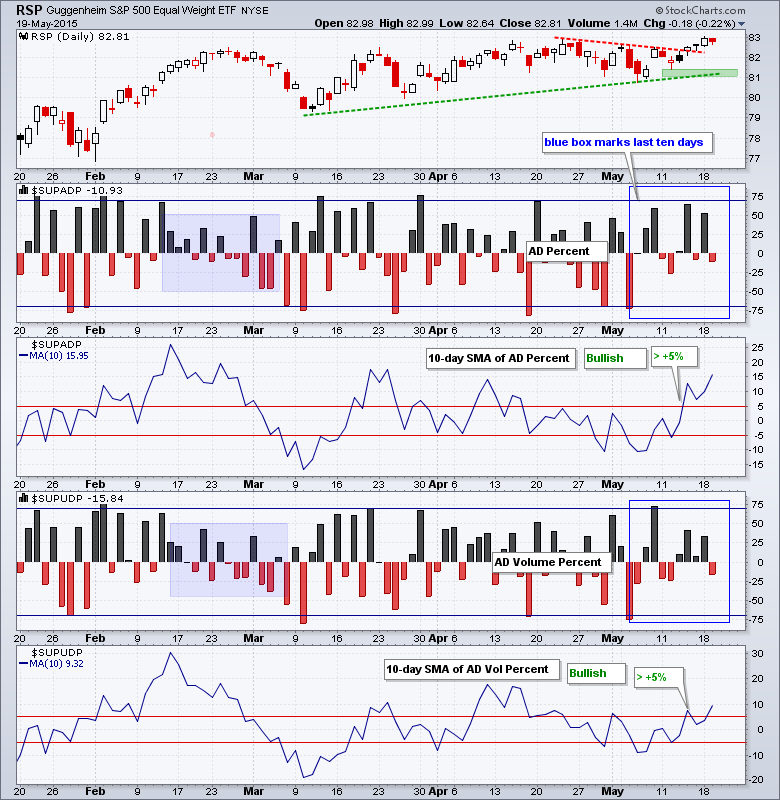
Art's Charts May 19, 2015 at 10:25 AM
Stocks continued higher with the S&P 500 and Dow Industrials recording new all time highs. They were not the leaders though. The Russell 2000 iShares (IWM) led and was the only major index ETF to gain over 1% on the day. Seven of the nine sector SPDRs finished higher... Read More
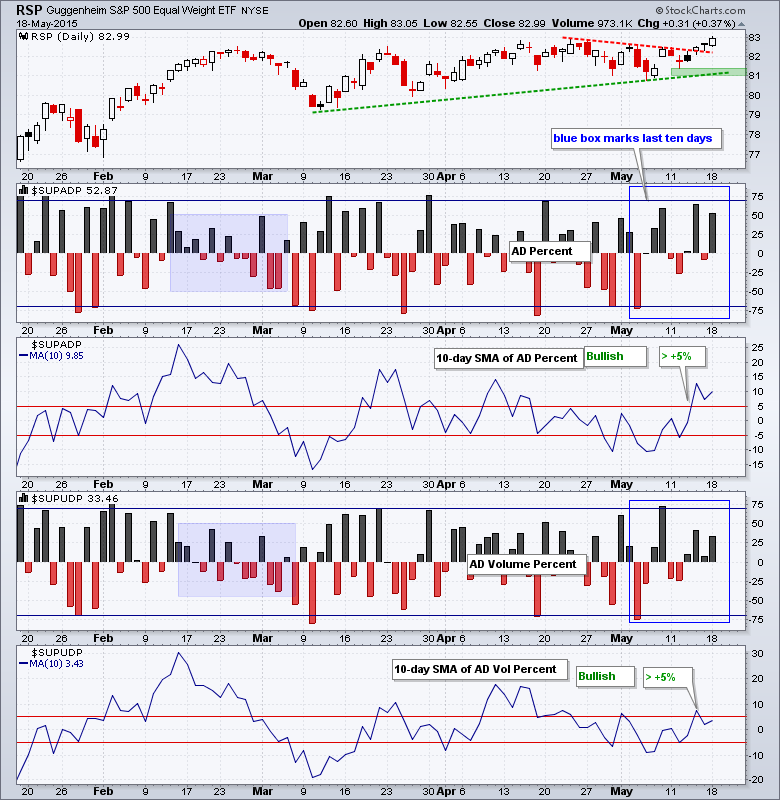
Art's Charts May 18, 2015 at 04:37 AM
It was a pretty wild week for stocks. The S&P 500 started weak with a 25 point decline and dip below 2090. This dip did not last long as the index surged back above 2115 on Thursday and hit an all time high on Friday. Yes, an all time high... Read More
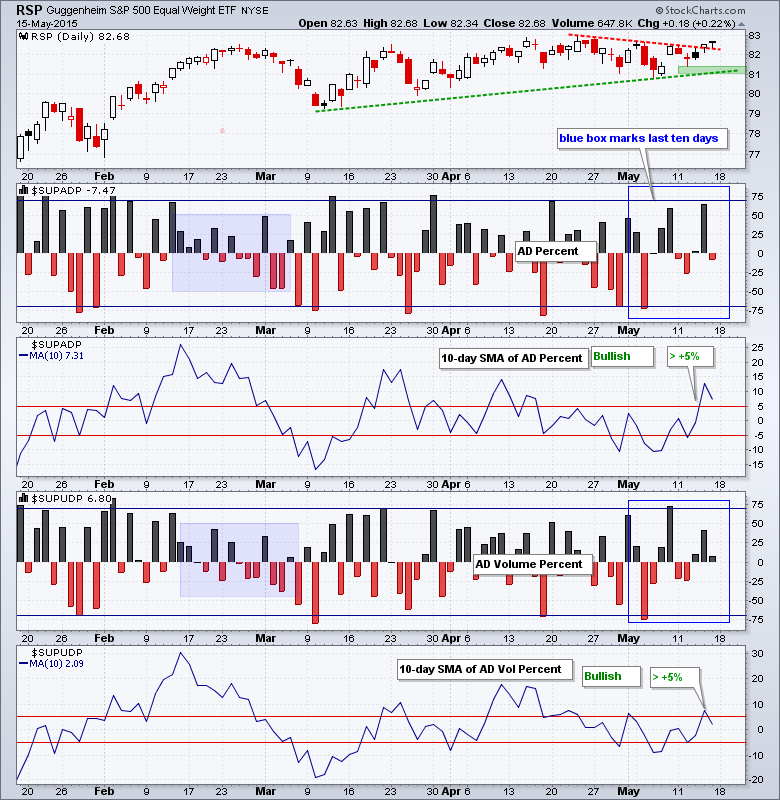
Art's Charts May 15, 2015 at 04:23 AM
The S&P 500 opened strong and finished strong, and Thursday's close above 2120 was a new closing high for the index. The index has yet to hit an intraday high, but the trends are up and new intraday highs should follow... Read More
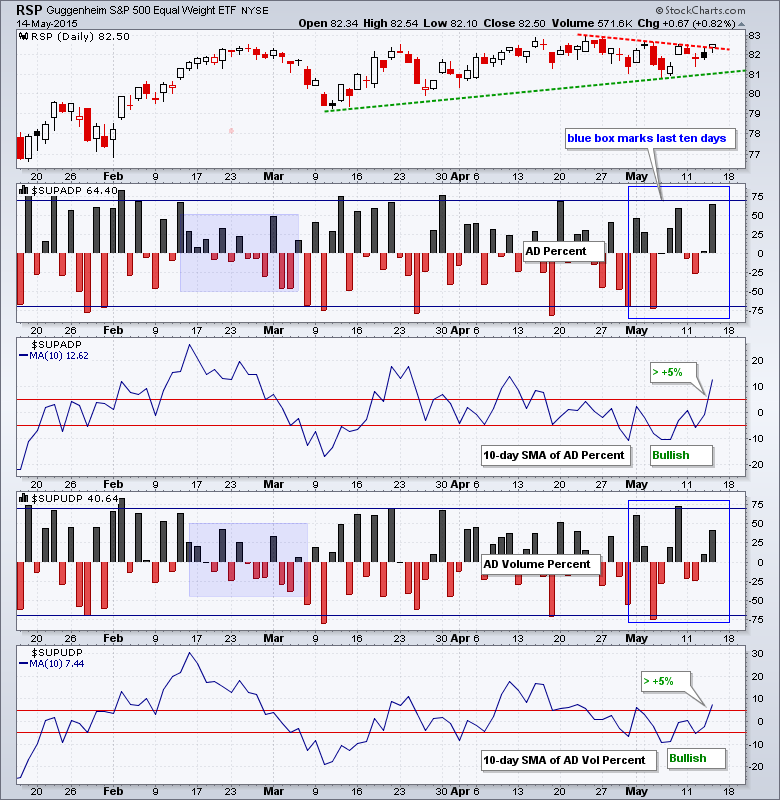
Art's Charts May 14, 2015 at 05:06 AM
The S&P 500 did just the opposite of Tuesday. The index opened weak on Tuesday, rebounded and then traded flat. On Wednesday, the index opened strong, immediately fell back and then traded flat... Read More
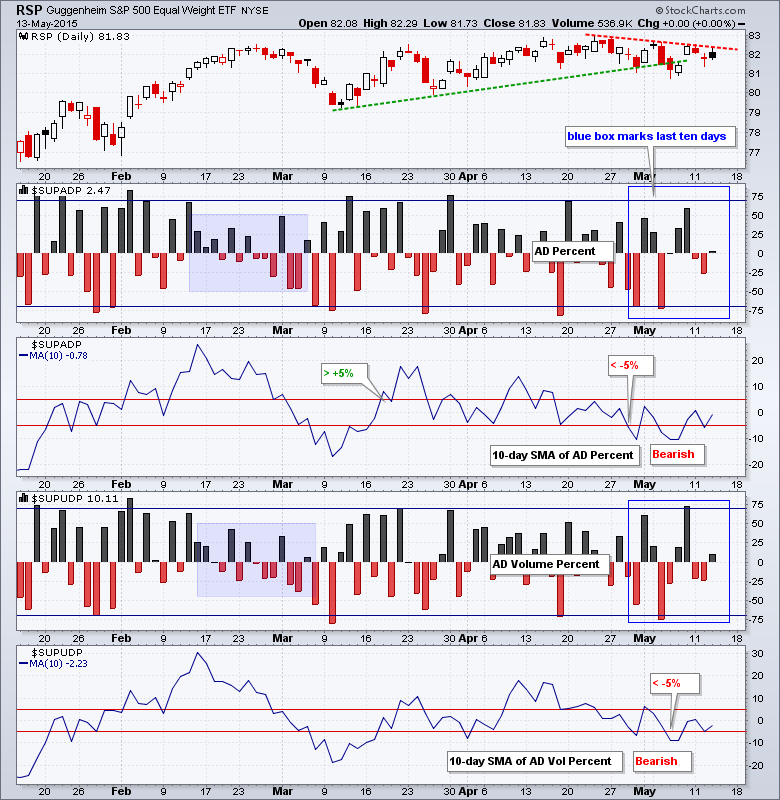
Art's Charts May 13, 2015 at 04:40 AM
You got to give the bulls credit on Tuesday. The S&P 500 opened weak with a 20 point decline and move below 2090. This decline wiped out Friday's gain and made the bulls look weak. Instead of continuing lower though, the index immediately firmed and bounced back to the 2100 area... Read More
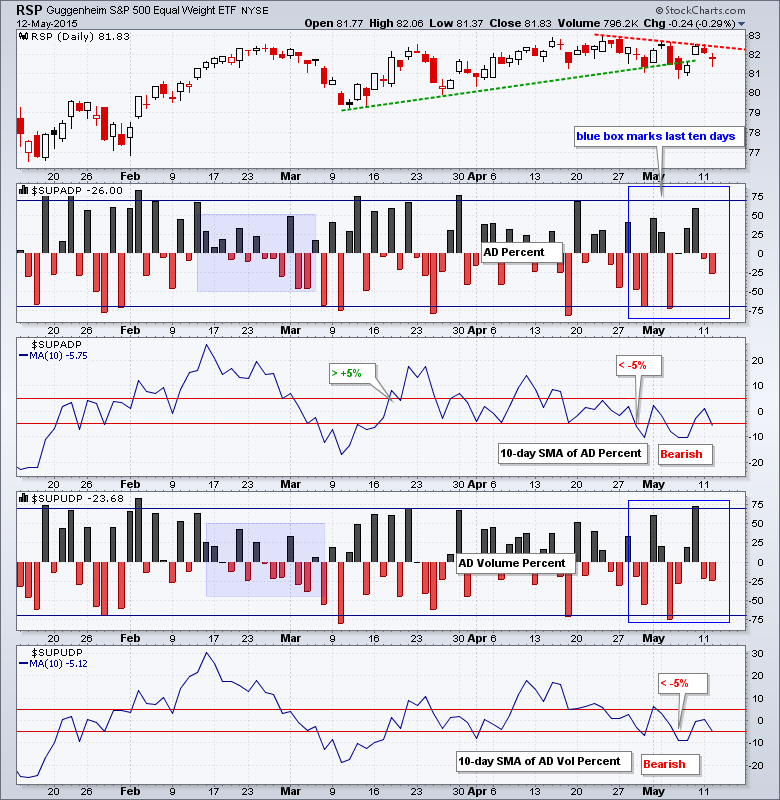
Art's Charts May 12, 2015 at 04:06 AM
The S&P 500 surged on Friday morning, traded flat the rest of the day and then worked its way lower on Monday. The overall loss (.50%) was modest and this could be just a correction after the Friday surge. The sectors were mostly lower with energy leading the way... Read More
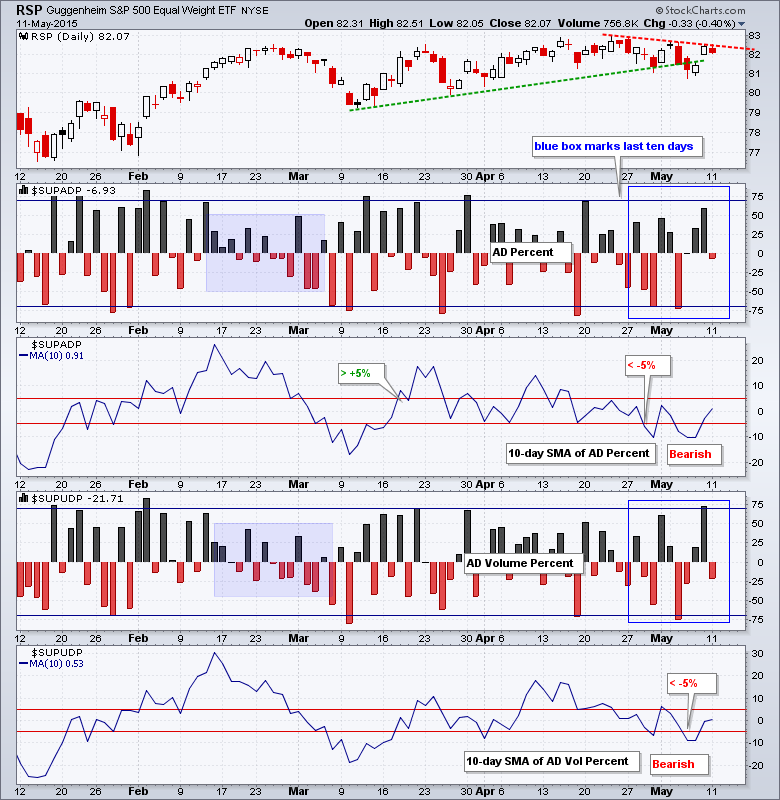
Art's Charts May 11, 2015 at 05:21 AM
Stocks surged on Friday as the S&P 500 opened around 2113 and closed around 2116. Even though the index held the opening surge, there was not much movement after the surge (+3 points). The major index ETFs closed higher, but small-caps and mid-caps lagged... Read More
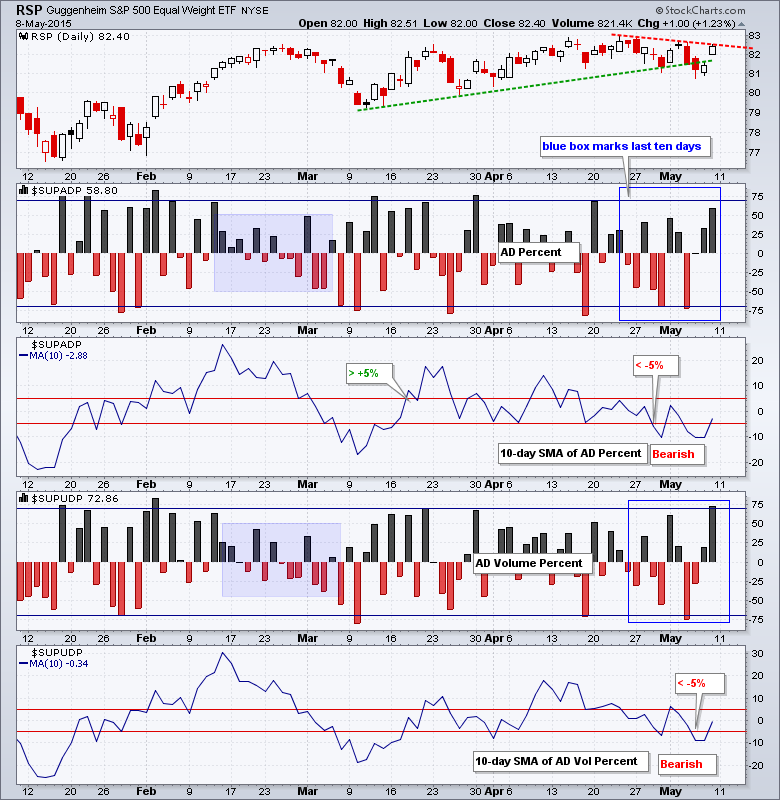
Art's Charts May 08, 2015 at 04:05 AM
Stocks bounced and the major index ETFs closed modestly higher. Eight of the nine sector SPDRs were up. Energy fell because oil was down sharply. The decline in oil boosted the Airline ETF (JETS) and this helped the Transport iShares (IYT) to a 1.11% gain... Read More
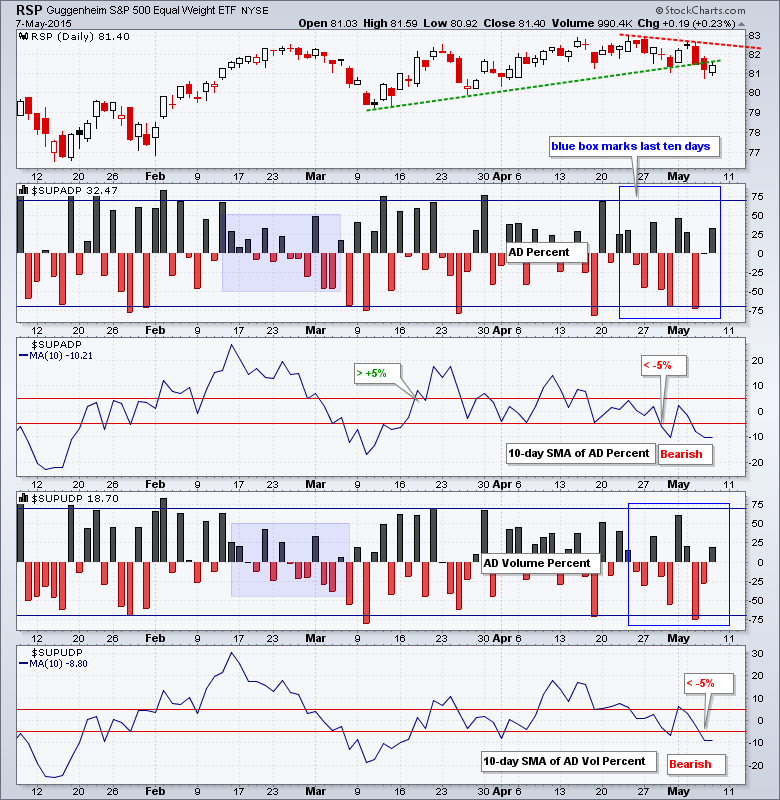
Art's Charts May 07, 2015 at 04:26 AM
Stocks closed lower again on Wednesday, but a late afternoon bounce pushed the major index ETFs off their lows. IWM and MDY actually closed with small gains as small and mid-caps held up well on Wednesday. QQQ and SPY closed fractionally lower... Read More
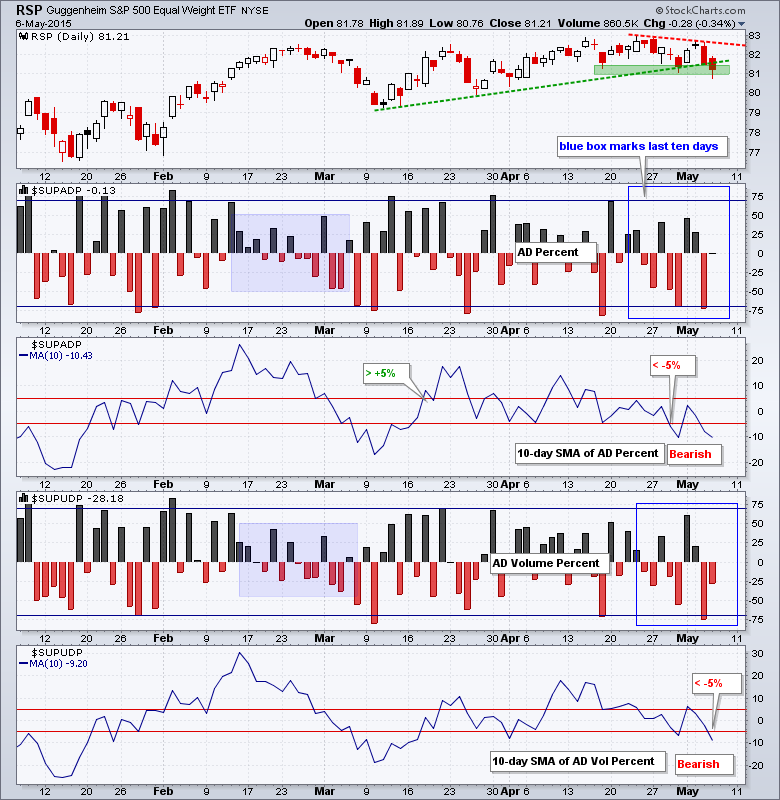
Art's Charts May 06, 2015 at 05:38 AM
Stocks were hit with broad selling pressure on Tuesday with the Nasdaq 100 ETF (QQQ) leading the major index ETFs lower. All sectors were down with utilities getting hammered. Looks like XLU finally caught on to the rise in rates and followed the REIT iShares (IYR) lower... Read More
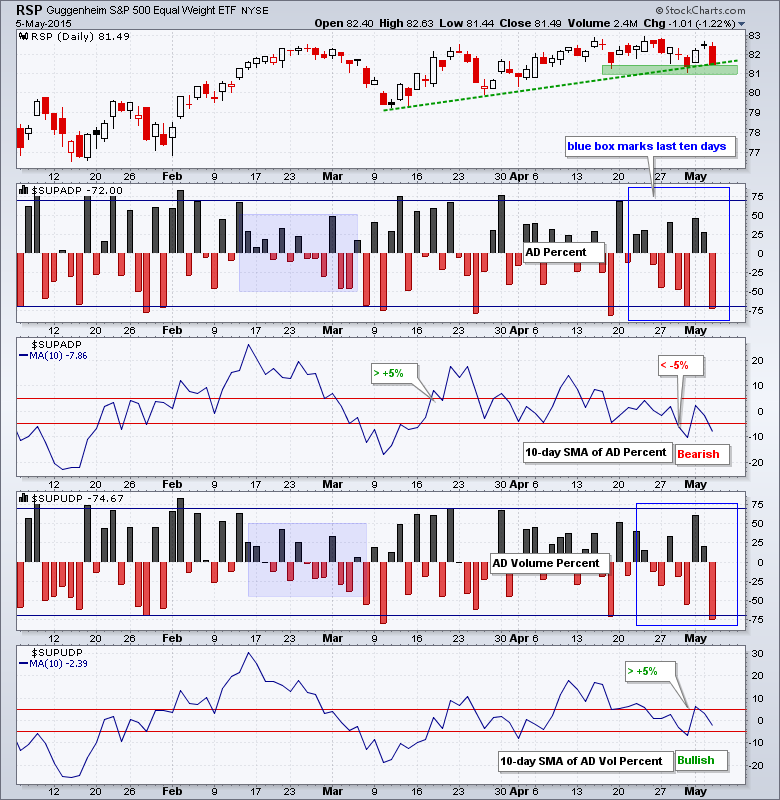
Art's Charts May 05, 2015 at 05:21 AM
Stocks closed modestly higher on Monday with the technology, healthcare and utilities sectors leading the way. It is most interesting to see utilities higher because the 10-YR Treasury Yield ($TNX) is up sharply over the last two weeks... Read More
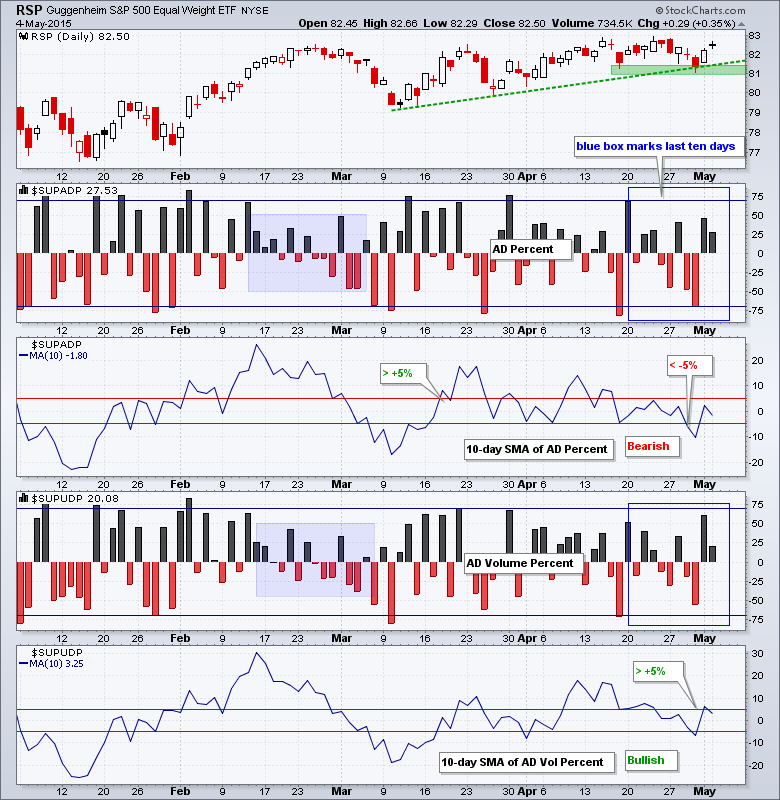
Art's Charts May 04, 2015 at 05:14 AM
Stocks fell from Monday to Thursday and then surged on Friday with a strong open and strong close. QQQ and large-caps led the bounce, while IWM and small-caps lagged with smaller gains... Read More
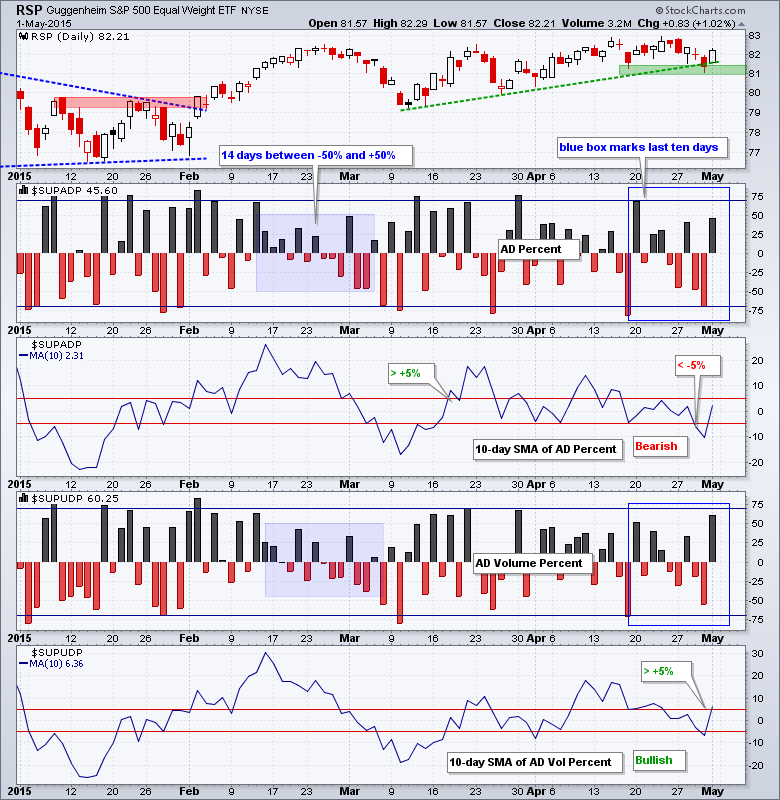
Art's Charts May 01, 2015 at 04:44 AM
Stocks started the day weak and finished weak. The S&P 500 plunged below 2095 on the open, chopped around and then dipped below 2090 in the afternoon. Small-caps led the way lower as IWM lost over 2%. All sectors were down with healthcare and technology leading the way... Read More