Art's Charts August 31, 2019 at 06:26 AM

Today we will look at charts for the biggest stocks in the Nasdaq 100 ETF. Even though the big tech titans dominate QQQ, note that Pepsi (PEP) is the 10th largest stock and accounts for 2.3%. PEP is obviously part of the Consumer Staples sector... Read More
Art's Charts August 30, 2019 at 08:57 AM

The broader market may not seem bullish right now, but there is clearly a bull market somewhere within stocks. In particular, the S&P 500 and Nasdaq 100 are currently within five percent of all time highs, which were hit just five weeks ago... Read More
Art's Charts August 29, 2019 at 09:14 AM

Today I am breaking my ETF chart list into five groups and showing these groups in order of performance, strongest to weakest. After analyzing and comparing these price charts, five clear groups emerged. First, there are ETFs with very strong uptrends that look very extended... Read More
Art's Charts August 23, 2019 at 08:34 AM

The performance for the S&P 500, S&P Mid-Cap 400 and S&P Small-Cap 600 over the last 3, 6, 9 and 12 months pretty much says it all. The S&P 500 is positive on all four timeframes, the S&P Small-Cap 600 is negative on all and the S&P Mid-Cap 400 is mixed. Mr... Read More
Art's Charts August 23, 2019 at 08:20 AM

As noted in a separate commentary, the State of the Stock Market is shaky. The Technology sector is holding up, but we are seeing weakness within Finance, Consumer Discretionary, Industrials and Communication Services... Read More
Art's Charts August 20, 2019 at 06:04 AM

Volatility is clearly on the uptick with the S&P 500 SPDR (SPY) moving more than 1% nine times since July 31st. This follows a period from early June to late July when the 1-day Rate-of-Change exceeded 1% just once, and the market moved steadily higher. Ah, the good ole days... Read More
Art's Charts August 17, 2019 at 07:53 AM

Stocks rebounded on Friday with small-caps leading the way. The Russell 2000 surged 2.19%, while the S&P 500 advanced 1.44% and the Nasdaq 100 gained 1.59%. Despite these sizable rebounds, all three were down for the week and still down between 4.5% and 5... Read More
Art's Charts August 16, 2019 at 10:47 AM

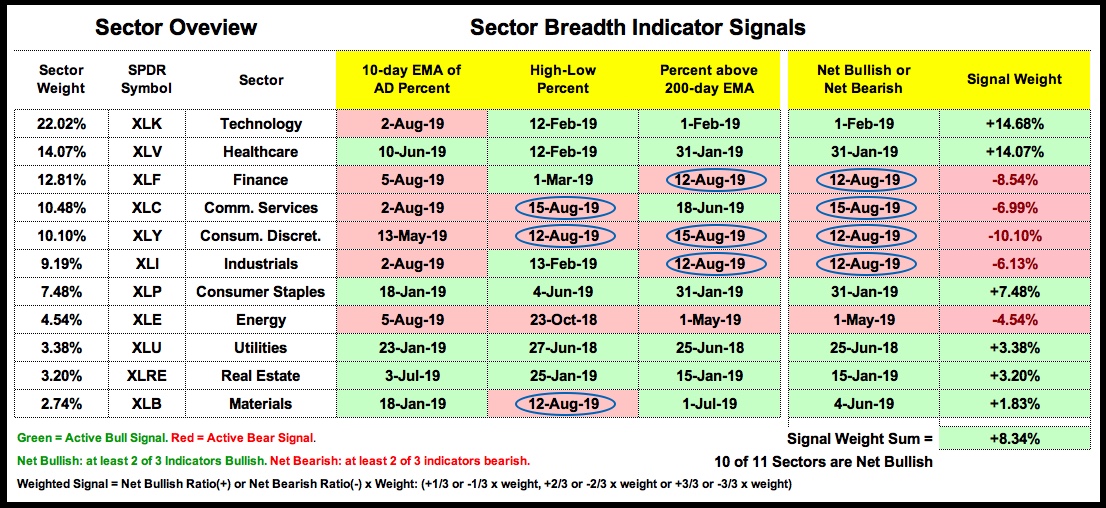
Sector Breadth Model Takes another Hit Today I will rank and analyze the charts for the eleven sector SPDRs, but I will first cover the sector breadth table, which reflects the internal strength/weakness within each sector... Read More
Art's Charts August 15, 2019 at 09:30 AM

Watch for Rising Correlation ...The overall state of the stock market is the most important factor to consider when trading or investing in stocks. Broad market movements, by definition, affect most stocks... Read More
Art's Charts August 09, 2019 at 10:32 AM

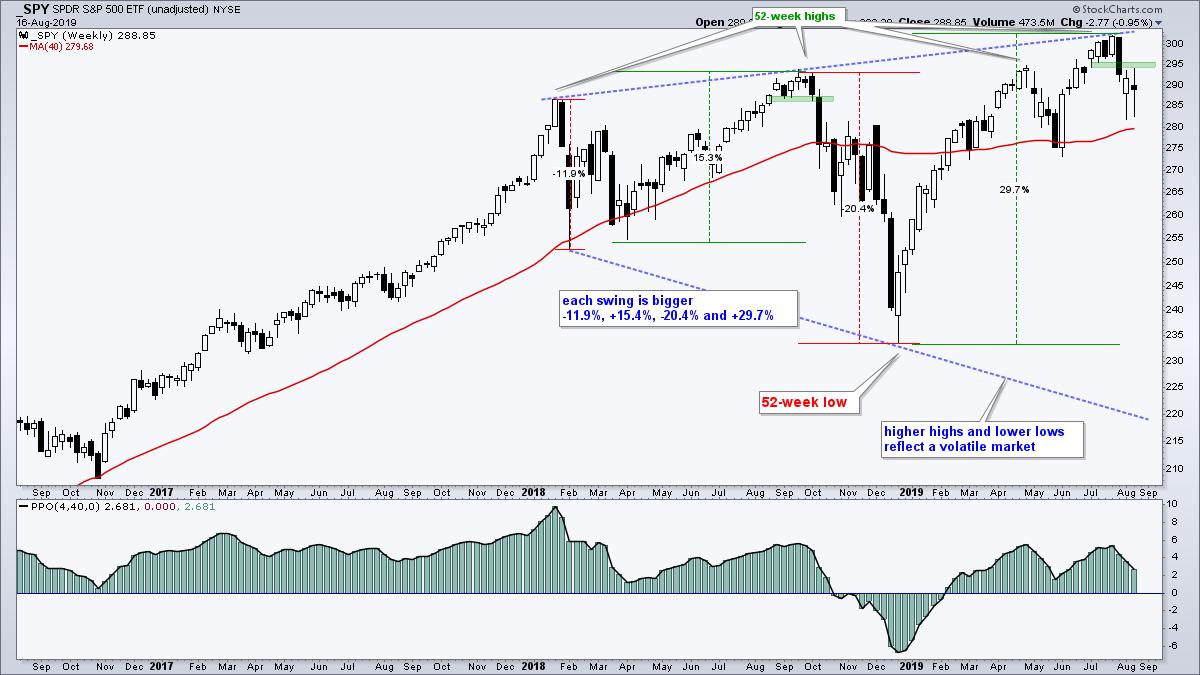
Volatility reared its ugly head this week with the S&P 500 falling around 6% in six days and then rebounding with a sharp three-day bounce. This is the biggest decline since the May-June correction, and the sharpest decline since early December... Read More
Art's Charts August 06, 2019 at 06:53 AM

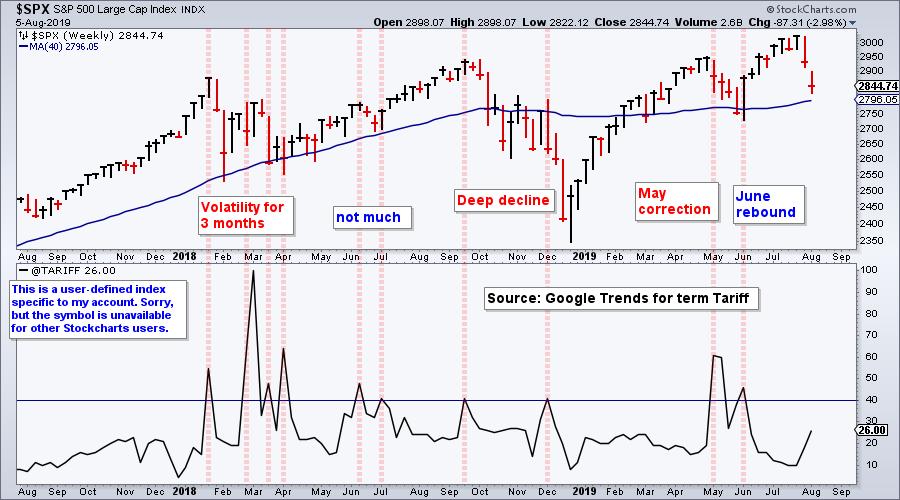
Stocks were pummeled on Monday with the S&P 500 falling the most (2.98%) since December 2018. The Russell 2000 and Nasdaq 100 also fell more than 3% with widespread selling pressure... Read More
Art's Charts August 03, 2019 at 05:38 AM

Stocks were hit with some of the strongest selling pressure since December as the S&P 500 fell 3.10% and the Nasdaq 100 fell 4.04%. These weekly declines were the largest since mid December. The Russell 2000 held up the best with a 2... Read More
Art's Charts August 02, 2019 at 10:14 AM

Today I am going to dive into breadth by looking at two indicator groups used for short-term market timing and three indicator groups for long-term market timing. Most of you are familiar with these indicators: AD Percent, Up/Down Volume%, High-Low Percent and %Above 200-day EMA... Read More