Don't Ignore This Chart! September 30, 2015 at 10:58 AM
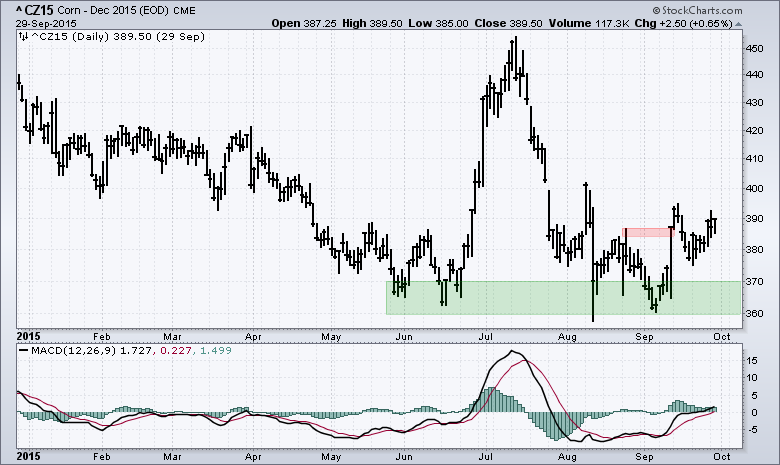
Corn is showing signs of firming near the June lows and a possible wave 2 could be ending for the Corn Trust ETF (CORN). I will first start with December Corn Futures (^CZ15) because this is the most widely traded instrument for corn... Read More
Don't Ignore This Chart! September 29, 2015 at 07:32 PM
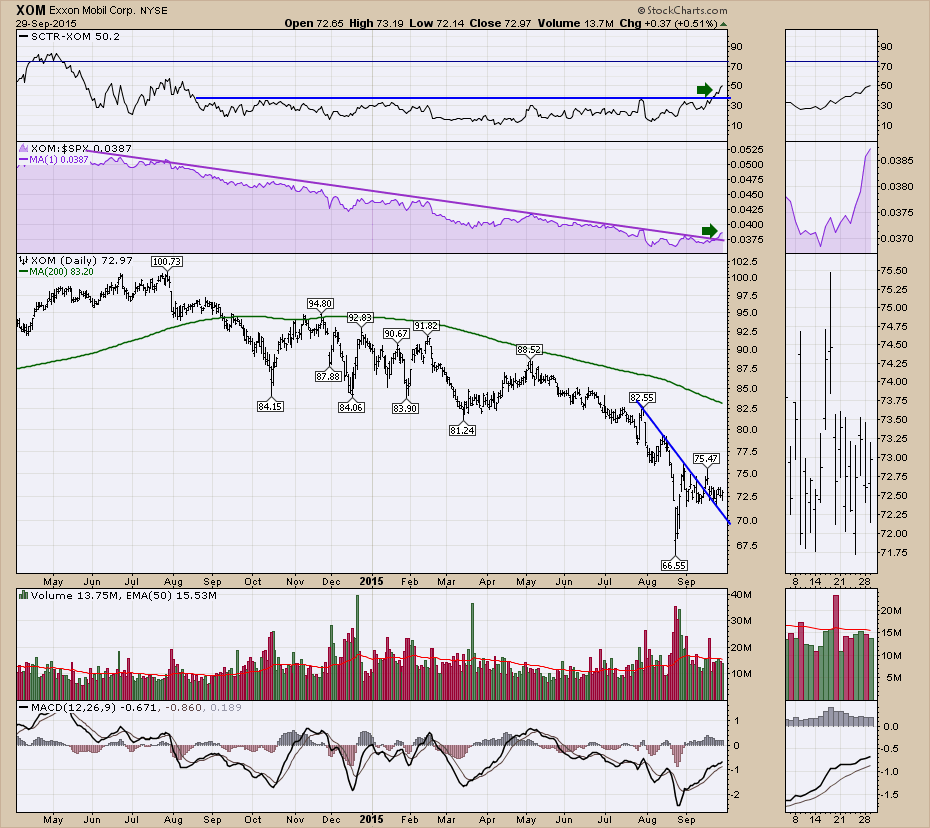
Exxon Mobil (XOM) has been a dog since the price of oil dropped a year ago. In the 2008 bear market, Exxon was a go-to stock when everything else was cratering. Exxon (XOM) was a company that would be able to come out the other side of the GFC... Read More
Don't Ignore This Chart! September 28, 2015 at 11:37 AM
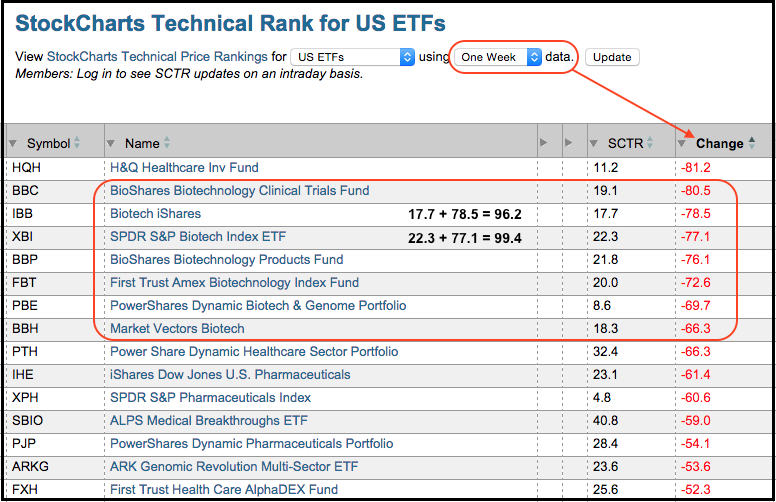
The biotech ETFs have gone from leaders to laggards as the StockCharts Technical Rank (SCTR) plunged double-digits over the past week. The image below shows the ETFs with the biggest decline in their SCTR over the past week... Read More
Don't Ignore This Chart! September 27, 2015 at 09:44 AM
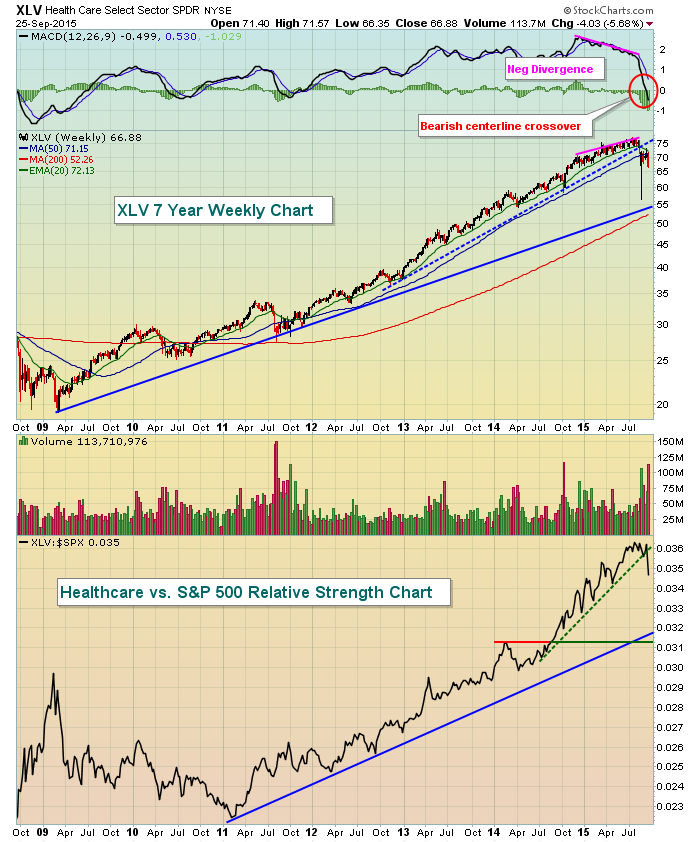
Healthcare stocks led much of the market's rally off the 2009 lows - especially since early 2011. That was then. This is now... Read More
Don't Ignore This Chart! September 26, 2015 at 09:39 AM
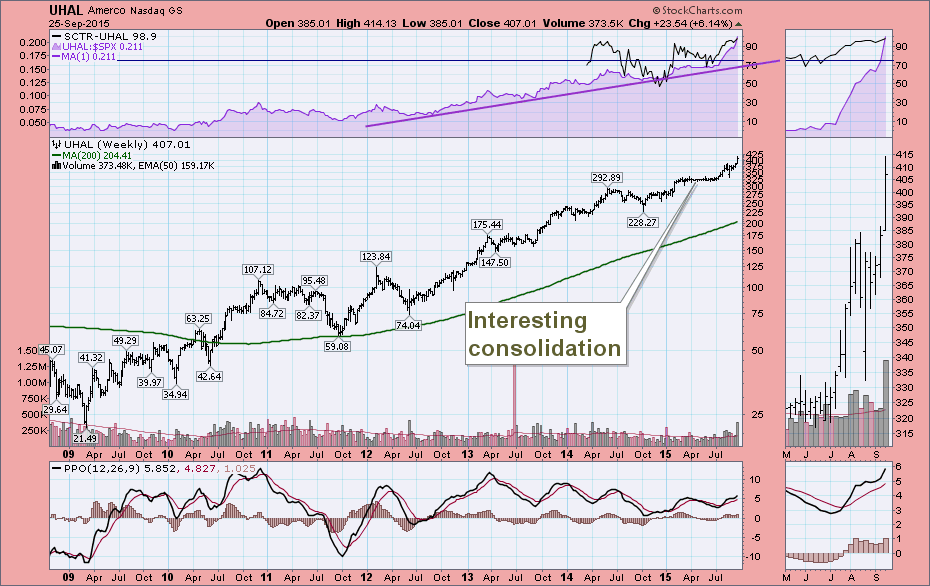
Amerco (UHAL) is the parent company of U-Haul. We have all seen them or used them driving our stuff across North America. The stock has had a very important consolidation that is not unique. The stock has been on an unbelievable up trend off the 2009 lows... Read More
Don't Ignore This Chart! September 24, 2015 at 07:31 AM
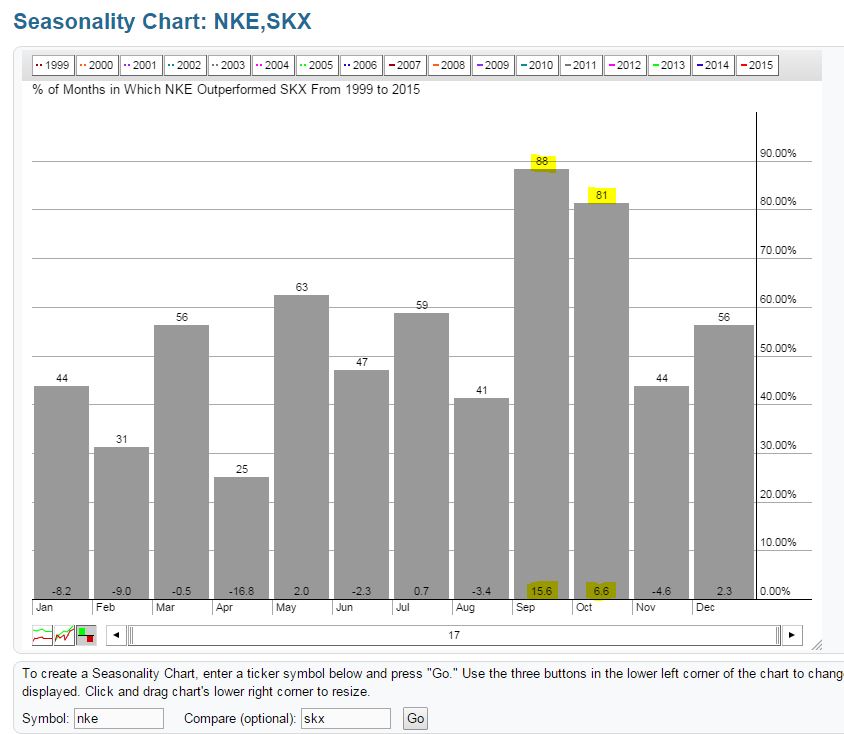
One cool feature at StockCharts.com is the ability to check the seasonal tendencies of stocks. For instance, I can tell you that Amazon... Read More
Don't Ignore This Chart! September 23, 2015 at 12:16 PM
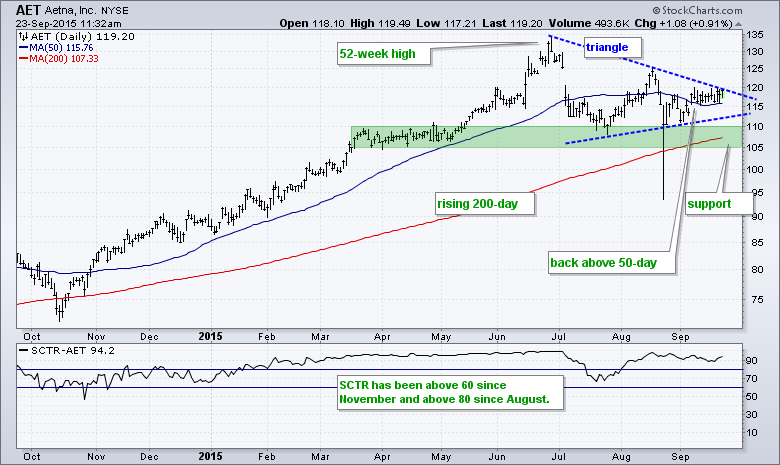
In addition to this successful ad campaign, Aetna sports a bullish looking chart that argues for higher prices. First note that it has been a tough month for stocks with the S&P 500 down around 1.5% month-to-date... Read More
Don't Ignore This Chart! September 22, 2015 at 02:56 PM
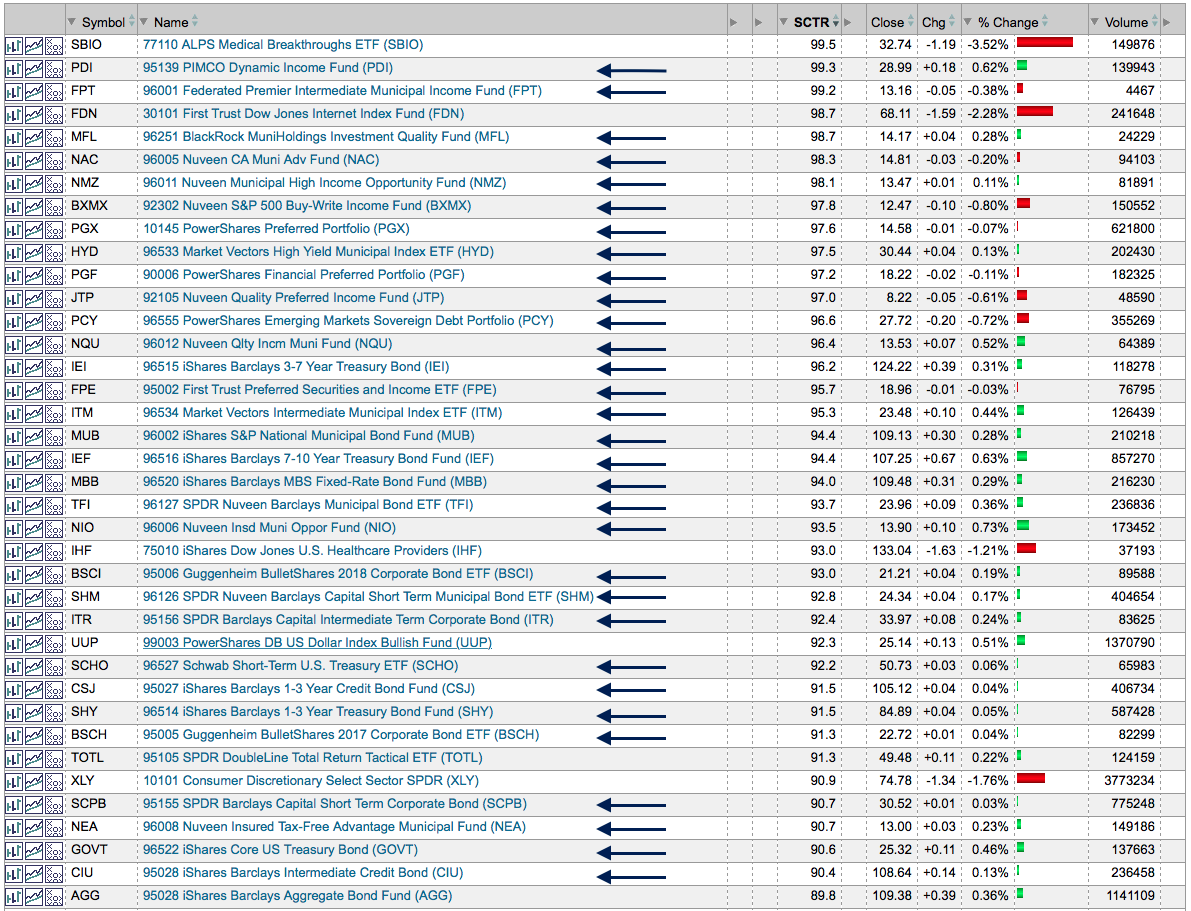
While the various investment managers talk about how bullish this pullback is, the ETF's with the best price action are all in the bond arena. I have made a concentrated ETF list and commonly refer to it for webinars and ideas for allocation... Read More
Don't Ignore This Chart! September 21, 2015 at 11:38 AM
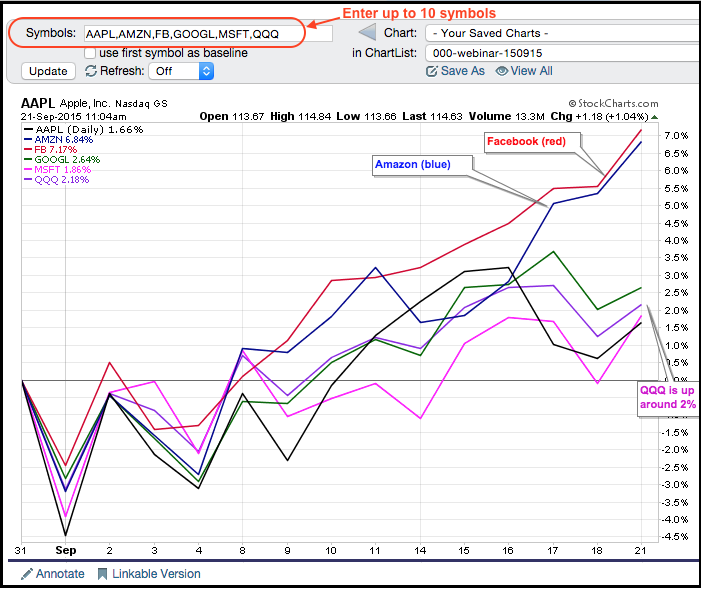
There are lots of technology-consumer companies out there, but few are bigger than the big five: Apple, Amazon, Facebook, Google and Microsoft. While I am not sure if it is a zero-sum game for these behemoths, two are emerging as the leaders over the last few weeks... Read More
Don't Ignore This Chart! September 19, 2015 at 03:21 AM
U.S. equities have been very weak since mid-August with many sectors, industry groups and individual stocks broken down technically. In recent days and weeks, many high profile stocks have struggled to clear falling 20 day EMAs... Read More
Don't Ignore This Chart! September 18, 2015 at 10:23 AM
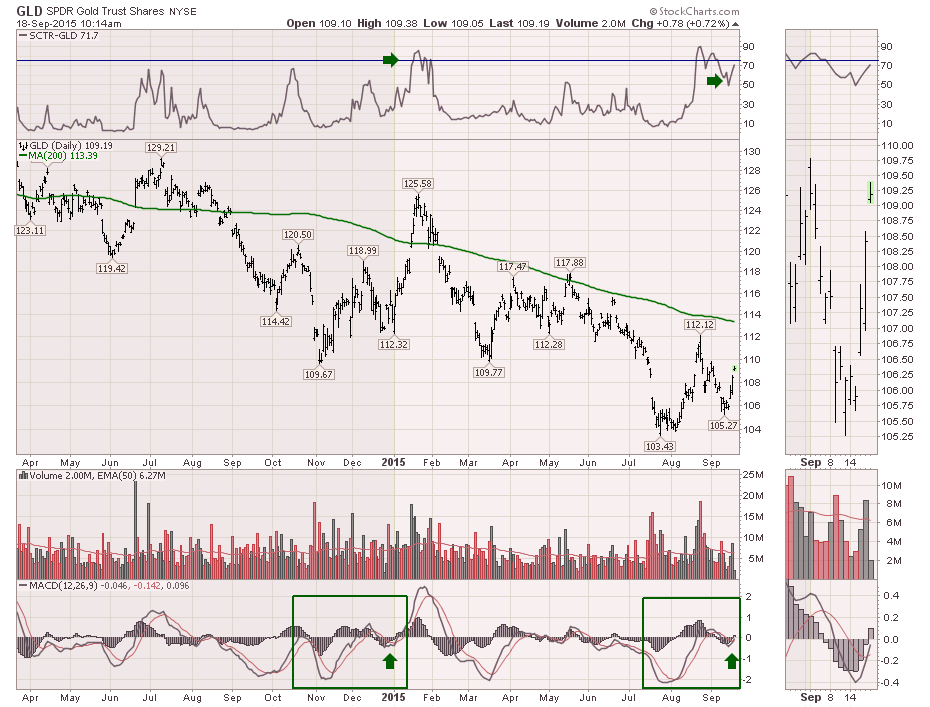
Gold has been in a major funk along with the rest of the commodities. Recently it started to look a little better. We can see the SCTR ranking recently broke above 75 and pulled back. Now it looks set to charge up again... Read More
Don't Ignore This Chart! September 17, 2015 at 04:37 PM
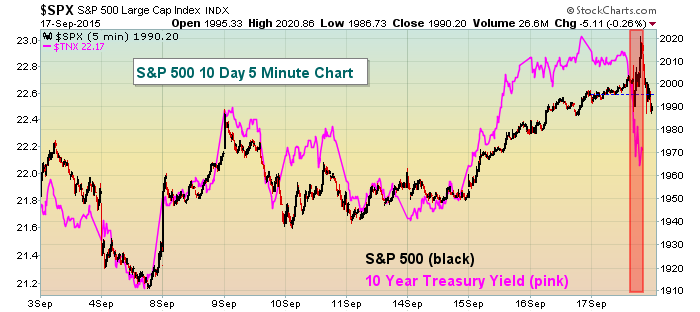
Well, the Fed meeting and announcement has come and gone. All the drama is over. At the end of the day, Fed Chair Janet Yellen decided to leave interest rates unchanged for now, citing weakness abroad as one of the reasons for such delay... Read More
Don't Ignore This Chart! September 16, 2015 at 07:55 AM
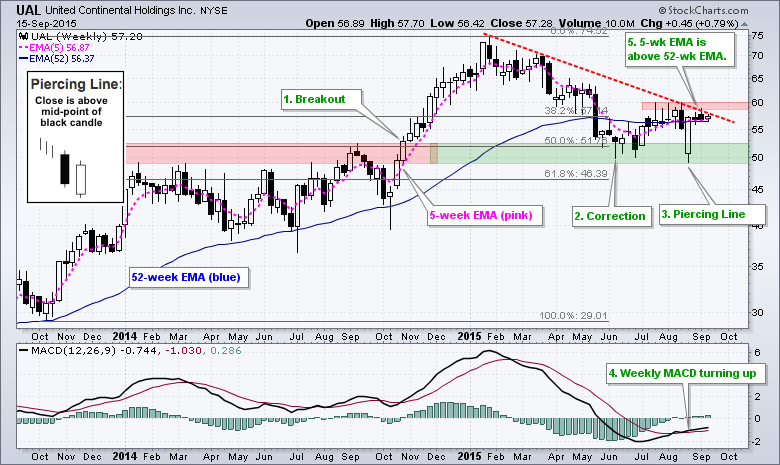
The weekly chart for United Airlines (UAL) is looking bullish as the stock firms in a key retracement zone and weekly MACD turns up. The green text on the chart marks five technical features over the last 15 months. First, the stock broke out to new highs in October 2014... Read More
Don't Ignore This Chart! September 15, 2015 at 07:07 AM
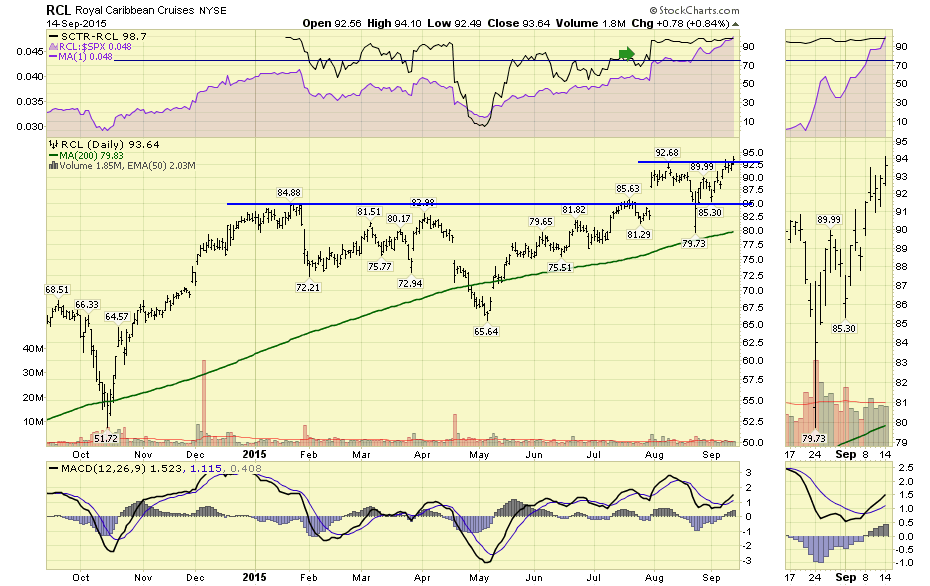
Royal Caribbean Cruise Lines (RCL) has been living on the high seas for a while. This stock broke out to new highs on Monday and continues to be a steady ship in rough waters. In late July, RCL gapped up and then worked sideways... Read More
Don't Ignore This Chart! September 14, 2015 at 11:04 AM
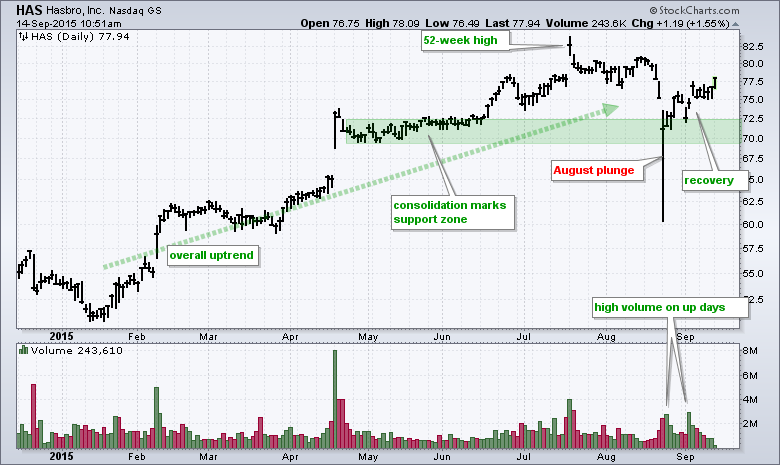
Star Wars fans may remember that quote from Darth Vader in Star Wars Episode IV (A New Hope). In any case, it came to mind when looking at the chart for Hasbro, which holds the merchandising rights for Star Wars toys... Read More
Don't Ignore This Chart! September 13, 2015 at 12:02 PM
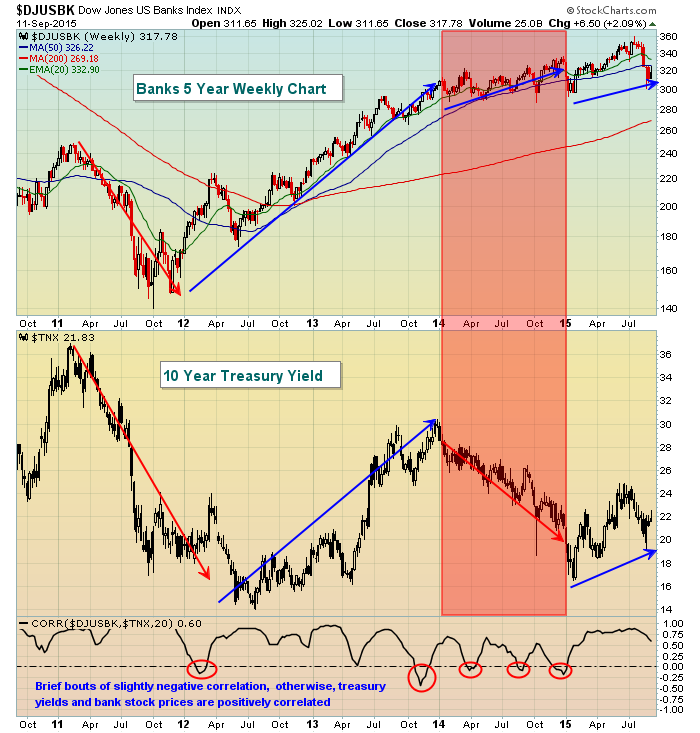
As we await the Fed's interest rate decision this week, it's a good time to review a key area of the market that is heavily swayed by the direction of interest rates - banks ($DJUSBK)... Read More
Don't Ignore This Chart! September 11, 2015 at 02:31 PM
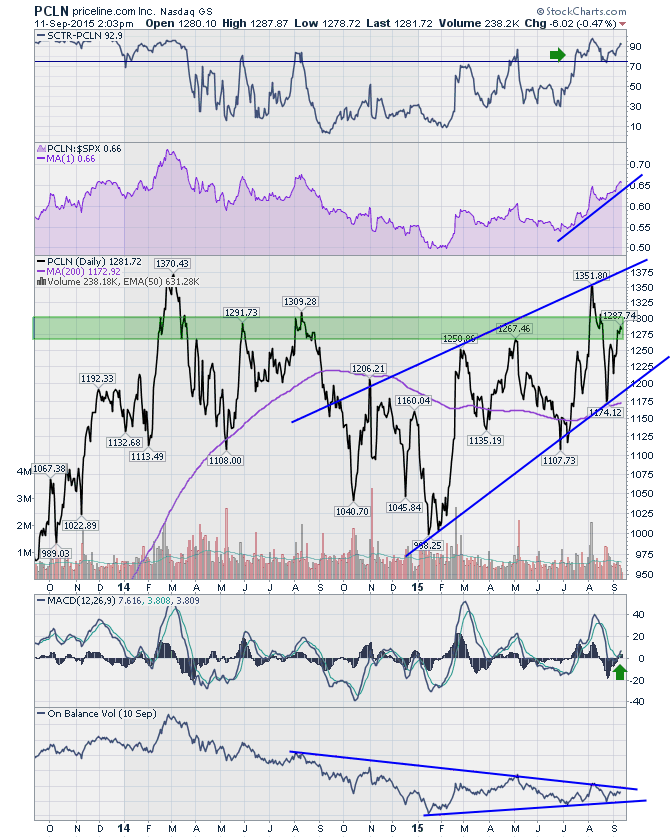
Best wishes to all of our American readers on this historic date in history. My heartfelt thoughts and best wishes go out to all of you. Charts can fool you when you look at a chart like Priceline (PCLN)... Read More
Don't Ignore This Chart! September 10, 2015 at 07:01 PM
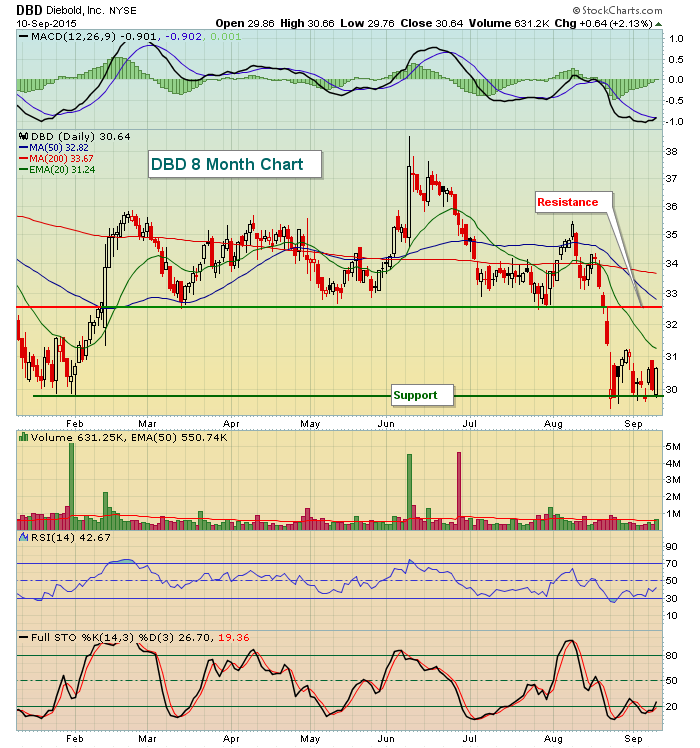
Computer hardware ($DJUSCR) led the technology sector to outsized gains on Thursday and Diebold (DBD) benefited by bouncing off price support. The 29.50-30.00 area has served as excellent support in 2015. Consider the trading range to be 29.50-32... Read More
Don't Ignore This Chart! September 09, 2015 at 11:49 AM
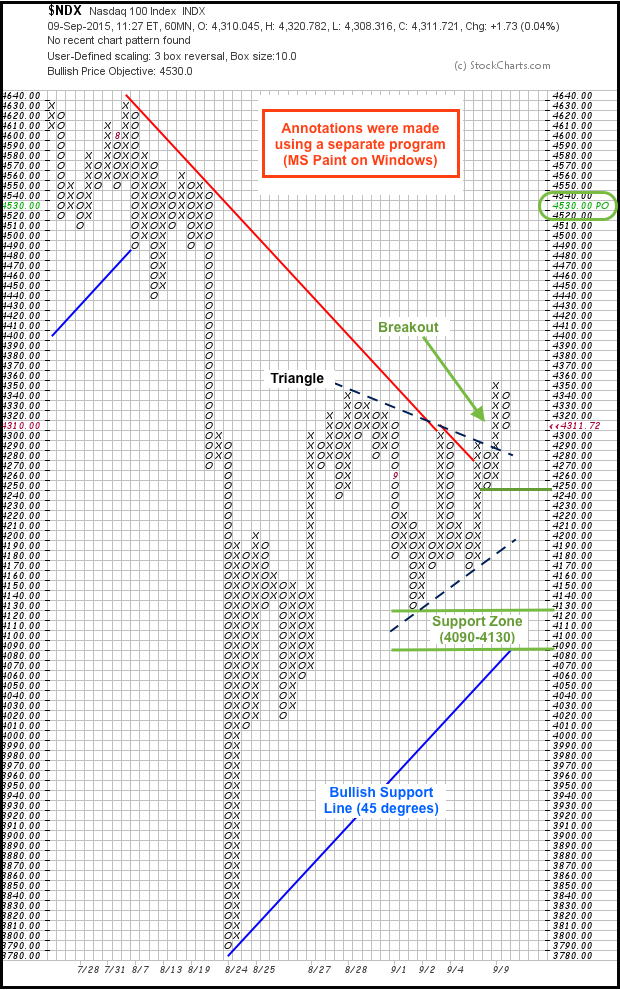
StockCharts users can create intraday P&F charts to shorten their time horizon and identify key levels to watch. The chart below is a 60-minute P&F chart with 10 points per box and a classic 3-box reversal... Read More
Don't Ignore This Chart! September 08, 2015 at 11:16 AM
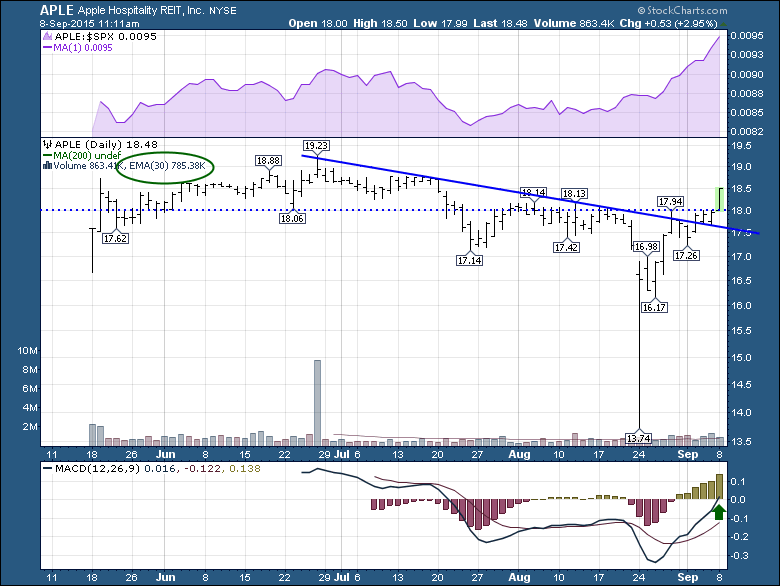
Recently, a new REIT was launched with the incredible name of Apple Hospitality REIT (APLE). While I think the world of investing has enough focus on a different Apple (AAPL) as the world's largest company, I'll let you decide what you think of this REIT... Read More
Don't Ignore This Chart! September 05, 2015 at 11:16 AM
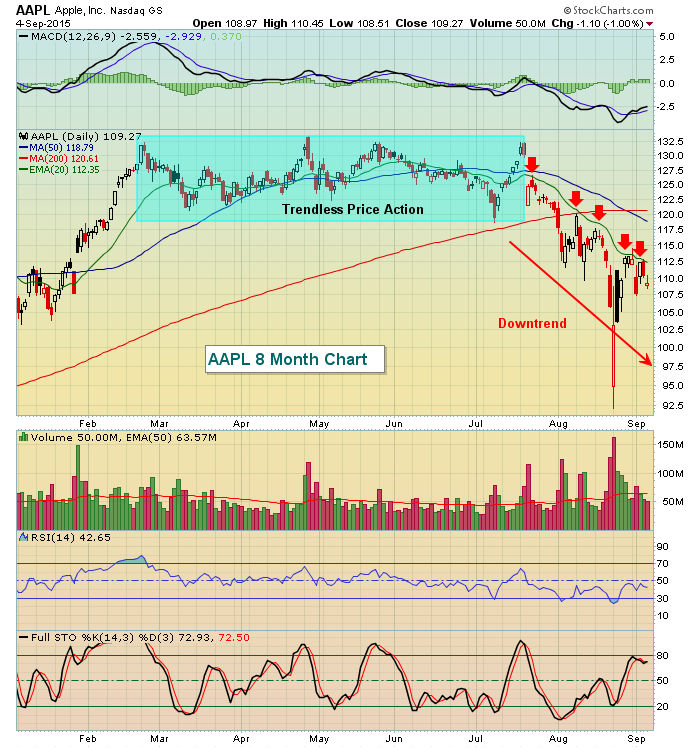
Moving averages are lagging overlays by definition as we use historical data to determine their position on a price chart. But many traders use moving averages as support during periods of trending prices. Personally, my favorite is the 20 period EMA... Read More
Don't Ignore This Chart! September 04, 2015 at 11:09 PM
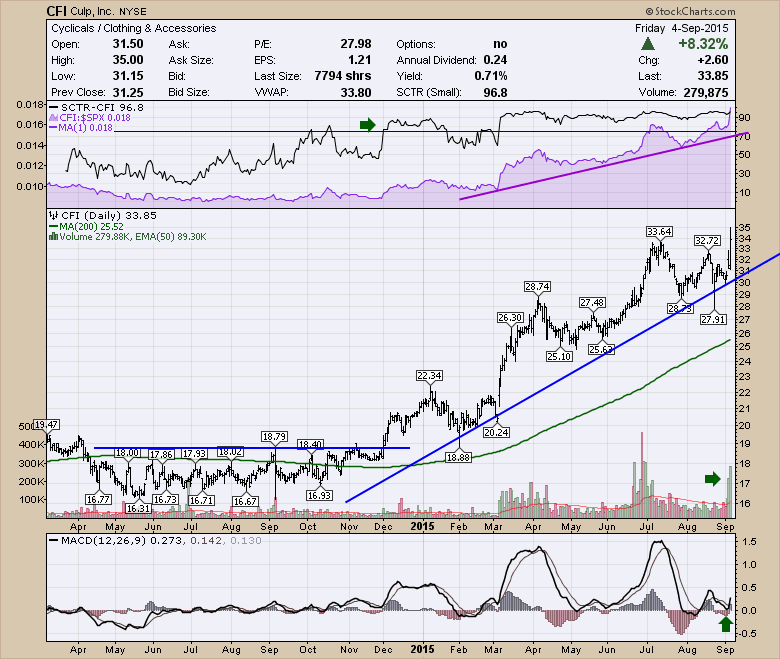
Culp Industries (CFI) is a small cap company making mattress cover fabric as well as upholstery fabric. The stock has really been climbing out of the bed it made last summer... Read More
Don't Ignore This Chart! September 03, 2015 at 05:58 PM
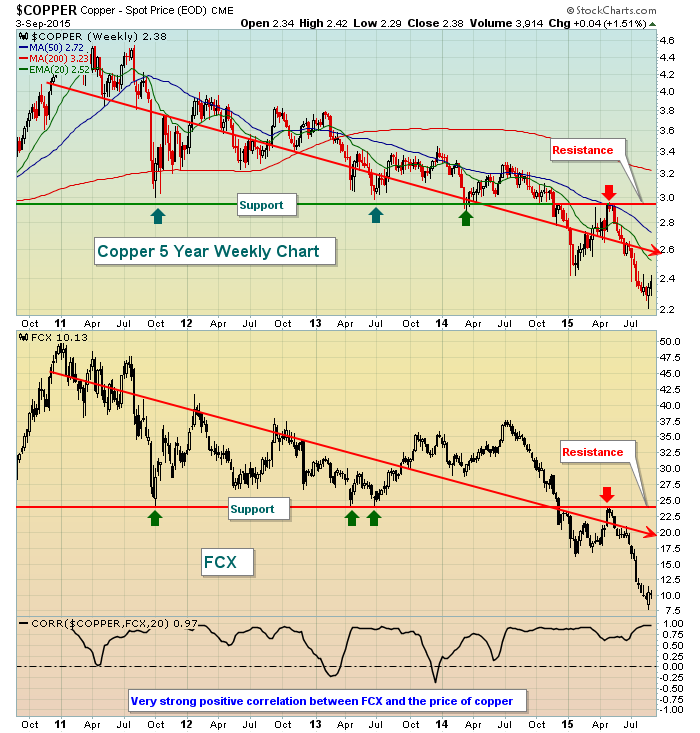
One week ago activist investor Carl Icahn disclosed that a group he belongs to owns nearly an 8.5% stake in Freeport-McMoran (FCX). Rumors suggest Icahn may seek representation on FCX's board of directors and is calling for changes in some of the Company's business practices... Read More
Don't Ignore This Chart! September 02, 2015 at 09:19 AM
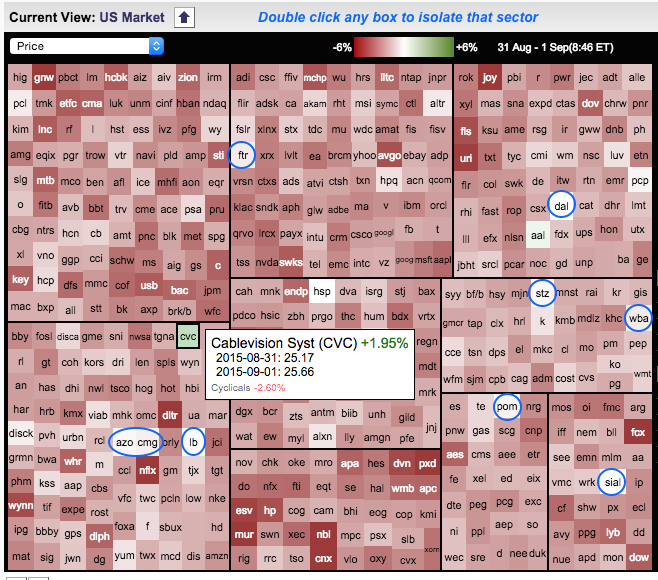
Selling pressure was quite intense on Tuesday as some 497 stocks in the S&P 500 declined on the day. This means there were only three winners on the day: CableVision (CVC), American Airlines (AAL) and Sigma-Aldrich (SIAL), which is going to be acquired by Merck... Read More
Don't Ignore This Chart! September 01, 2015 at 11:56 AM
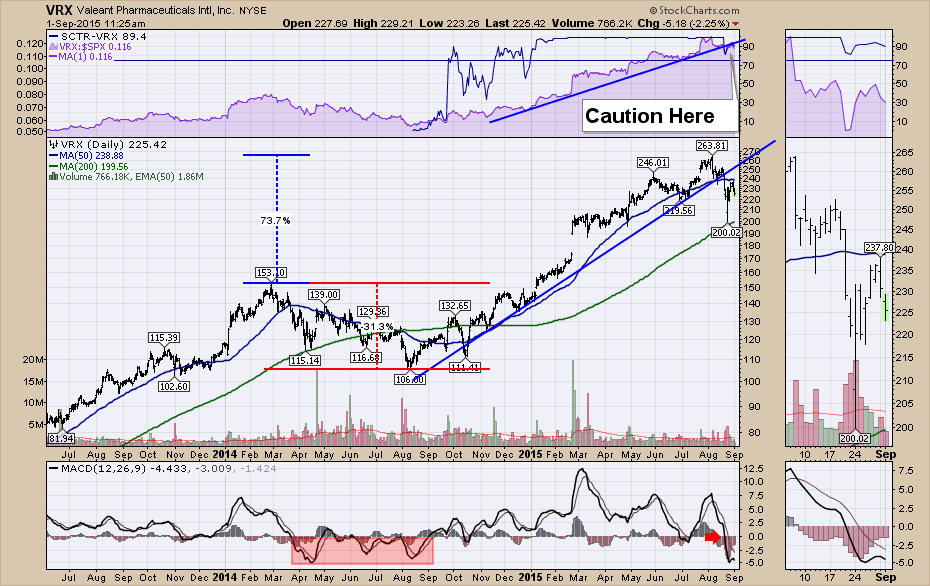
Valeant Pharmaceuticals (VRX) has been a very popular stock in North America with its acquisitive business model. The chart is showing some changes in trend, so it bears watching closely. The SCTR ranking has started to wobble recently, which is not a problem in itself... Read More