Art's Charts November 29, 2016 at 09:35 AM
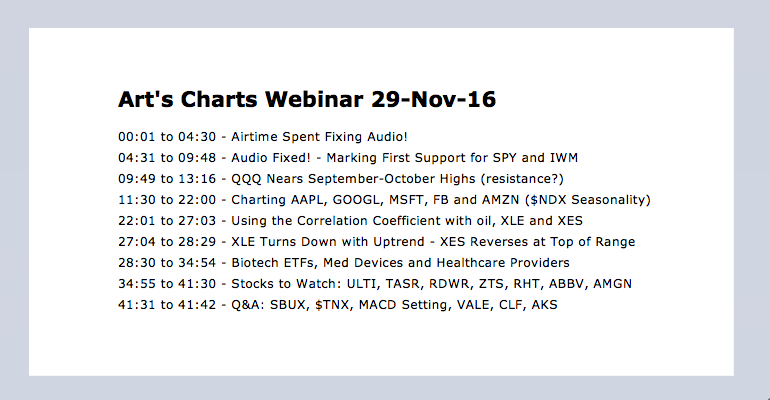
----- Webinar Video ----- Art's Charts ChartList ----- Staples and Utilities Bounce During Pullback .... Marking First Support for SPY and IWM .... QQQ Nears September-October Highs .... Charting the Fab Five: AAPL, GOOGL, MSFT, FB and AMZN ...... Read More
Art's Charts November 28, 2016 at 07:24 AM
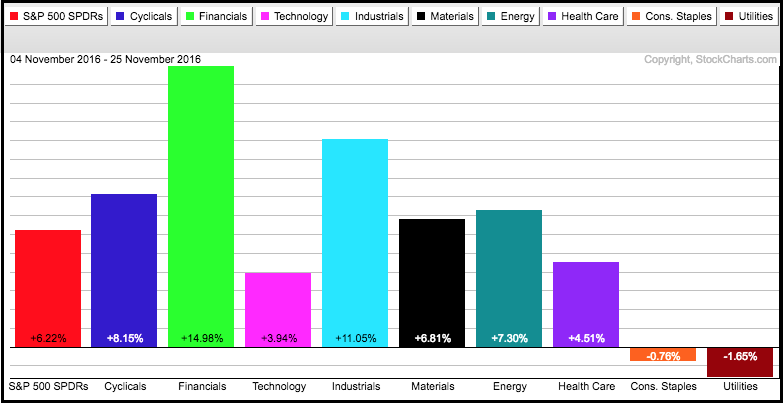
Small-caps, Finance and Industrials Lead (sector PerfChart) .... The Overbought Progression (IWM, SPY, QQQ) .... Biotechs Recover to Keep Pullback Patterns in Play (XBI, IBB, XLV) .... Six of Nine Sectors with Active Golden Crosses ...... Read More
Art's Charts November 22, 2016 at 08:48 AM
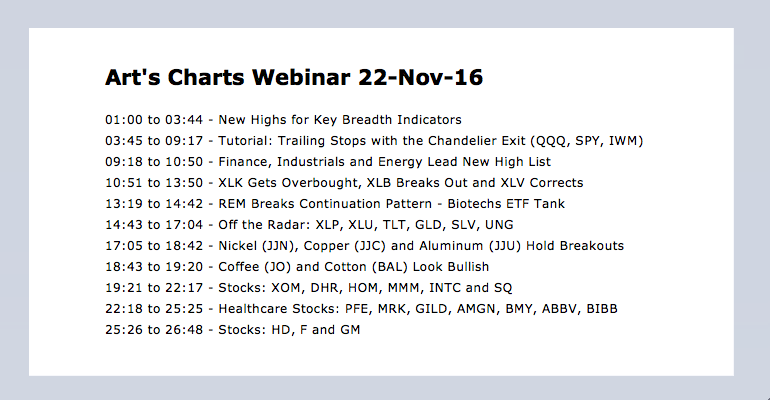
----- Webinar Video ----- Art's Charts ChartList ----- New Highs for Key Breadth Indicators .... Trailing with the Chandelier Exit .... QQQ Joins the Overbought Ranks .... Finance, Industrials and Energy .... Lead New High List .... XLK Becomes Overbought ...... Read More
Art's Charts November 21, 2016 at 06:05 AM
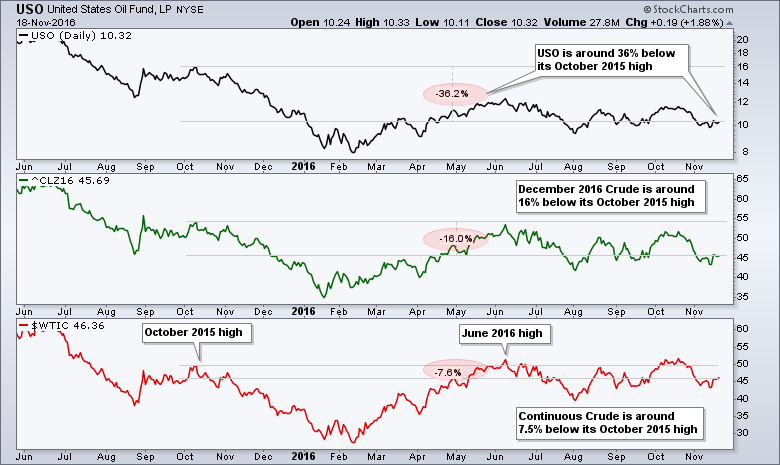
Near-by Futures, Continuous Futures and ETFs .... December Crude Shows Signs of a Reversal .... Brent Crude is Holding up Better .... Upside Targets for Light Crude and Bren .... Energy Breadth Still Bullish Overall .... XLE Extends Choppy Uptrend ...... Read More
Art's Charts November 18, 2016 at 10:07 AM
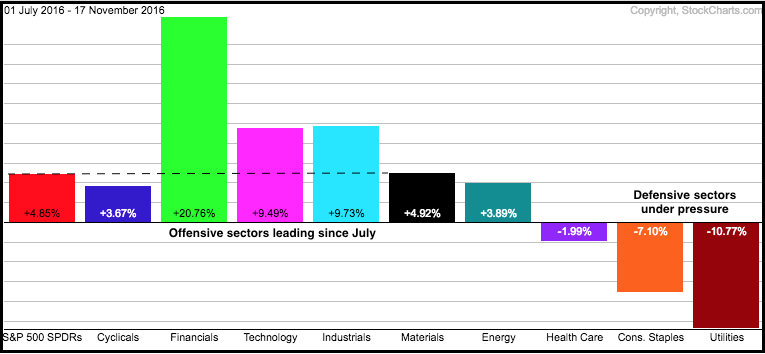
Offensive Sectors Lead Defensive Sectors ..... Consumer Discretionary ETFs Hit New Highs .... Risk Ratios Hit New Highs .... This Week's Articles and ChartList .... Another Bullish Breadth Surge .... Marking Pullback Support for SPY .... Biotech ETFs Hold Gaps ...... Read More
Art's Charts November 17, 2016 at 07:45 AM
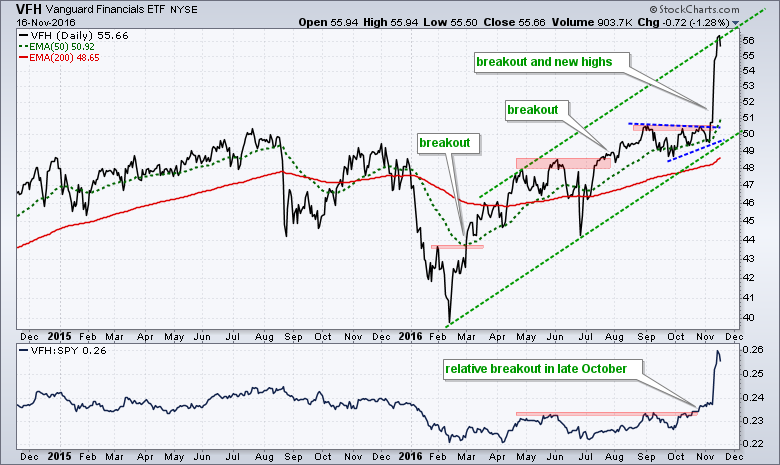
Vanguard Financials ETF Hits Channel Trend Line .... Spotting Pullbacks within an Uptrend .... Trading with MACD-Histogram and RSI .... Scan Code for Pullbacks .... Microsoft and Apple Trigger Signals.... //// ...... Read More
Art's Charts November 15, 2016 at 09:21 AM
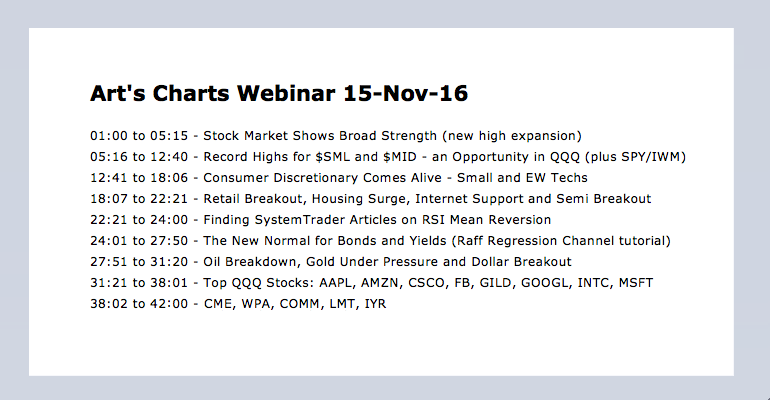
--- Webinar Video --- Art's Charts Chartlist --- Stock Market Shows Broad Strength .... Record Highs in Mid-cap and Small-cap Indexes .... Don't Blame the Entire Tech Sector .... SPY Holds Breakout .... XLY Surges to Resistance Zone ...... Read More
Art's Charts November 11, 2016 at 10:58 AM
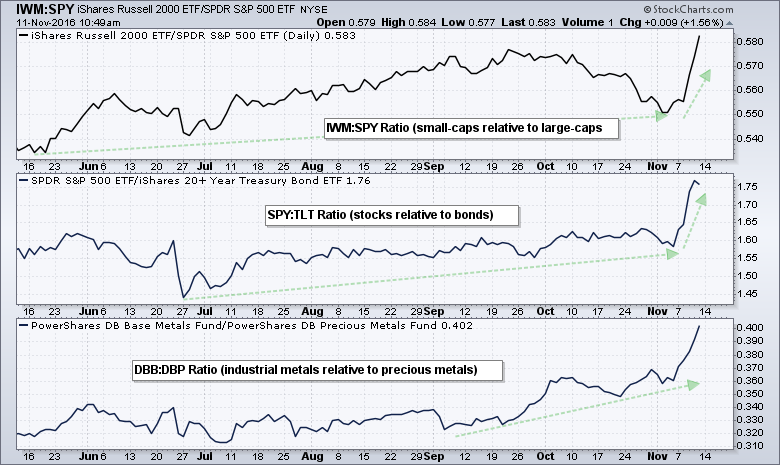
Three Ratios Showing Risk-On .... Small-caps Lead New High Expansion .... Finding and Scanning for New Highs .... How to Use a New High List .... Notes from the MTA Meeting ... A Relative Breakdown for EEM .... //// ...... Read More
Art's Charts November 10, 2016 at 08:20 AM
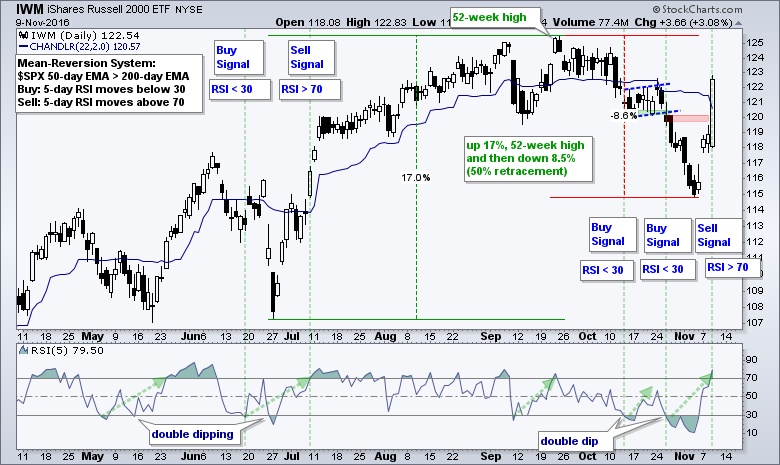
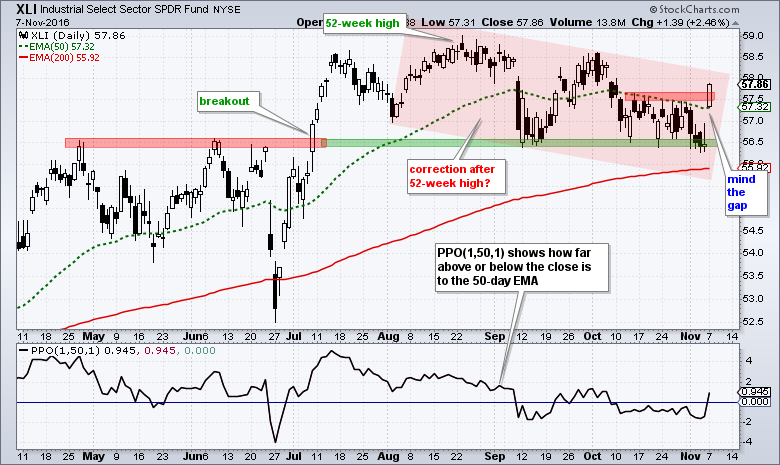
Mean-Reversion Strategy Hits Key Level .... SPY Breaks Out of Corrective Channel .... Finance, Industrials and Materials Dominate New High List .... Ranking Sectors by %Above 200-day EMA .... Industrials, Materials and Mining Surge Together ...... Read More
Art's Charts November 09, 2016 at 07:20 AM
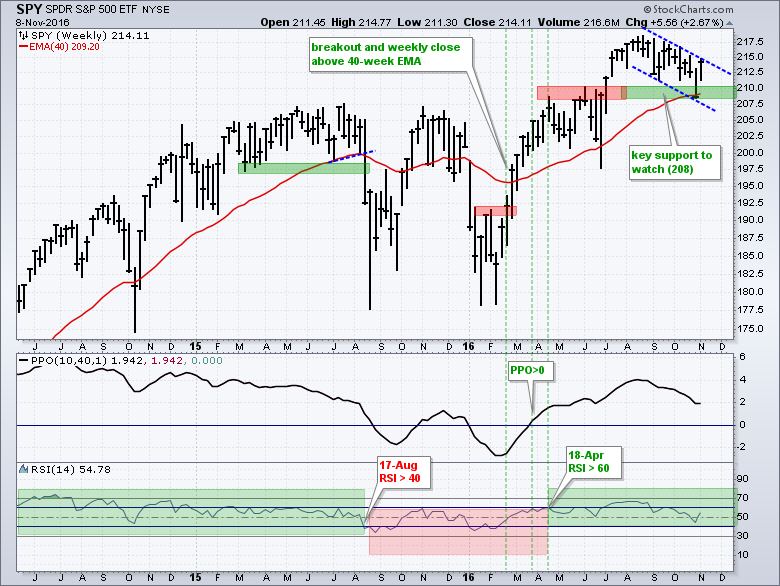
Key Levels and Indicators to Watch for SPY .... Indicators are Not Bearish until they Trigger .... Treasury Yields Surge .... Will Correlations with the 10-yr Yield Hold Up? .... Biotech ETFs Try for Higher Lows.... //// ...... Read More
Art's Charts November 08, 2016 at 08:41 AM
Finance, Tech and Industrials Show Chart Leadership .... Copper and Aluminum Go for Big Breakouts .... Using RSI Ranges to Define the Trend .... Gold Indicators are Bullish, but Price Breakdown Looms .... Rising 10-yr Yield is Negative to Gold ...... Read More
Art's Charts November 07, 2016 at 09:32 AM
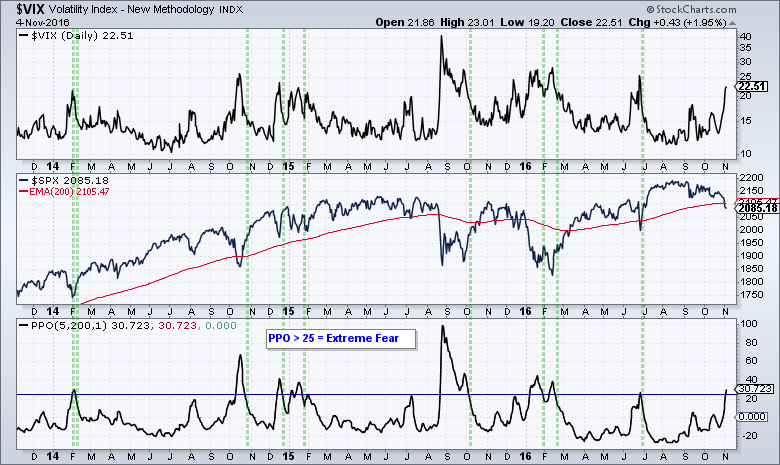
The S&P 500 fell softly (~3%) over the last nine trading days and the S&P 500 Volatility Index ($VIX) surged over 70%. This surge puts $VIX at its highest level in over three months - but this is not necessarily bearish... Read More
Art's Charts November 05, 2016 at 04:03 AM
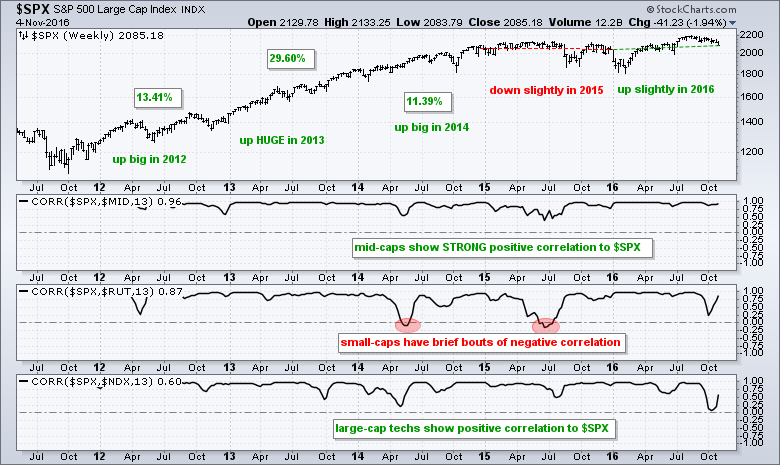
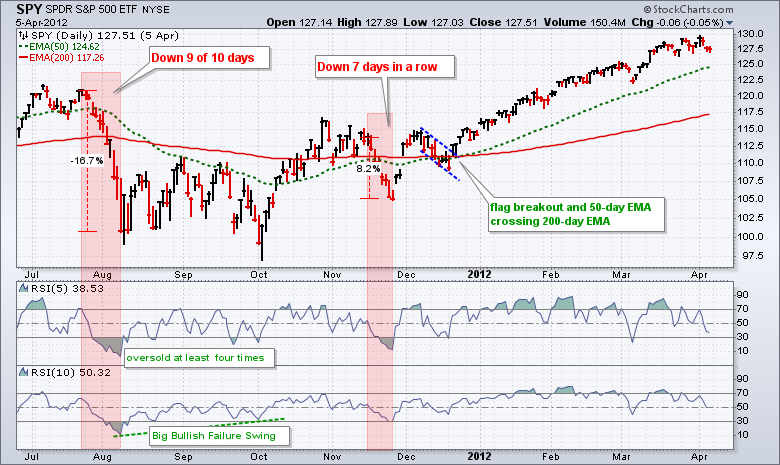
SystemTrader .... Why Focus on the S&P 500? .... Moving Averages Love Whipsaws .... Adding a Smooth Operator .... Backtesting Moving Average Performance .... Scaling into Positions with Moving Averages .... Backing testing an Array of EMAs .... Conclusions.... //// ...... Read More
Art's Charts November 03, 2016 at 11:17 AM
Another Seven Day Decline .... Channel Defines Correction in SPY .... Revisiting the Mean-Reversion Strategy .... Is Mean-Reversion Broken? .... Strike Two for the S&P 500 .... Benchmark Lows to Find Chart Leaders and Laggards .... Revisiting the ETF Scan .... //// ...... Read More
Art's Charts November 01, 2016 at 09:33 AM
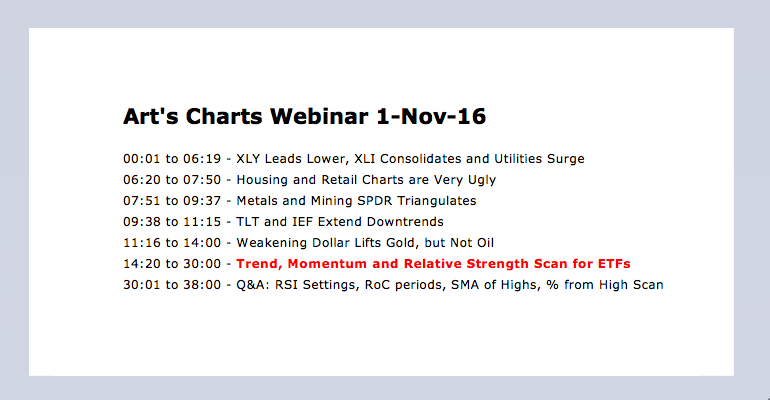
Webinar Video -- Art's Charts ChartList Performance for the First Ten Months .... Two Steps Forward and One Step Backward .... SPY Holds with a Spinning Top .... QQQ Continues to Lead .... RSI Does the Double Dip for IWM .... Webinar Preview .... //// ...... Read More