Art's Charts October 31, 2016 at 10:33 AM
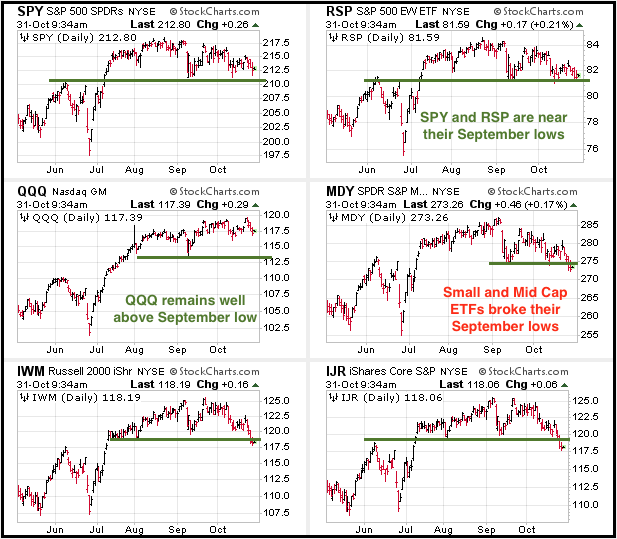
Major Index ETFs are Not that Far from Recent Highs .... Sticking with the Strategy .... Breadth Indicators Soften During Correction .... Small and Mid Caps Lead Breadth Pullback .... Breadth Summary and Conclusions .... //// ...... Read More
Art's Charts October 28, 2016 at 11:51 AM
Lots of Low Liquidity .... Getting the ETF Master ChartPack .... Filtering for an Uptrend .... Ranking by StockCharts Technical Rank .... Ranking By Rate-of-Change .... Narrowing and Exporting Scan Results .... Analyzing with CandleGlance and RSI .... Conclusions .... //// ...... Read More
Art's Charts October 27, 2016 at 08:16 AM
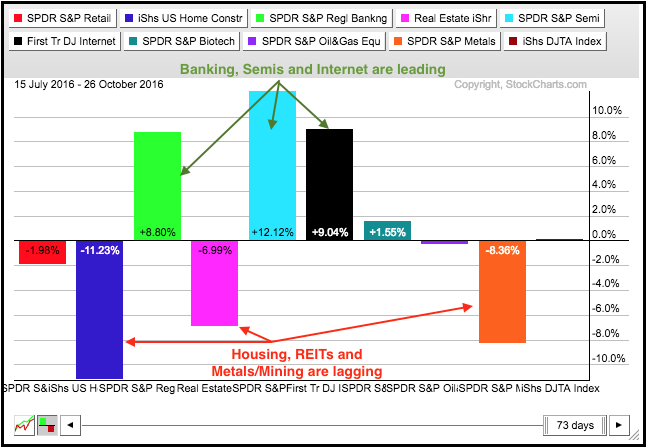
Performance Discrepancies Abound in Key Industry Groups .... The Problem with Support Breaks in an Uptrend (SPY, QQQ) .... Pattern Trading versus Mean-Reversion Systems (IWM) .... Day of Divergence (Breadth) .... Industrials Versus Consumer Discretionary ...... Read More
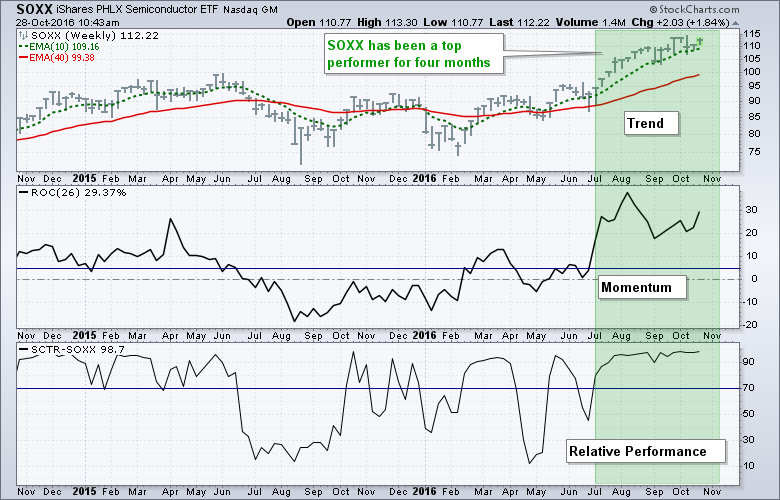
Art's Charts October 25, 2016 at 10:05 AM
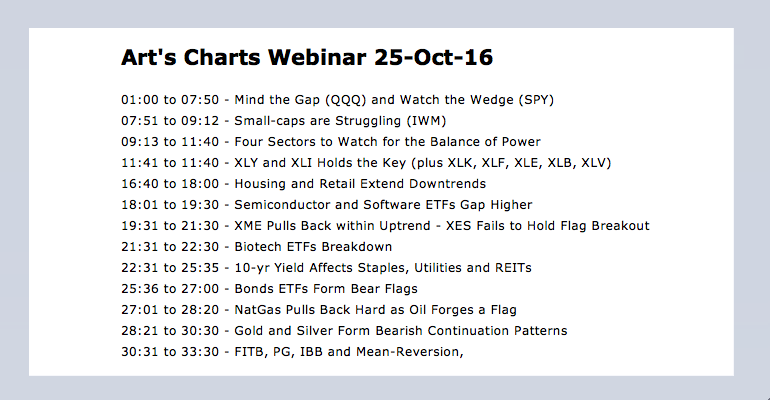
Webinar Video Link .... Art's Charts ChartList Link .... Weighing the Balance of Power for the Market Sectors .... XLY Surges off 200-day EMA .... XLI Could Tilt the Balance of Power .... Falling Wedges for Retail and Housing ETFs .... Software iShares Nears New High ...... Read More
Art's Charts October 24, 2016 at 11:29 AM
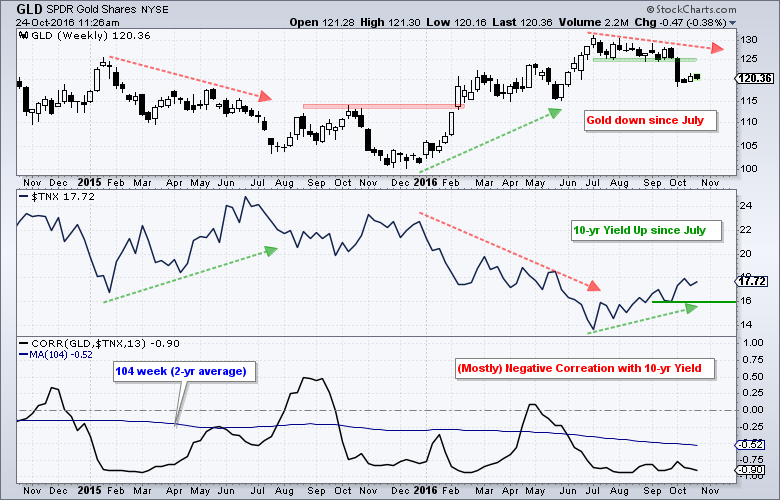
Investors looking to time gold should pay close attention to the 10-yr Treasury yield because these two show a strong negative correlation over the last two years. This means they move in opposite directions... Read More
Art's Charts October 24, 2016 at 07:11 AM
Nowhere is not Necessarily Bearish .... Consumer Discretionary Shows Relative Strength .... Five Key Risk Ratios Remain Bullish .... Breadth Indicators Soften During Correction .... Mean-reverting with Breadth Indicators .... SPY Holds Mean-Reversion Bounce ...... Read More
Art's Charts October 21, 2016 at 09:11 AM
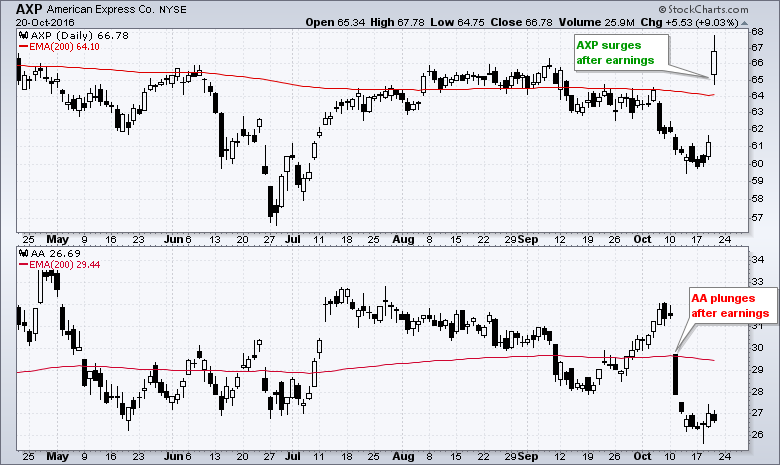
Quantifying the Reaction to Earnings .... Scan Code for Big Movers .... Low Volume and JETS .... Apple Dwarfs the Entire Airline Group .... Using PerfCharts to Compare Airlines Performance .... Using RRGs to Measure Relative Performance for Airlines ...... Read More
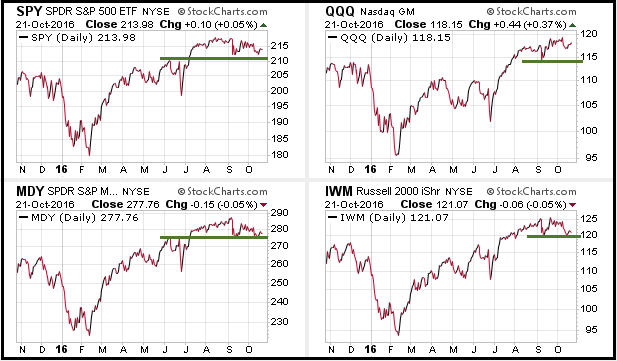
Art's Charts October 20, 2016 at 07:50 AM
QQQ Leads the Big 3 .... SPY Forms Small Wedge .... Finance and Tech Power IWM .... Changing to Vanguard Finance ETF .... Groups Going Off the Radar .... Still Watching Retail and Housing .... Steel Stocks Propel Metals & Mining SPDR .... Airline ETF Gets Two Breakouts ...... Read More
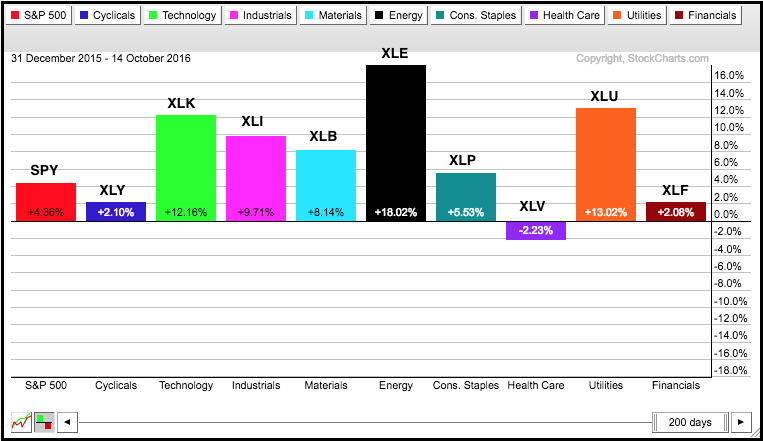
Art's Charts October 18, 2016 at 09:32 AM
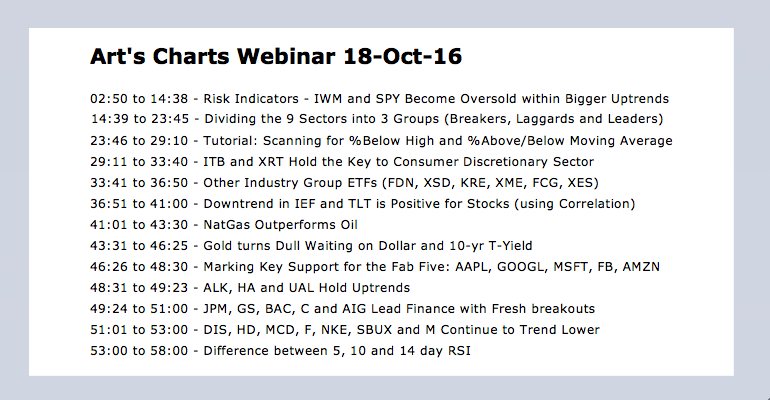
Three Sector Breaks Remain in Play .... The Three Big Laggards - XLV XLP XLU .... Tech, Finance and Energy Continue to Lead .... RRG Reflects Current Sector Rotations .... NatGas Continues to Lead Oil .... Webinar Video .... //// .... Click here for the webinar video... Read More
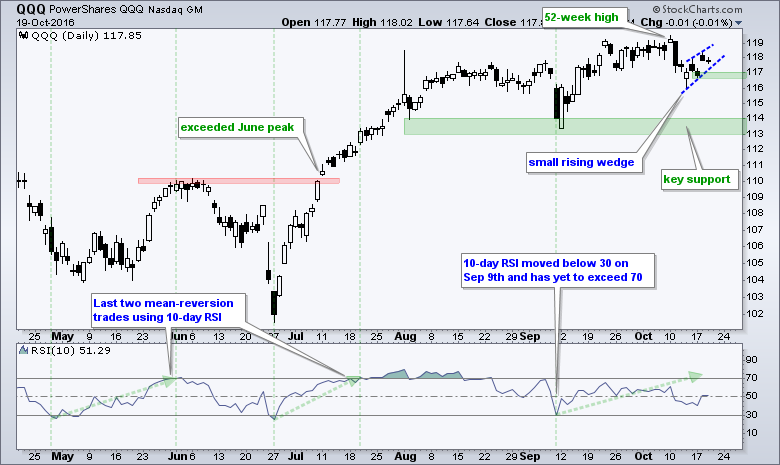
Art's Charts October 17, 2016 at 07:47 AM
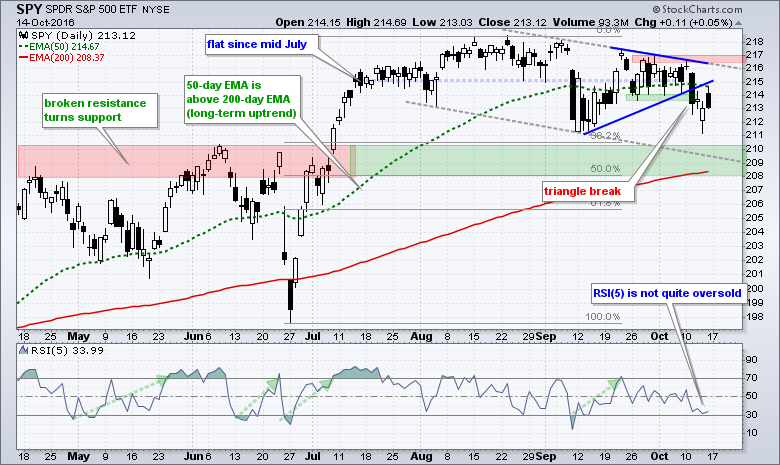
SPY Holds Triangle Break .... Testing the Mean-Reversion Strategy with IWM and QQQ .... IWM Gaps towards Big Support Zone .... QQQ Remains with Active RSI Signal .... Do Stops Matter? .... Consumer Discretionary Sector Teeters .... Sector Trend and Breadth Table .... //// ...... Read More
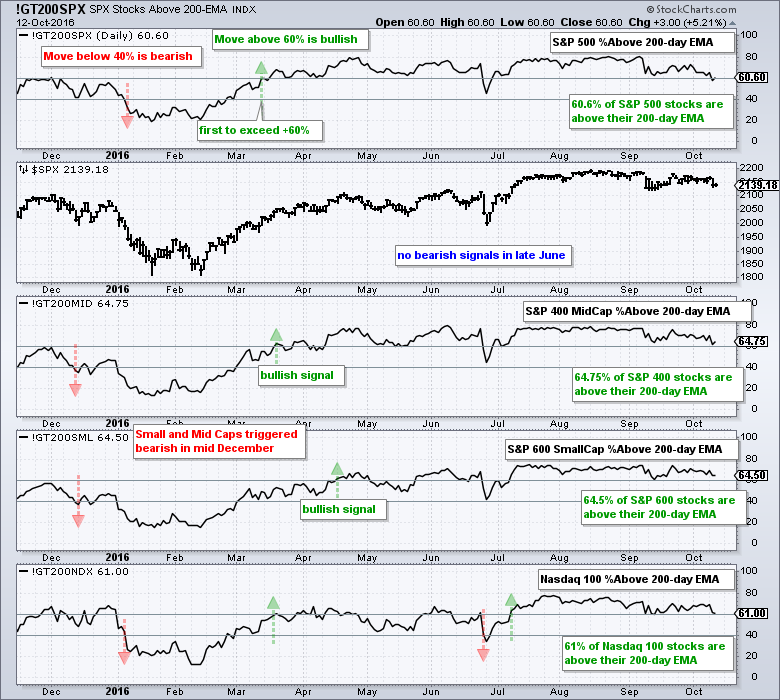
Art's Charts October 15, 2016 at 08:28 AM
A Negative Week, but a Positive Year .... Broader Market is Seriously Mixed .... S&P 500 Stalls above its Breakout Zone .... Small-caps and Mid-caps Sport Corrective Patterns .... Breadth Indicators Can Foreshadow Significant Changes .... Large-cap Breadth Remains Bullish ...... Read More
Art's Charts October 13, 2016 at 09:19 AM
Using Breadth to Determine a Long-term Bias .... Short-term Breadth Indicators Become Oversold .... The 800-pound Gorilla in the Room .... Six of Nine Sectors Remain with Long-term Bullish Signals .... Revisiting the RSI Mean-Reversion System for SPY ...... Read More
Art's Charts October 12, 2016 at 11:36 AM
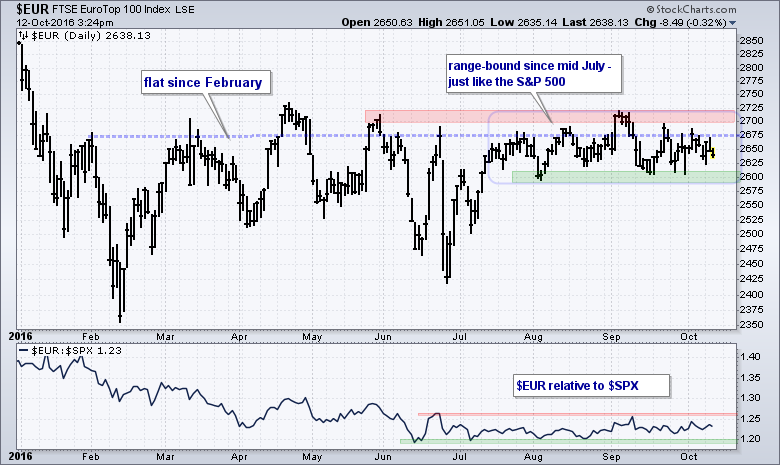
As with the S&P 500, the Eurotop 100 ($EUR) has gone nowhere since mid July and I am focused on the recent range for the first directional clues. Trading is quite choppy within the range and it remains anyone's guess what will happen within this range... Read More
Art's Charts October 11, 2016 at 08:52 AM
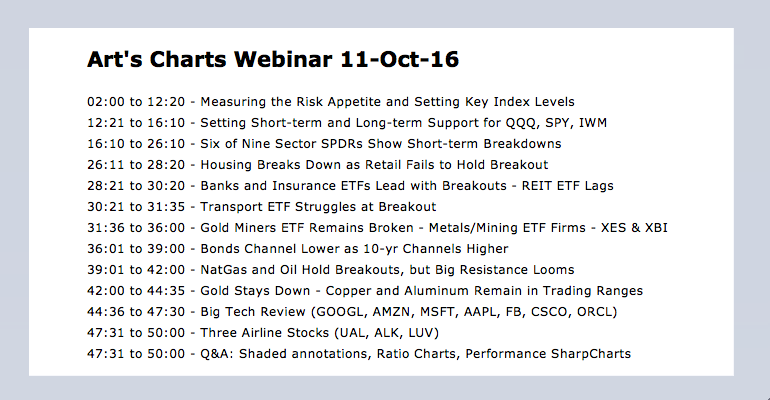
Is Stalling Bullish or Bearish? .... Key Risk Indicators Remain Net Bullish .... Technology, Finance and Energy Lead .... Consumer Discretionary Groups Lag Long-term, But Lead Short-term .... Retail SPDR Attempts Breakout, But Housing Breaks Down .... //// ...... Read More
Art's Charts October 08, 2016 at 05:54 AM
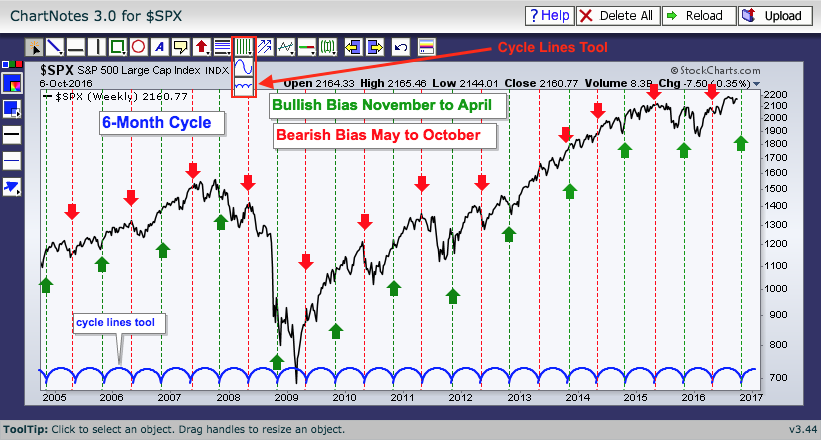
Introduction .... Background for the Best Six Month Strategy .... Seasonal Patterns Don't Always Work .... Testing the Classic Six-Month Cycle .... Tweaking the Cycle to Account for Seasonality .... Add Market Timing with weekly MACD .... SPY, MACD and Seasonality Now ...... Read More
Art's Charts October 06, 2016 at 08:57 AM
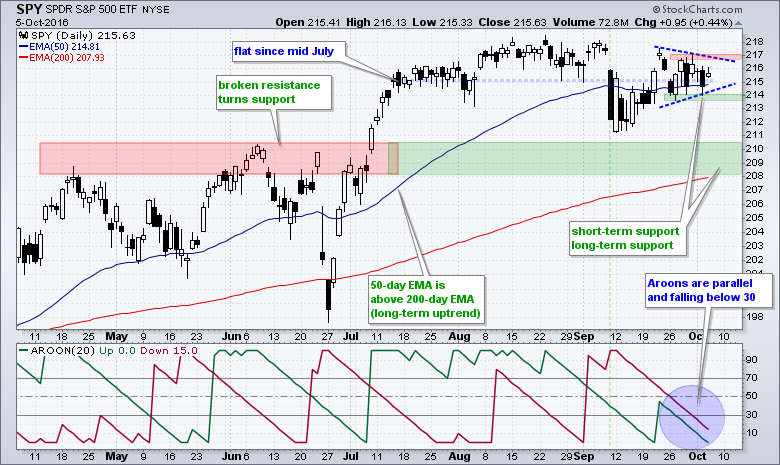
Aroon Indicators Crash on SPY Chart .... IWM and QQQ Continue to Outperform .... Financials, Utilities and the 10-yr Yield .... Short-term Yields Rising Faster than Long-term Yields .... Plotting, Analyzing and Scanning with Bollinger Bands .... ChartList Update .... //// ...... Read More
Art's Charts October 04, 2016 at 09:42 AM
September was Dull .... October has a History .... Shifting the Seasonality Chart for Two Views .... The VIX versus the Volatility ETNs .... Webinar Video .... //// .... Click here for the Webinar Video September was Dull October is here and the consensus is for a volatile month... Read More
Art's Charts October 03, 2016 at 09:00 AM
Broad Market Breadth Remains Bullish .... SPY Holds above Resistance Break .... 7-10 YR T-Bond ETF Fails to Hold Gains .... Oil Breaks a Wedge .... A Couple Dozen Charts to Watch .... //// ...... Read More