ChartWatchers October 26, 2019 at 12:14 AM
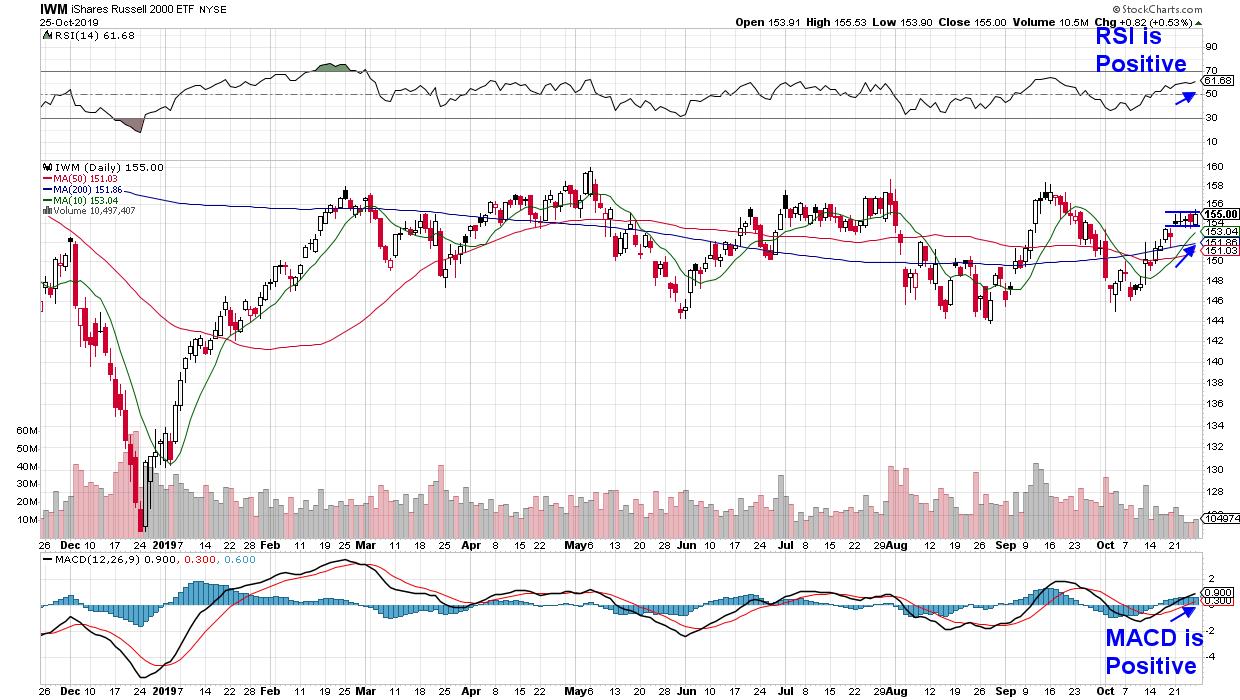
The Russell 2000 Index bullishly broke back above its key simple moving averages over a week ago and, as you can see in the chart below, this Index has been able to remain above this key area of support... Read More
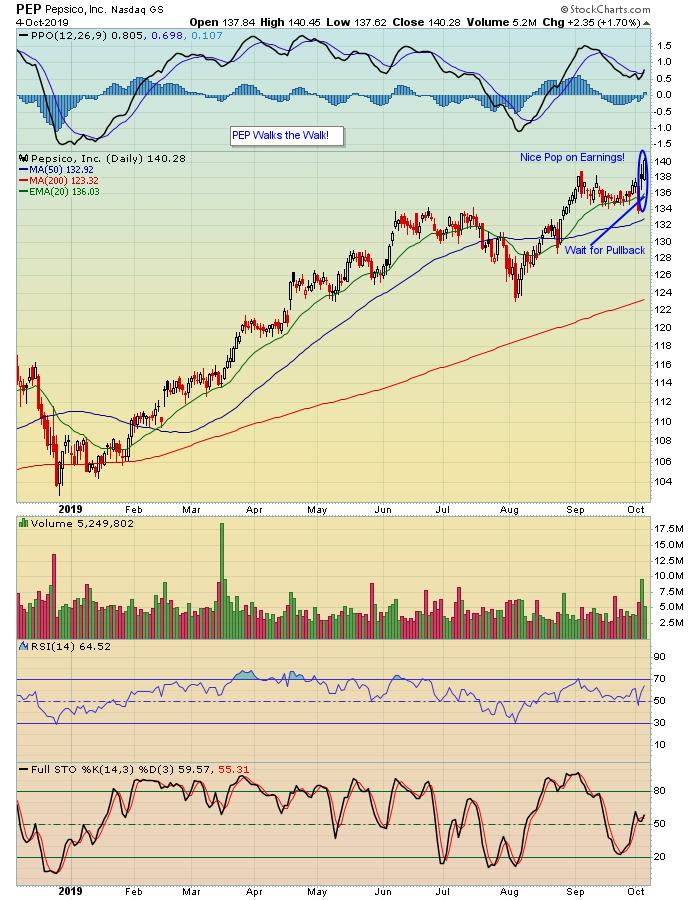
ChartWatchers October 25, 2019 at 06:48 PM
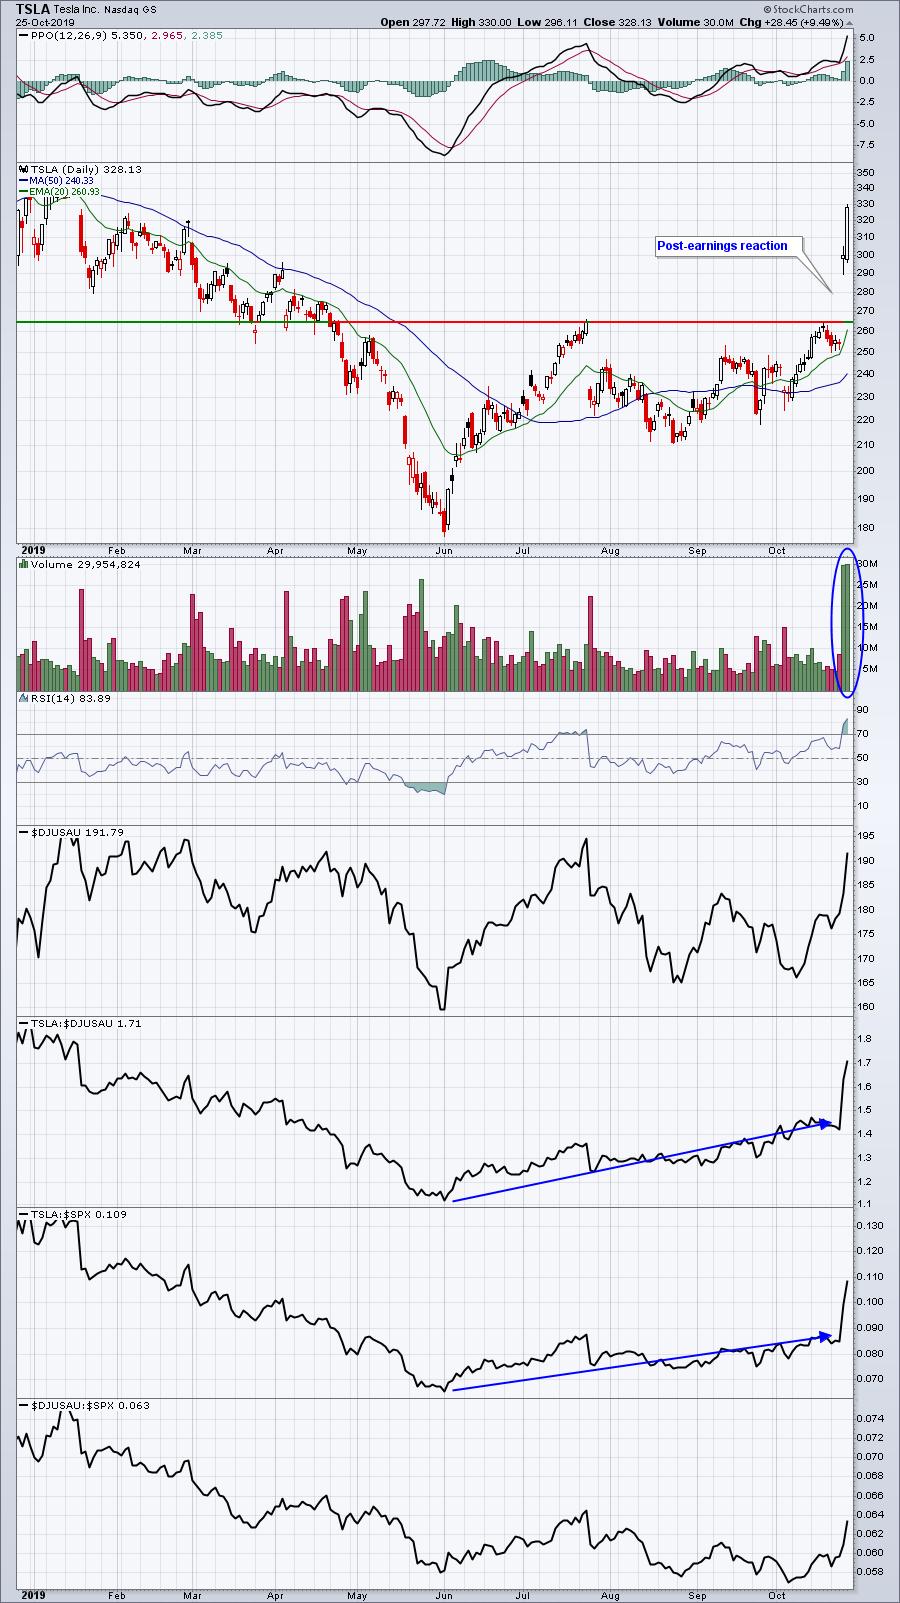
On each of the past two Mondays, I've hosted webinars that have highlighted stocks poised to trend higher with earnings results. It's a concept I discuss frequently and most of it has to do with relative strength. If Wall Street is accumulating, we need to take notice... Read More
ChartWatchers October 25, 2019 at 06:35 PM
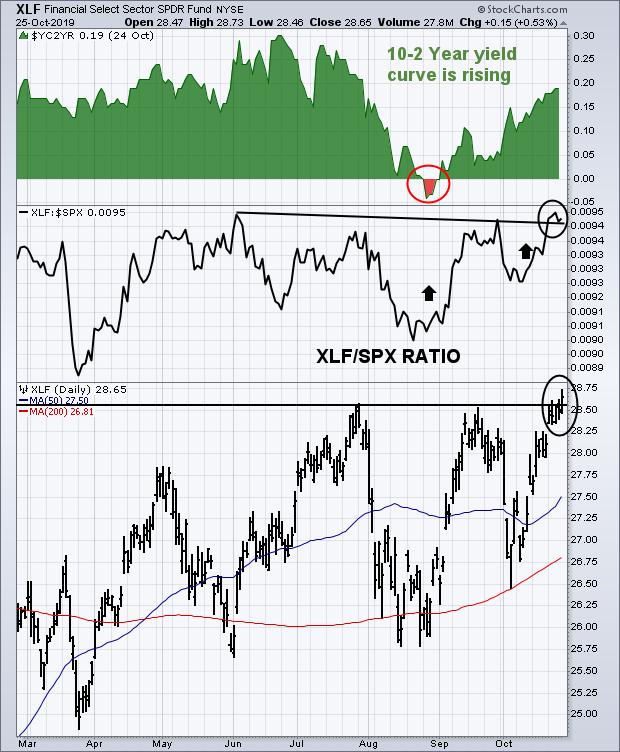
Editor's Note: This article was originally published in John Murphy's Market Message on Friday, October 25th at 5:04pm ET. A lot of positive groups rotations have taken place in the stock market over the past two months... Read More
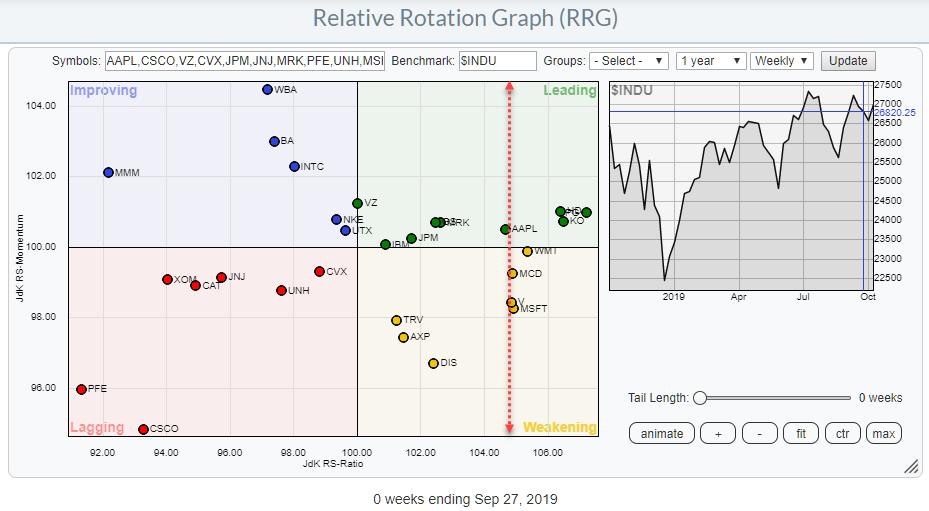
ChartWatchers October 25, 2019 at 04:16 PM
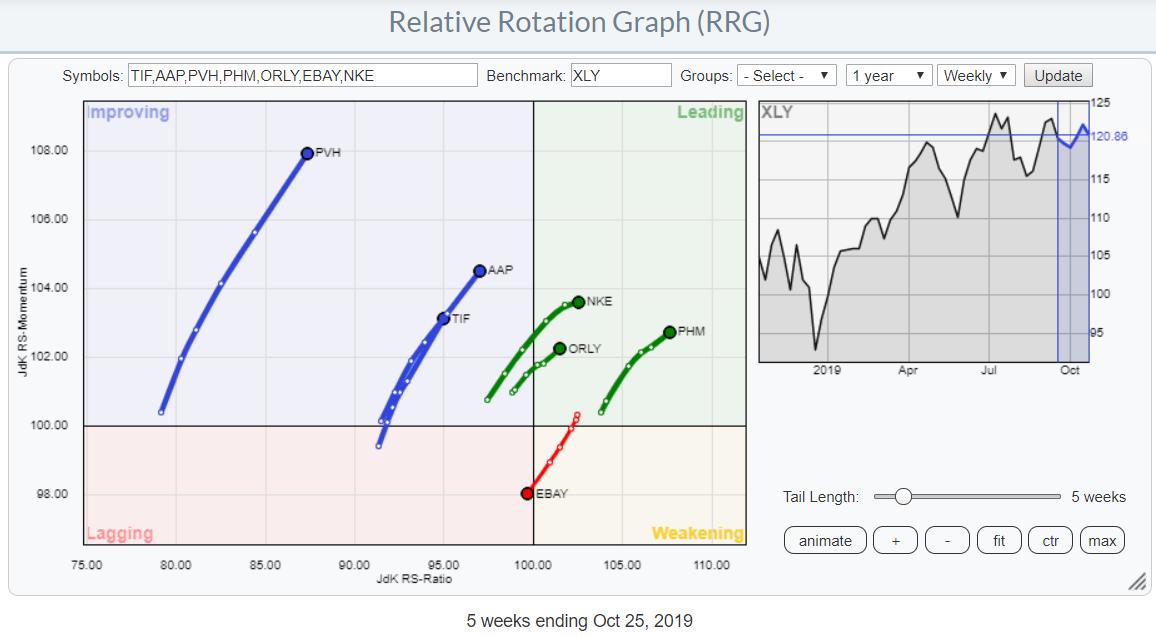
In last week's Sector Spotlight episode, I discussed the positive rotation of the Consumer Discretionary sector on RRG. During the live show, I focused (too much) on the sector and only managed to talk about a few individual stocks... Read More
ChartWatchers October 19, 2019 at 02:17 AM
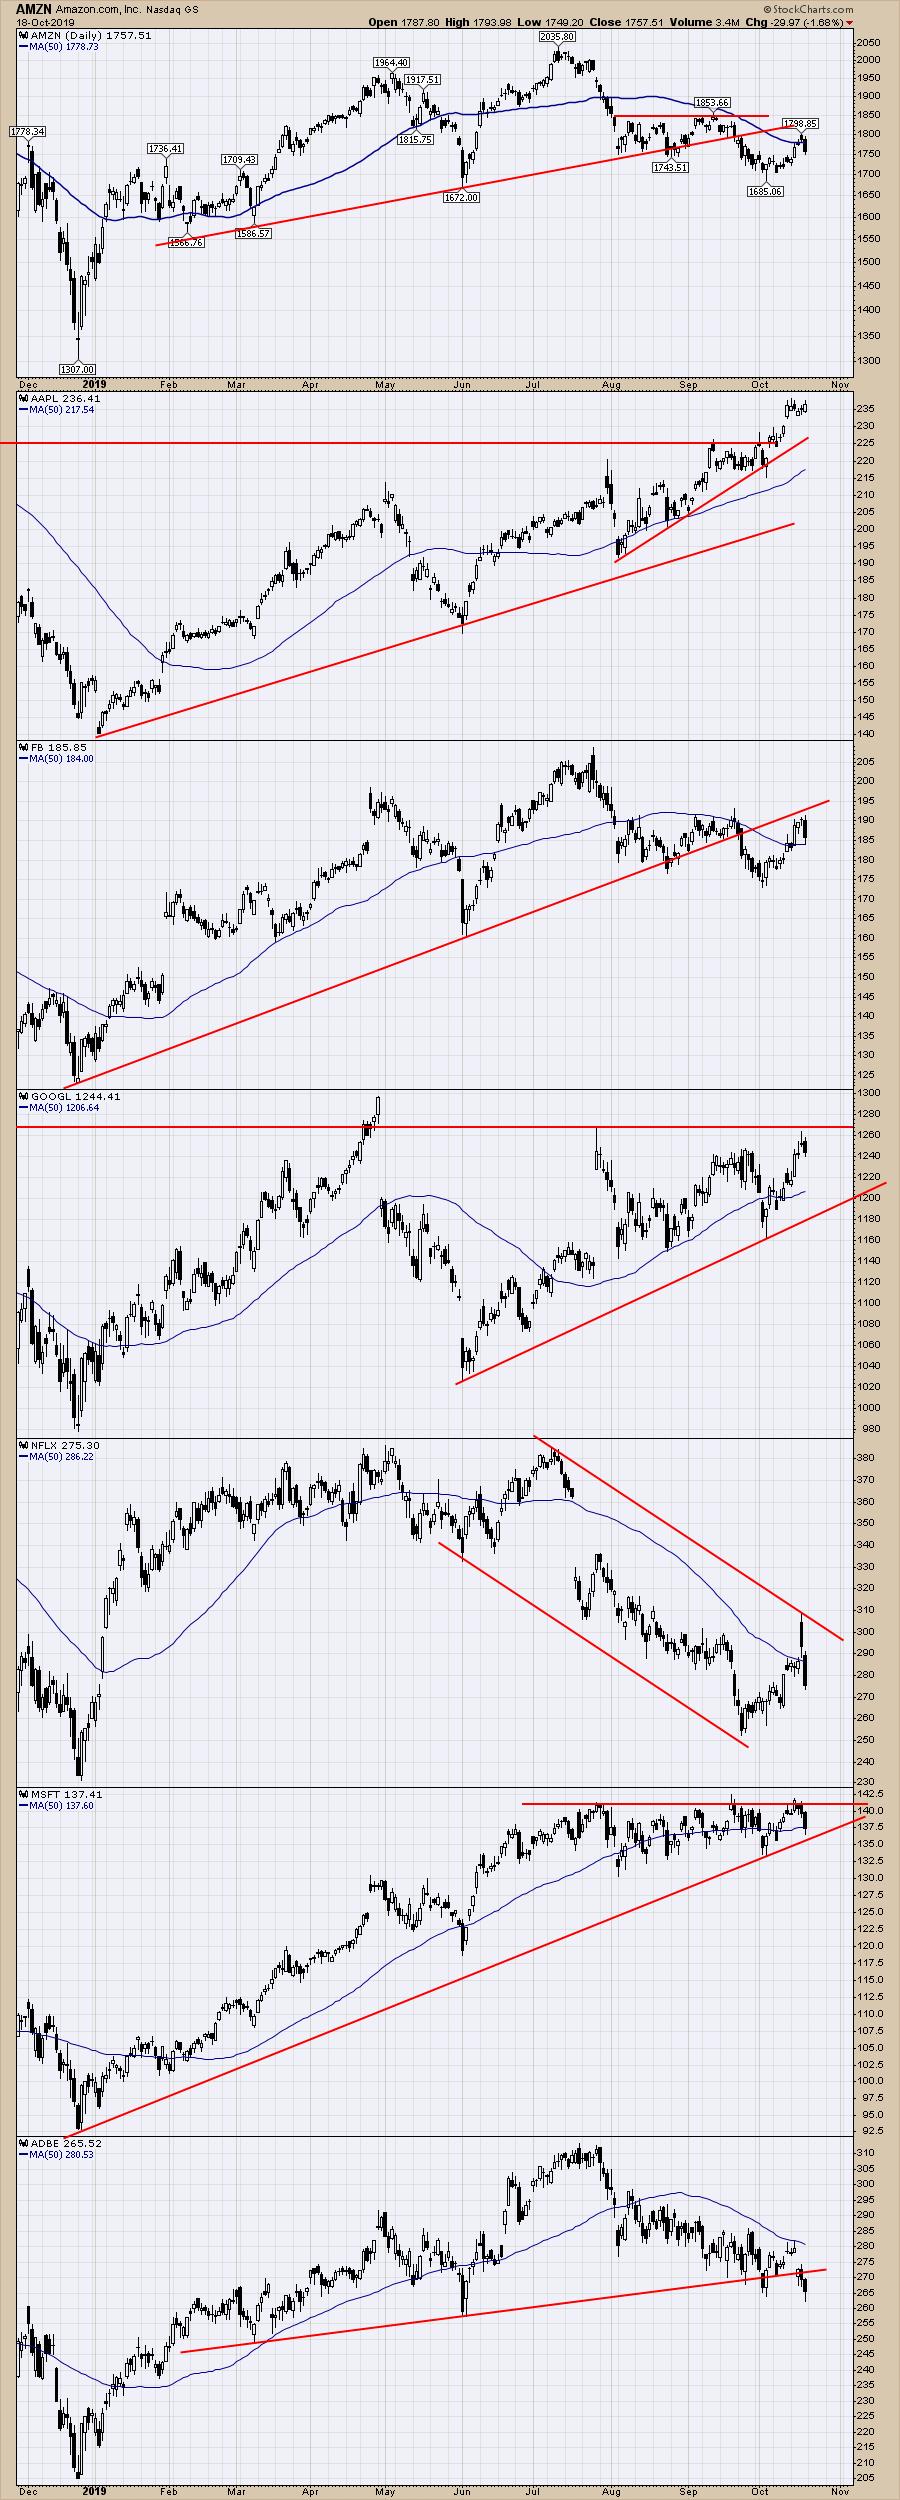
After another week of hope, Mr. $SPX under-delivers. There are some great-looking charts that are failing again today as the $SPX continues to get stuck around this 3000 level. Below are the FAANG stocks and a few more... Read More
ChartWatchers October 18, 2019 at 05:55 PM
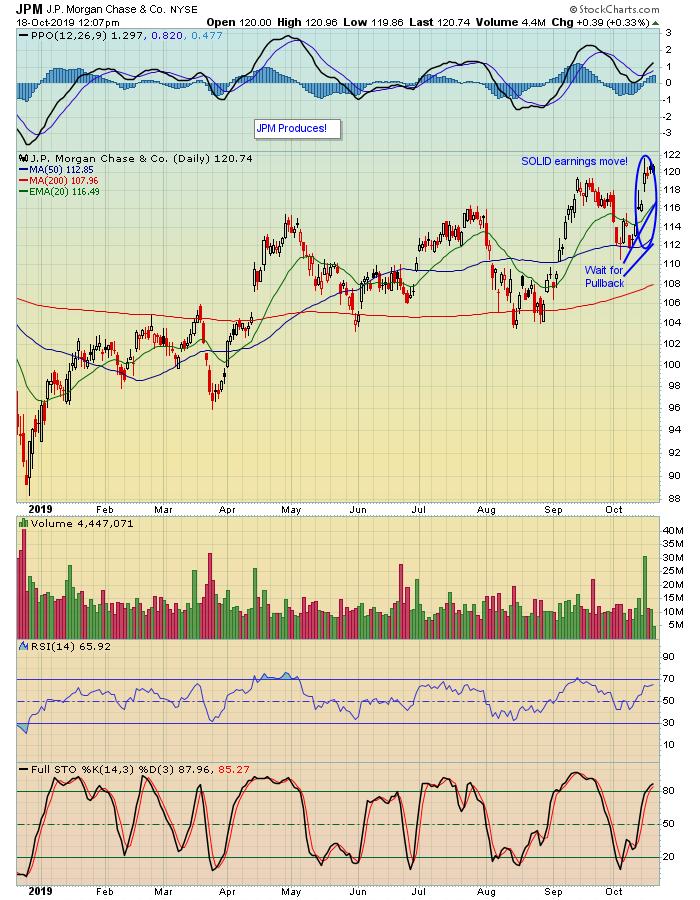
On Friday morning, Tom Bowley, Chief Market Strategist of EarningsBeats.com, and Mary Ellen McGonagle, president of MEM Investment Research, conducted a webinar that included identifying stocks reporting earnings next week that could make significant moves... Read More
ChartWatchers October 18, 2019 at 05:00 PM

The lack of new highs may seem like a concern, but one cannot talk about new highs without also looking at new lows because there are two sides to the story. The S&P 500 is within 2% of an all time high and there were just 28 new highs on Friday... Read More
ChartWatchers October 18, 2019 at 05:00 PM
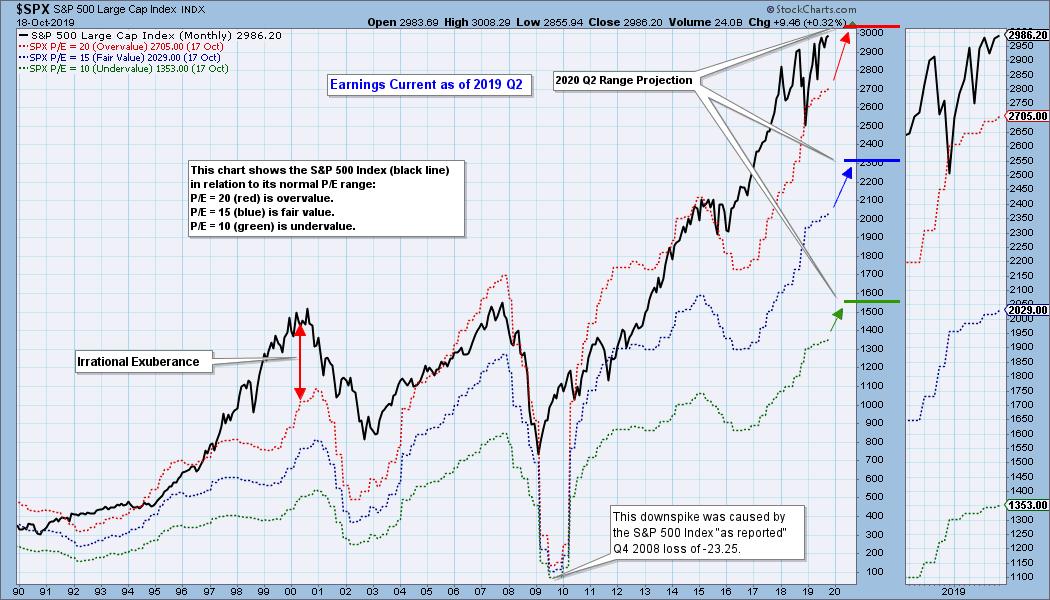
The S&P 500 earnings for 2019 Q2 were finalized a few weeks ago... Read More
ChartWatchers October 18, 2019 at 04:32 PM
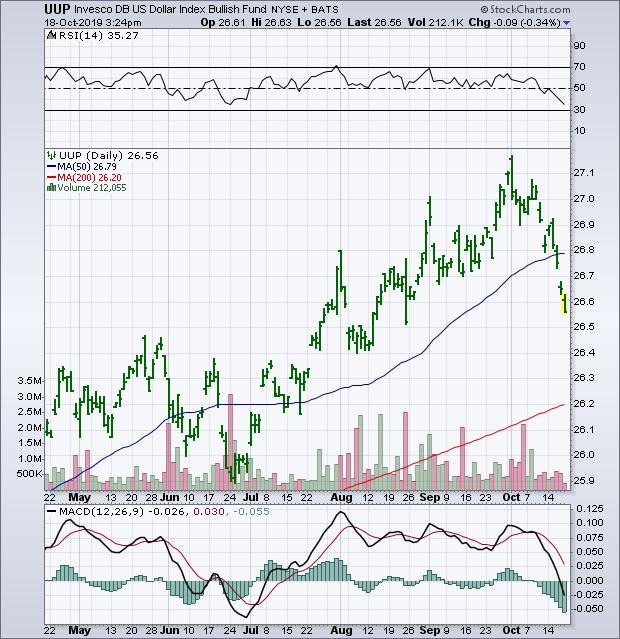
Editor's Note: This article was originally published in John Murphy's Market Message on Friday, October 18th at 4:23pm ET. Chart 1 shows the Invesco US Dollar Index Fund (UUP) falling this week to the lowest level in two months... Read More
ChartWatchers October 11, 2019 at 11:59 PM
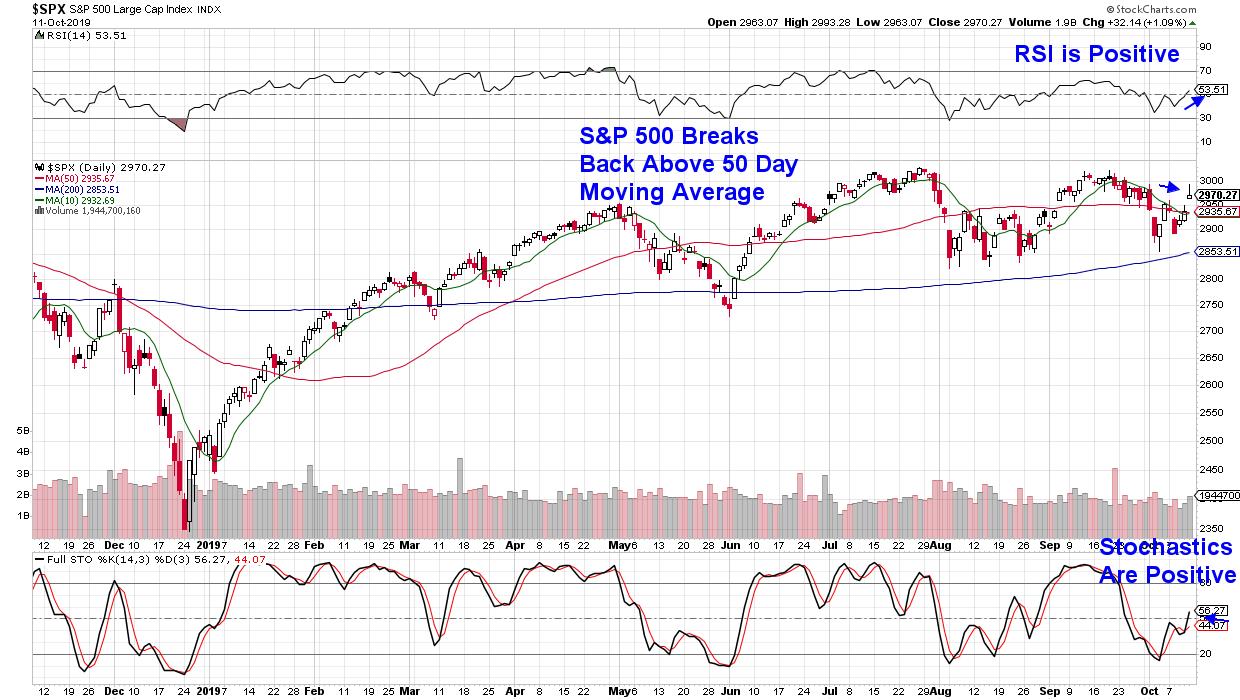
The markets closed out the week strong, with the S&P 500 jumping back above its key 50-day moving average on news of a partial US-China trade war deal... Read More
ChartWatchers October 11, 2019 at 08:00 PM
We just completed our second week of The Final Bar, the new closing bell show on StockCharts TV. During our Friday mailbag segment, I was asked about how institutional investors think about relative strength... Read More
ChartWatchers October 11, 2019 at 04:23 PM
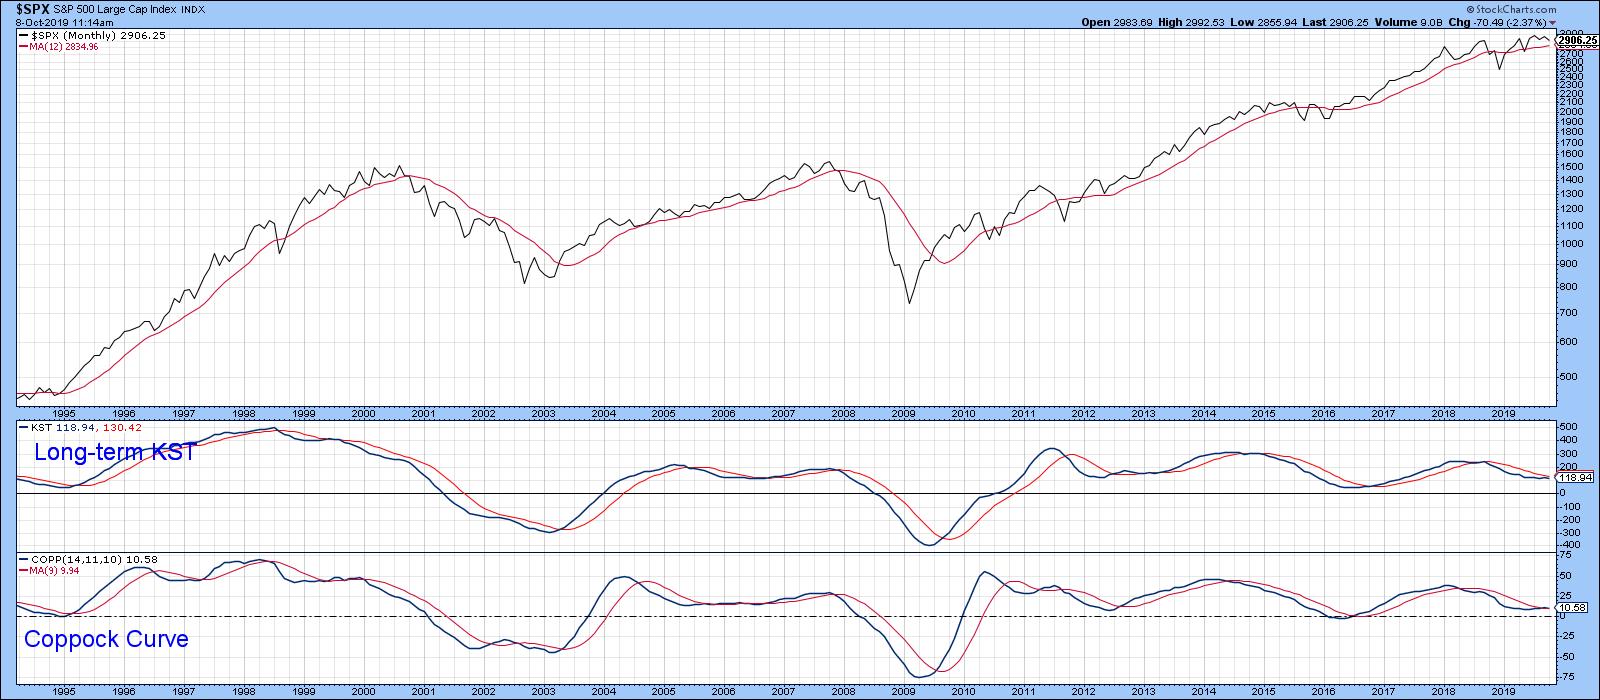
Editor's Note: This article was originally published in Martin Pring's Market Roundup on Tuesday, October 8th at 12:48pm ET. Short-term oscillators behave differently depending on the direction of the primary trend... Read More
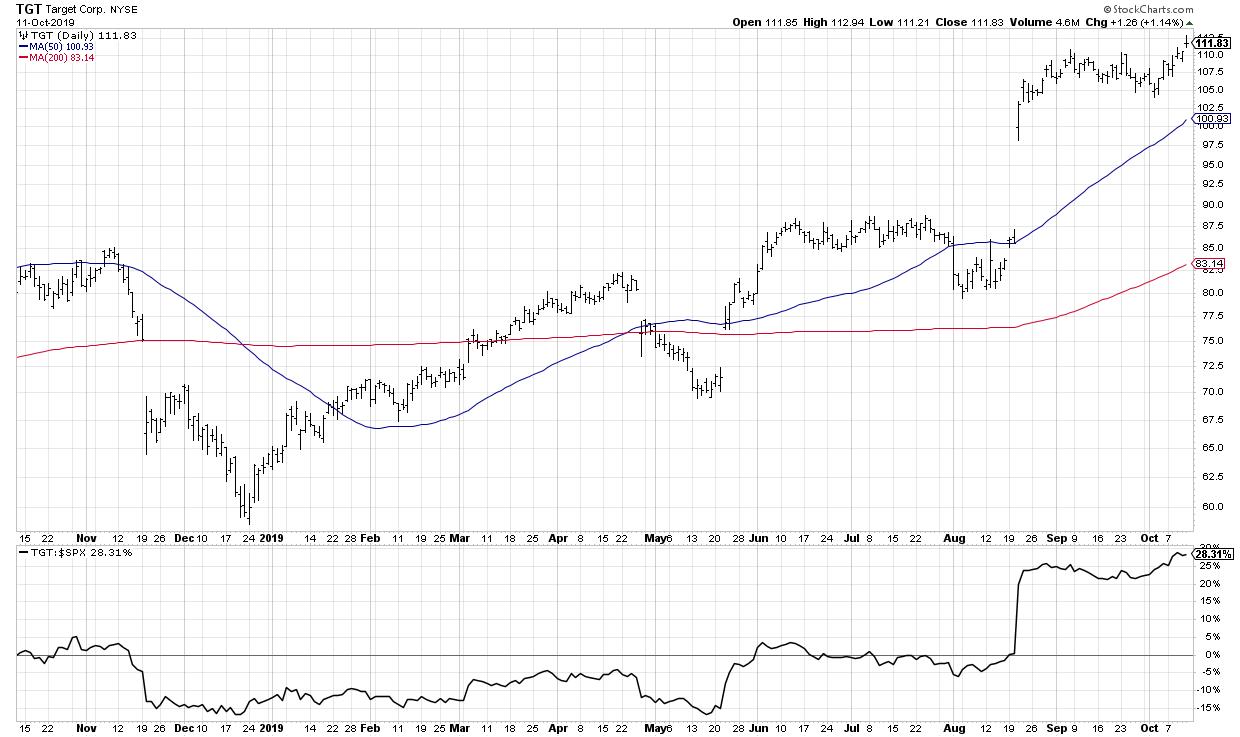
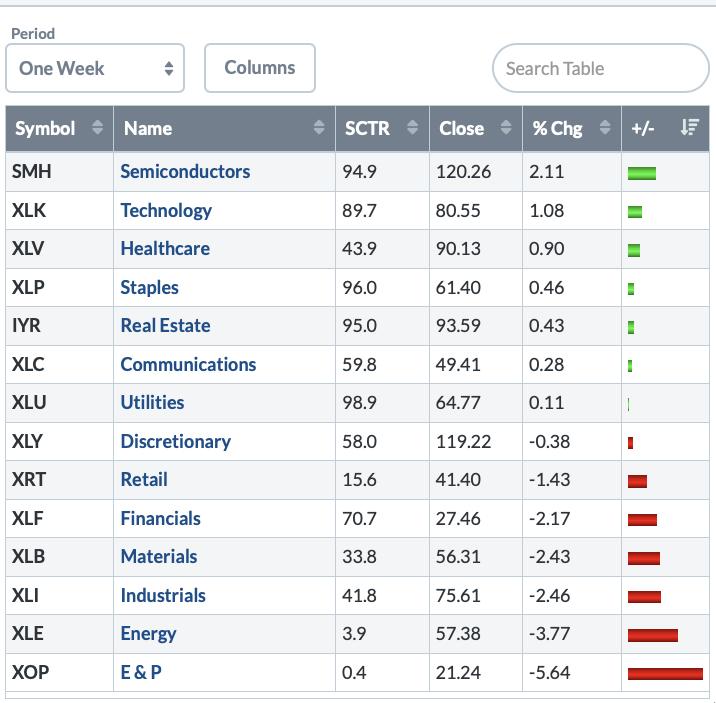
ChartWatchers October 11, 2019 at 03:00 PM
Wall Street has placed its bets as we work our way into earnings season. It's very easy to see which groups are favored by big money - just look where that money has been going... Read More
ChartWatchers October 11, 2019 at 12:41 PM
What Is Our Track Record? Ever since the launch of Relative Rotation Graphs on the Bloomberg professional terminal in 2011, some of the most frequently asked questions we've received have been "What's their track record", "How well do they perform?" and "What are the trading rule... Read More
ChartWatchers October 10, 2019 at 01:35 PM
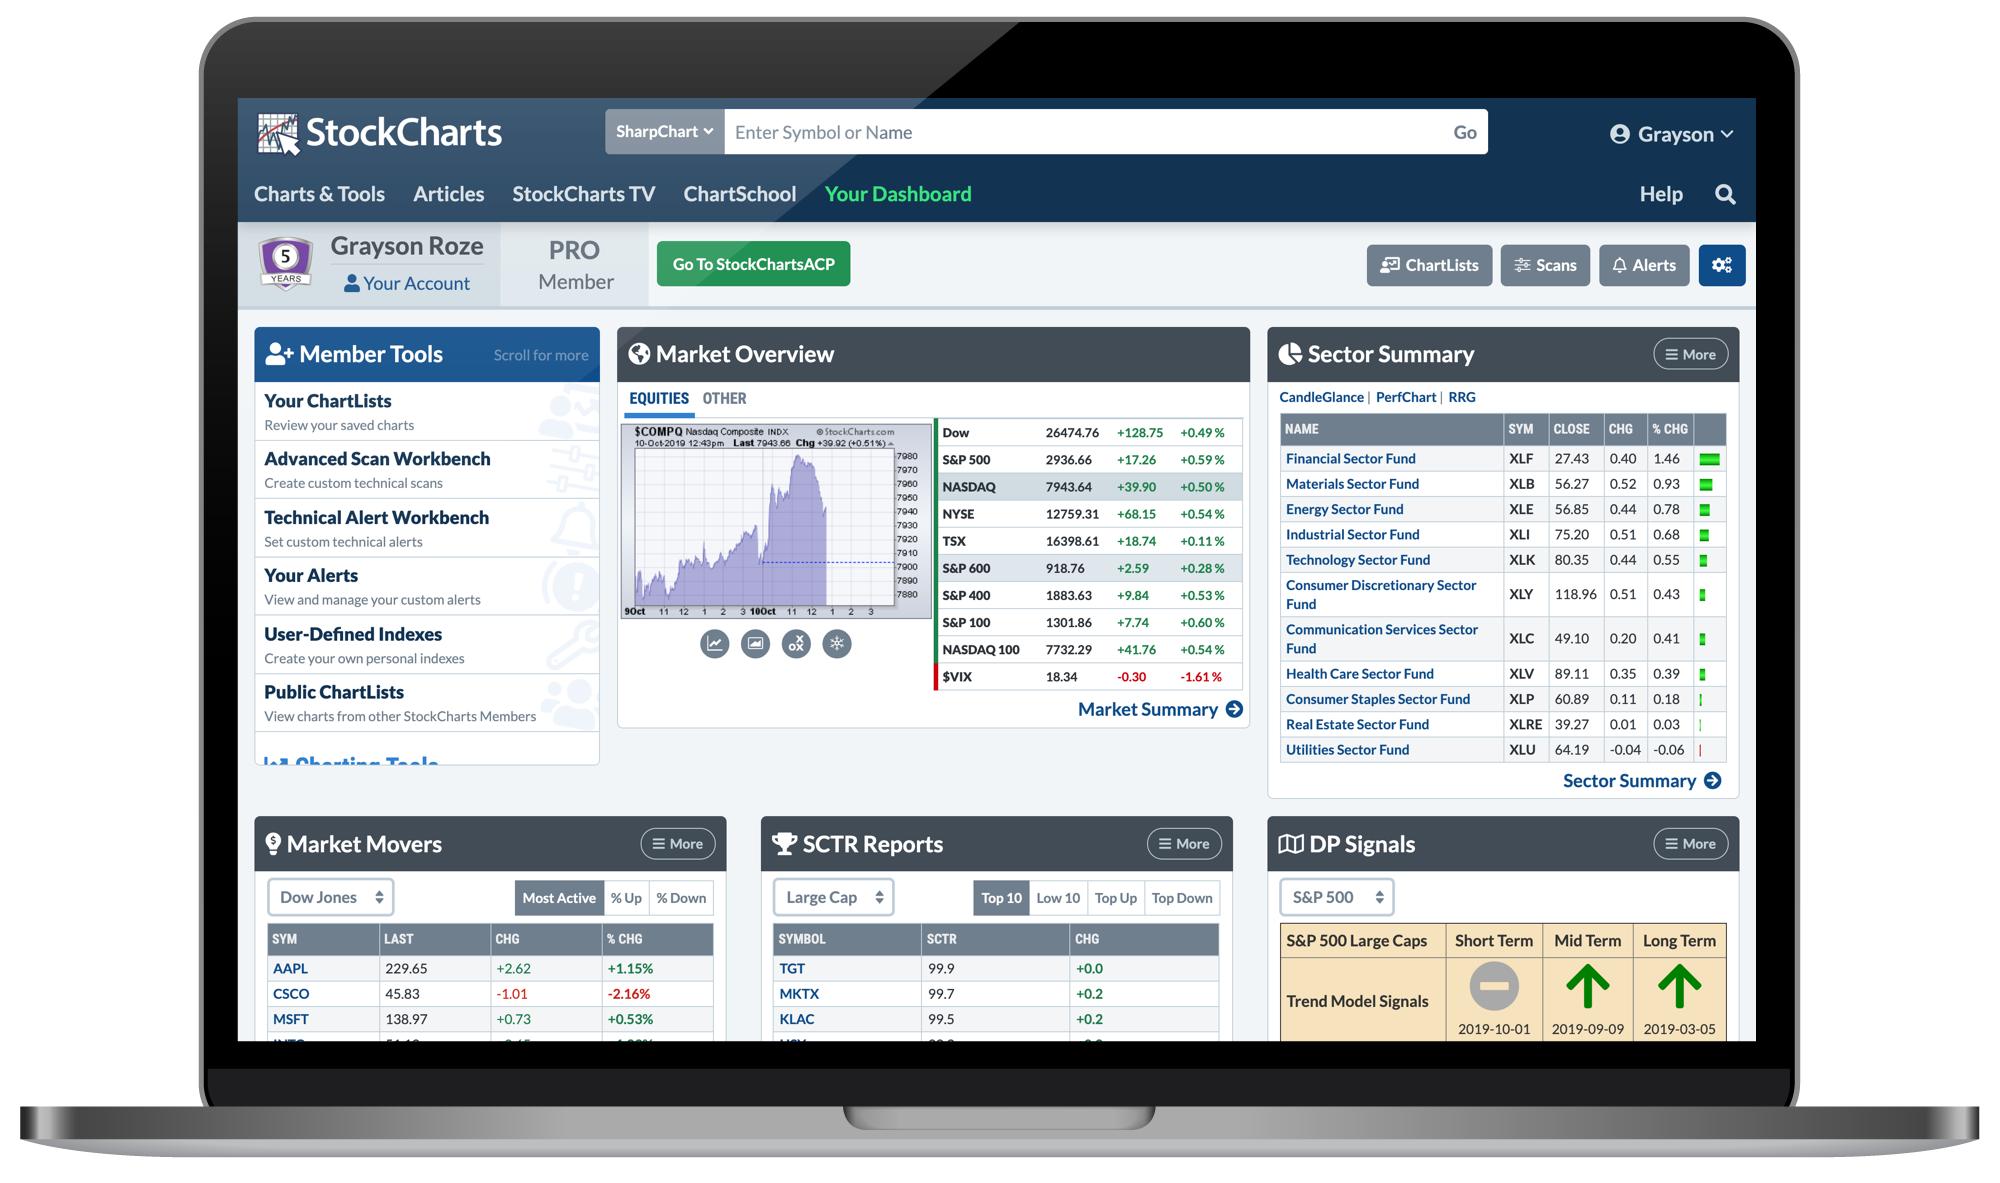
Hello Fellow ChartWatchers! Earlier this week, we released another round of upgrades and additions to your StockCharts Dashboard. I've always referred to the Dashboard as "the heart and soul of your StockCharts account"... Read More
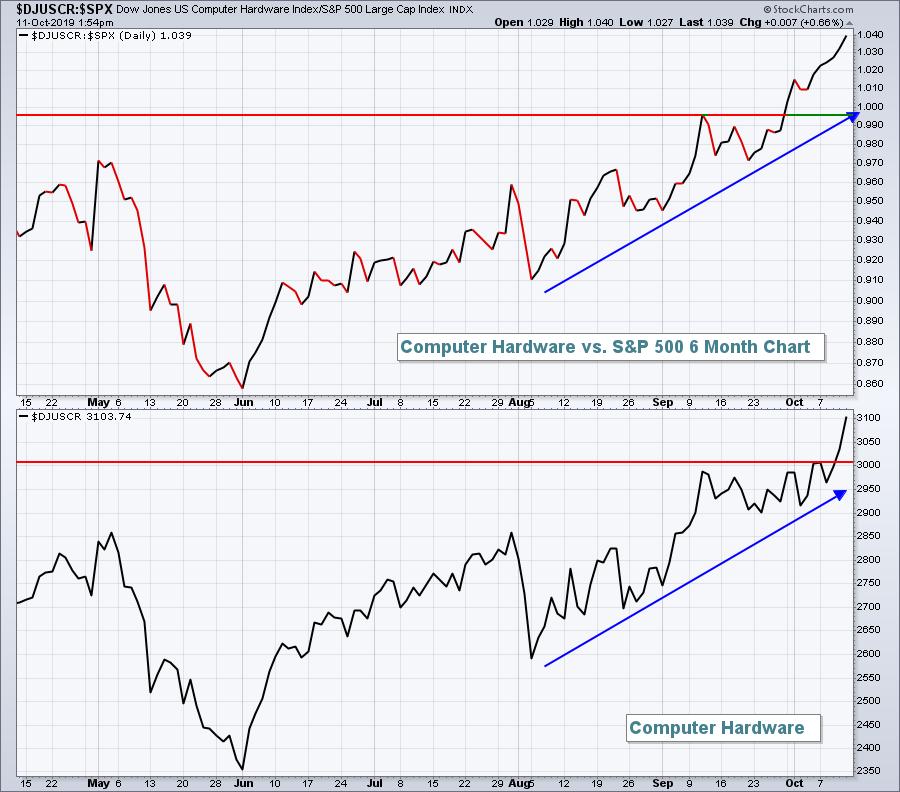
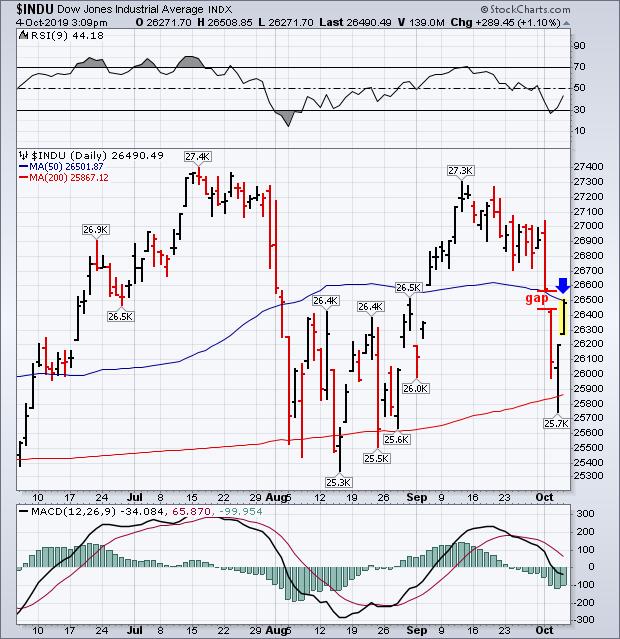
ChartWatchers October 04, 2019 at 08:31 PM
The markets have wobbled and wobbled, but they haven't fallen off the wall. When I look though my charts, I can't help but be amazed by the strength holding the market up... Read More
ChartWatchers October 04, 2019 at 07:52 PM
In just over a week, some of the largest banks will report their earnings including Citigroup, JP Morgan and Wells Fargo. When these financial behemoths report, I consider that the kickoff of Q3 earnings season... Read More
ChartWatchers October 04, 2019 at 06:09 PM
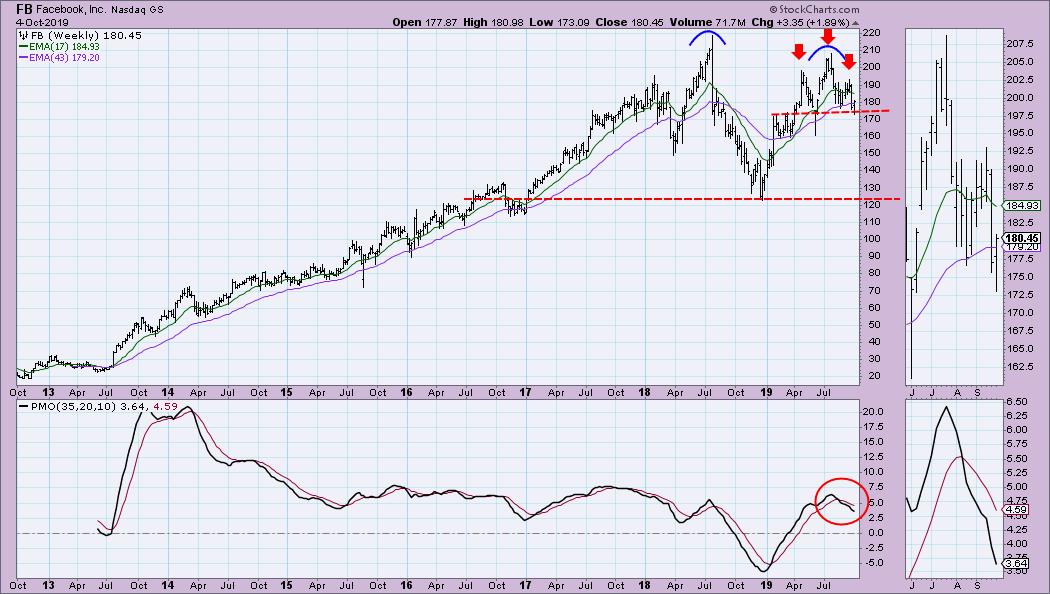
About two weeks ago, my dad, Carl, pointed out that the FAANG stocks were forming some "impressive" bearish topping formations. I took a look and I have to agree. Despite a blow-out rally today, we both believe there is still trouble ahead... Read More
ChartWatchers October 04, 2019 at 05:54 PM
Editor's Note: This article was originally published in John Murphy's Market Message on Friday, September 4th at 3:11pm ET. Stock prices are continuing the rebound that began with yesterday's upside reversal off their 200-day moving averages... Read More
ChartWatchers October 04, 2019 at 04:12 PM

Today we are going to show how 52-week highs and lows can be used to track long-term and short-term trends in the S&P 500. Full disclosure: this is not the holy grail. It is one indicator that can be used in conjunction with others to keep you on the right side of the trend... Read More