Art's Charts July 31, 2012 at 05:42 AM
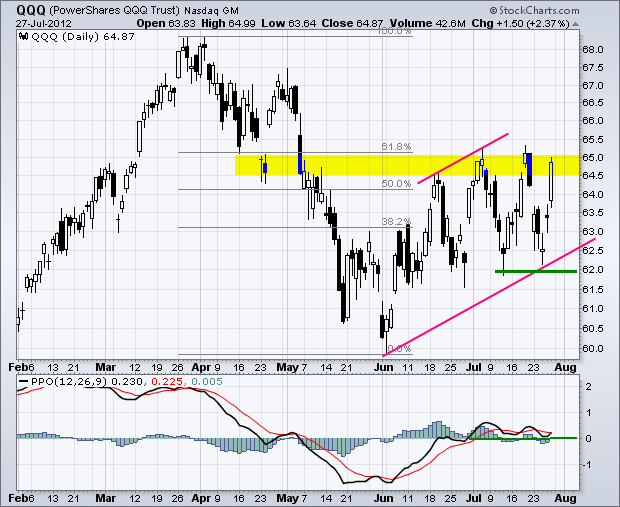
Stocks edged lower on Monday in listless trading. The Russell 2000 ETF (IWM) led the way down with a .64% loss, while the Nasdaq 100 ETF (QQQ) held most of its ground with a fractional .11% loss... Read More
Art's Charts July 31, 2012 at 05:34 AM
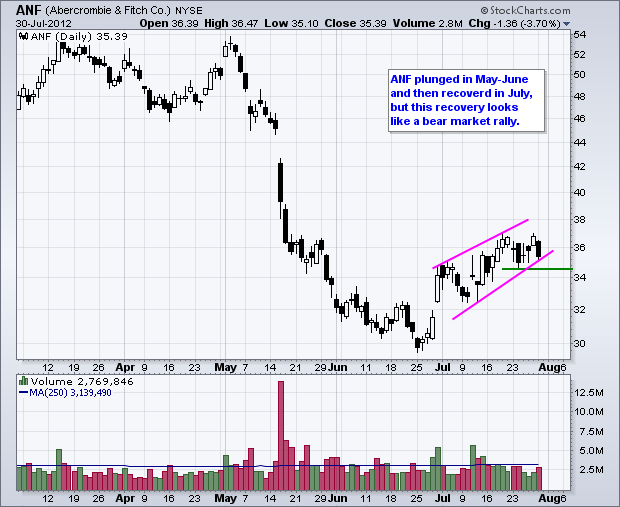
DHI Stalls above Resistance Break. KGC Breaks Wedge Resistance. MCHP Breaks Triangle Resistance. Plus ANF, CVS, DDR, UTX, XL This commentary and charts-of-interest are designed to stimulate thinking... Read More
Art's Charts July 30, 2012 at 06:44 AM
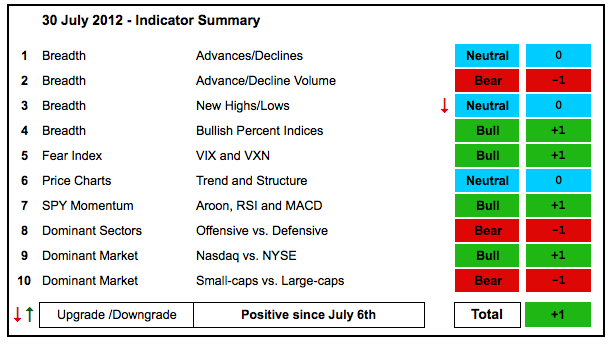
There was one downgrade, but the indicator summary remains net positive. Net New Highs were downgraded to neutral because Nasdaq Net New Highs are showing weakness as the cumulative line moved below its 10-day EMA... Read More
Art's Charts July 30, 2012 at 05:48 AM
Mario Draghi said the magic words and stocks answered with a powerful surge higher. The rally started on Thursday and extended on Friday. The Russell 2000 ETF (IWM) and Nasdaq 100 ETF (QQQ) led the charge with 2+ percent gains... Read More
Art's Charts July 27, 2012 at 02:50 AM
I am taking Friday off. Art's Charts will return on Monday with the Indicator Summary and normal commentary... Read More
Art's Charts July 26, 2012 at 05:50 AM
Stocks were mixed on Wednesday. The Nasdaq 100 ETF (QQQ) and S&P 100 ETF (OEF) moving lower, but the Russell 2000 ETF (IWM) and S&P MidCap 400 SPDR (MDY) edging higher... Read More
Art's Charts July 26, 2012 at 05:38 AM
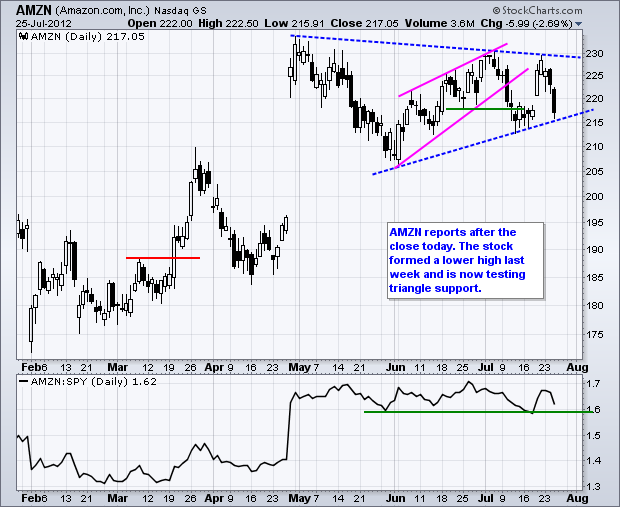
AMZN Tests Triangle ahead of Earnings. CTXS Gaps Down. JWN Hits Key Retracement. Plus BBBY, DRI, IDCC, NUE, SKUL This commentary and charts-of-interest are designed to stimulate thinking... Read More
Art's Charts July 25, 2012 at 04:39 AM
Stocks were under selling pressure again on Tuesday with the Russell 2000 ETF (IWM) and S&P MidCap 400 SPDR (MDY) leading the way lower. Small and mid-caps are less diversified than large-caps and they have less overseas exposure... Read More
Art's Charts July 24, 2012 at 04:46 AM
The major index ETFs were hit with strong selling pressure on the open, but managed to bounce after gapping down. Nevertheless, the major index ETFs finished with losses and the gaps held. Small-caps led the way lower as the Russell 2000 ETF (IWM) lost 1.60%... Read More
Art's Charts July 24, 2012 at 04:42 AM
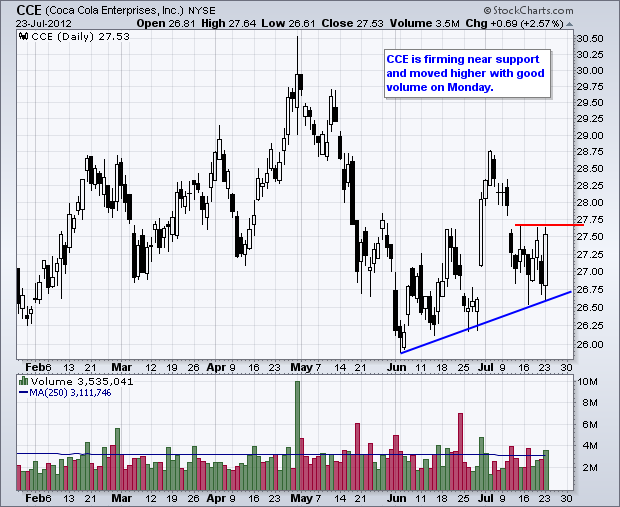
CCE Advances on Good Volume. FDX Reverses at Key Retracement. JPM Forms Falling Flag. Plus ECA, FCX, NVDA, WU This commentary and charts-of-interest are designed to stimulate thinking... Read More
Art's Charts July 23, 2012 at 05:21 AM
Stocks moved sharply lower on Friday with the Russell 2000 ETF (IWM) and the Nasdaq 100 ETF (QQQ) leading the major index ETFs down. Seven of the nine sectors were lower with the Finance SPDR (XLF) leading this group... Read More
Art's Charts July 20, 2012 at 06:58 AM
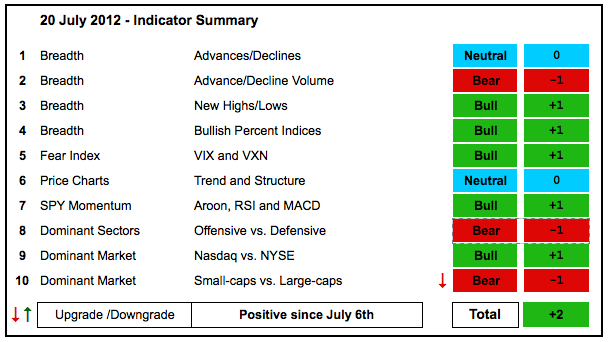
The indicator summary remains positive overall, but I downgraded the small-cap/large-cap indicator because small-caps are seriously underperforming the last two weeks... Read More
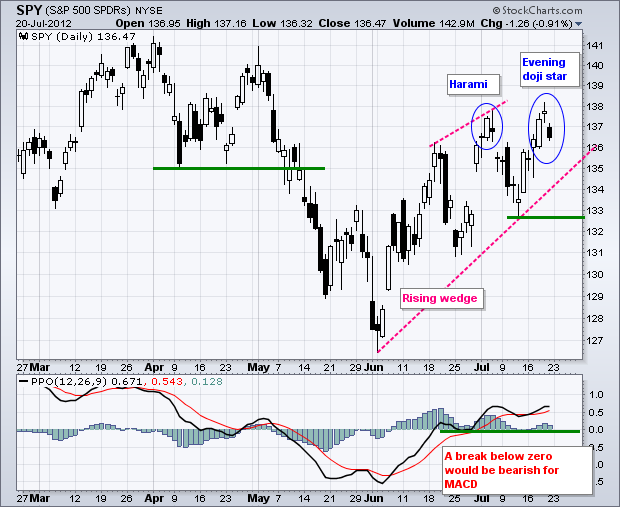
Art's Charts July 20, 2012 at 05:54 AM
Technology stocks led the market again on Thursday, but the finance sector weakened again and small-caps were also down on the day. Relative weakness in these two is not a good sign. At best, it points to a divided market that will trade sideways... Read More
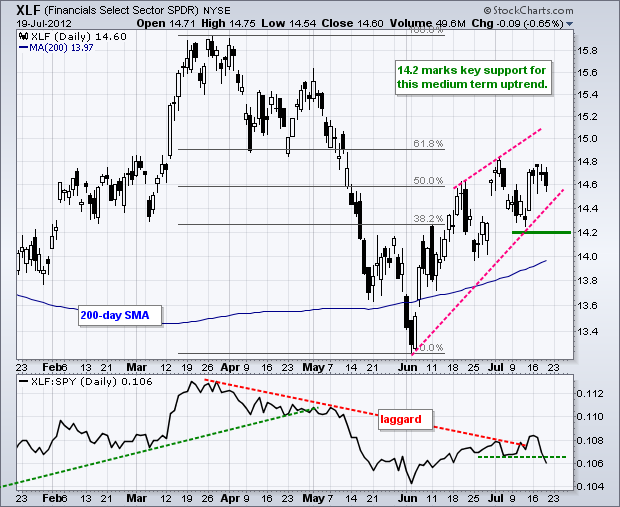
Art's Charts July 19, 2012 at 06:14 AM
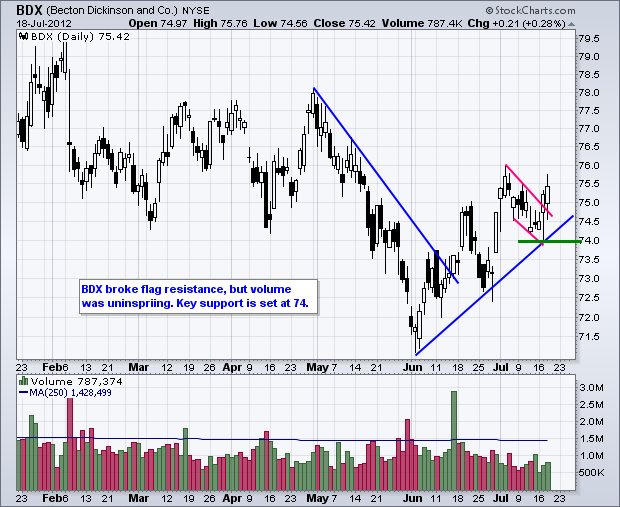
SWKS Bounces off Support with Good Volume. UNH Firms at Support Zone. Plus BDX, BX, CNX, MCD, MCO, MDT, ZION This commentary and charts-of-interest are designed to stimulate thinking... Read More
Art's Charts July 19, 2012 at 05:10 AM
The bulls simply refuse to buckle. Economic reports have been below expectations for months, earnings are less than stellar and the Fed stands ready to act. Perhaps the stock market is pricing in quantitative easing for August or September... Read More
Art's Charts July 18, 2012 at 05:23 AM
Stocks were edgy on Tuesday as Fed chairman Ben Bernanke testified before congress. After an initial pop on the open, the major index ETFs dipped lower for around 40 minutes and then surged back into positive territory in the early afternoon... Read More
Art's Charts July 17, 2012 at 06:28 AM
Selling pressure hit the stock market after a weak retail sales report, but the major index ETFs managed to firm and finish with small losses... Read More
Art's Charts July 17, 2012 at 06:02 AM
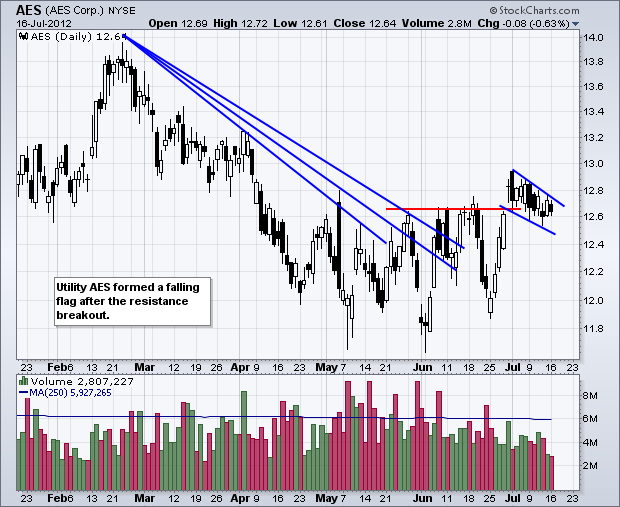
AES Extends Flag Consolidation. ATVI Surges and then Forms Bull Flag. COV Breaks Wedge Trend Line. Plus ARO, DNR, GS, IACI, INTU, MRO This commentary and charts-of-interest are designed to stimulate thinking... Read More
Art's Charts July 17, 2012 at 01:13 AM
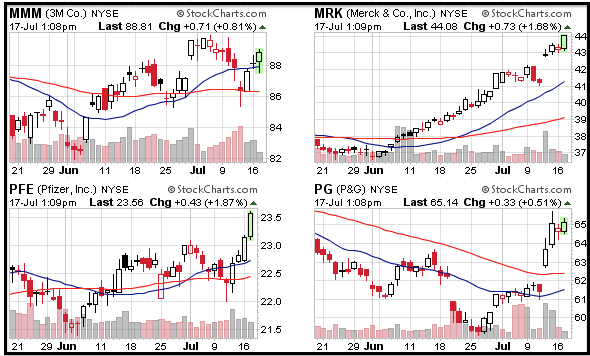
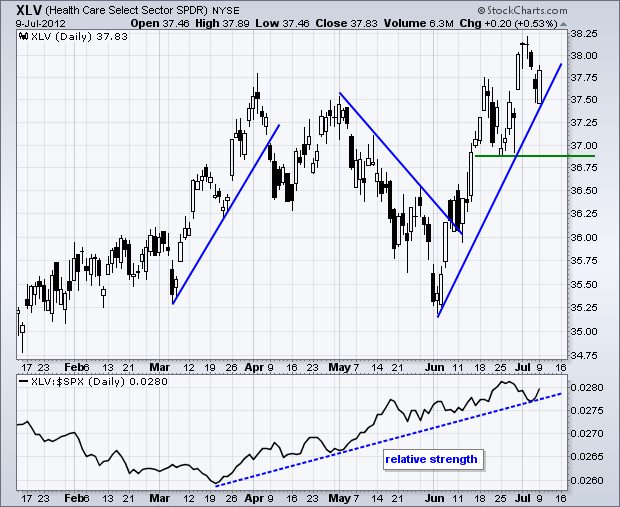
The chart below shows four of the thirty CandleGlance charts for the Dow Industrials. Notice that big pharma is leading the way as Pfizer (PFE) and Merck (MRK) surge to new highs. The Healthcare SPDR (XLV) is also hitting a new high today... Read More
Art's Charts July 16, 2012 at 06:40 AM
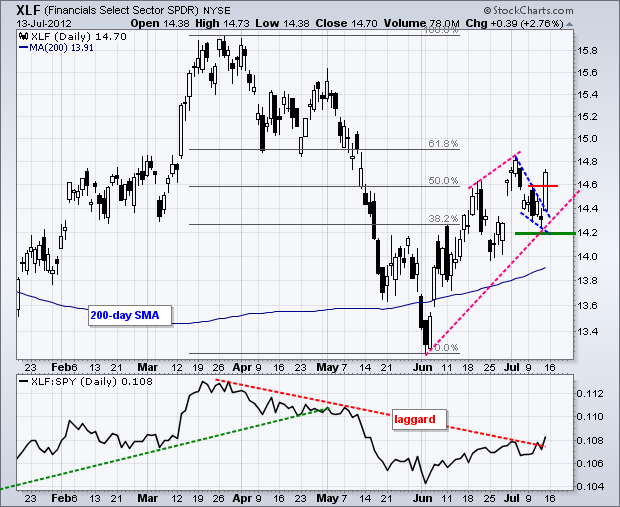
The risk-on trade took hold on Friday with stocks, oil and gold surging. All major index ETFs were up over 1%. Eight of the nine sector SPDRs were up over 1% with the Finance SPDR (XLF) leading the charge (+2.76%)... Read More
Art's Charts July 13, 2012 at 05:23 AM
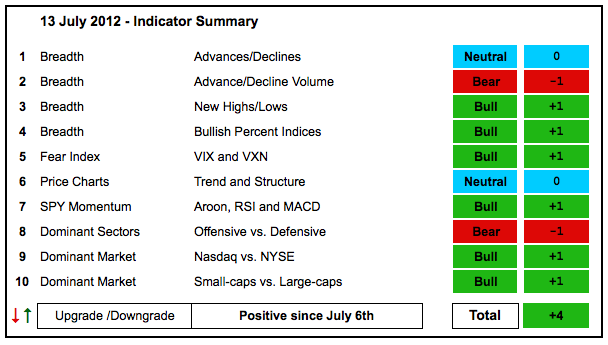
Despite a decline this week, the indicator summary remains unchanged and net positive. Even so, there are some glaring signs of weakness within the market. The AD Volume Lines failed at broken support and remain bearish overall... Read More
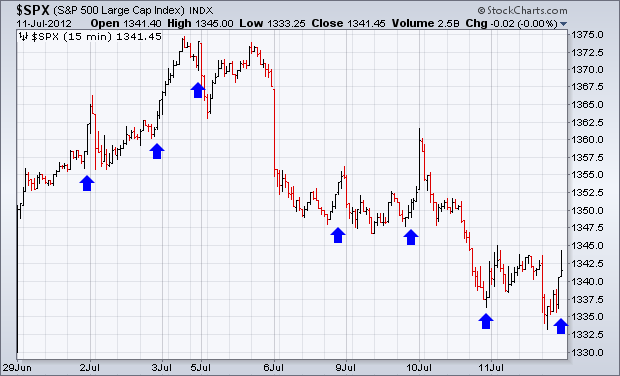
Art's Charts July 13, 2012 at 04:03 AM
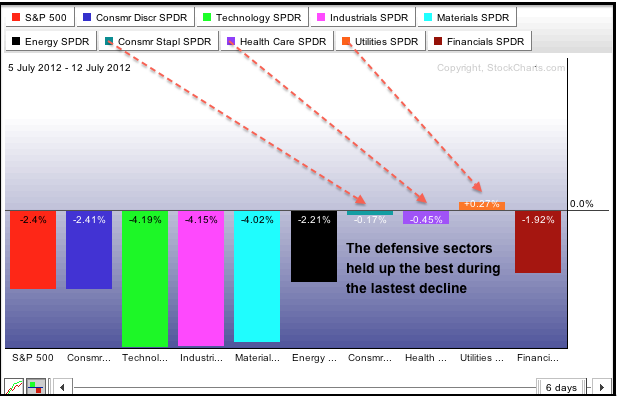
Stocks started the day with a sharp move lower, but quickly firmed and worked their way higher the rest of the day. The major index ETFs closed with relatively small losses. The sectors were mixed with five down and three up as money moved to relative safety... Read More
Art's Charts July 12, 2012 at 05:24 AM
Look out below! Asian stocks are getting hammered with the Nikkei down around 1.5% and the Hang Seng down around 2%. European stocks are down modestly... Read More
Art's Charts July 12, 2012 at 05:20 AM
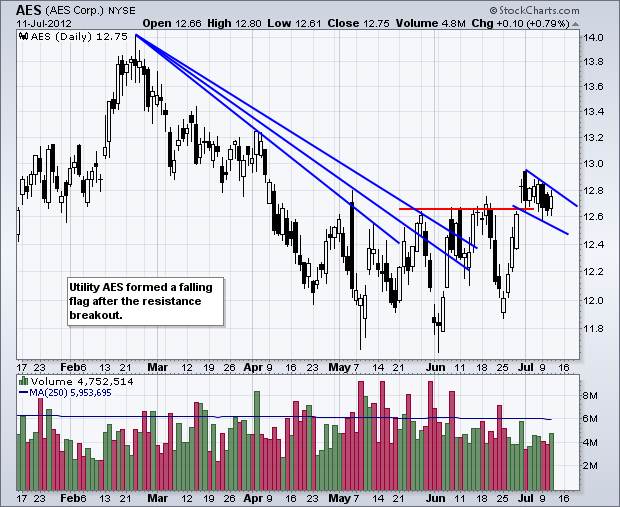
AES Forms Bull Flag after Breakout. AMZN Breaks Channel Support. HD Forms Small Wedge after Gap Down. Plus HBAN, ILMN, PBCT This commentary and charts-of-interest are designed to stimulate thinking... Read More
Art's Charts July 11, 2012 at 06:07 AM
Stocks started the day strong, but selling pressure soon took over and the major index ETFs closed lower. The S&P MidCap 400 SPDR (MDY) led the decline with a 1.12% loss, but the S&P 500 ETF (SPY) was not far behind with a .87% loss... Read More
Art's Charts July 10, 2012 at 07:11 AM
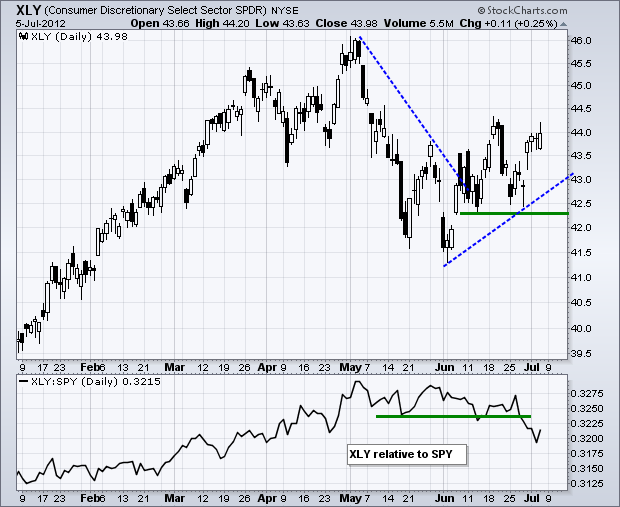
Stocks edged lower on Monday with the major index ETFs finishing slightly lower. Eight of the nine sectors were lower with the Energy SPDR (XLE) and Consumer Discretionary SPDR (XLY) leading the decline. Both were down around .5%... Read More
Art's Charts July 10, 2012 at 07:05 AM
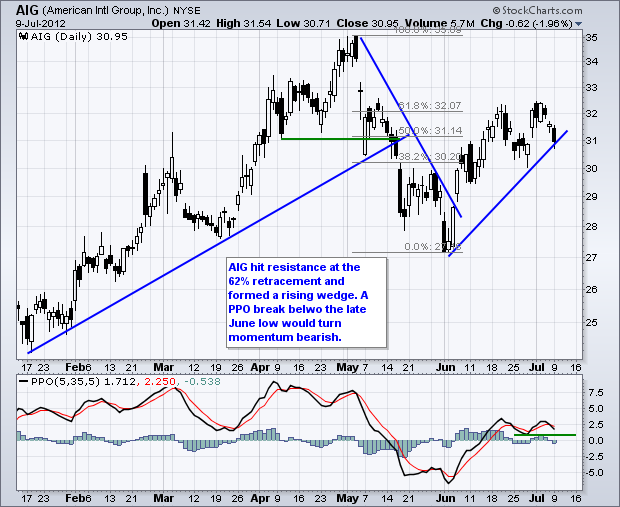
AIG Hits Resistance at Key Retracement. APD Forms Pennant Near Resistance. MYL Surges after ACA Ruling. Plus CAH, CRM, DDS, MAT, XRAY This commentary and charts-of-interest are designed to stimulate thinking... Read More
Art's Charts July 07, 2012 at 03:39 AM
I am taking a day off on Monday... Read More
Art's Charts July 06, 2012 at 06:45 AM
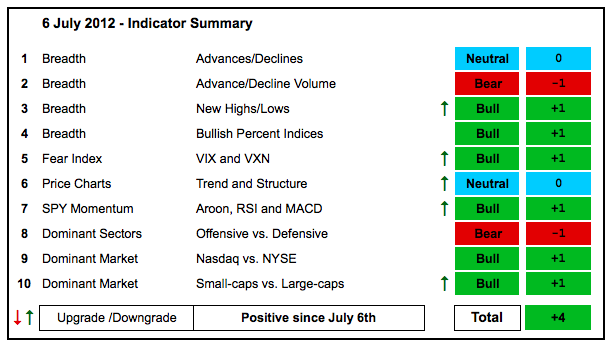
With a number of upgrades, the indicator summary turned positive this week. I am, however, concerned, that this positive switch could be short-lived because some key sectors are lagging and the AD Volume Lines have yet to turn bullish... Read More
Art's Charts July 06, 2012 at 05:00 AM
Central banks around the world continue to ease monetary policy and open the money spigots... Read More
Art's Charts July 05, 2012 at 06:35 AM
Stocks have been trending higher since early June and the major index ETFs extended these trends on Monday-Tuesday. Uptrends suggest that the path of least resistance is up, but an economic avalanche over the next two days could make-or-break said trends... Read More
Art's Charts July 05, 2012 at 06:24 AM
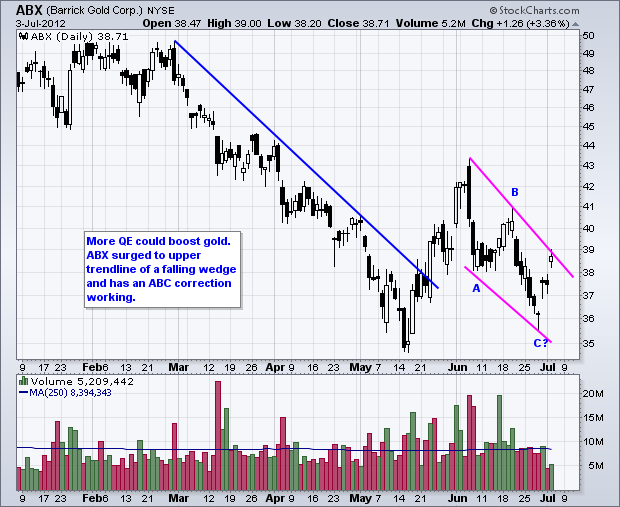
Charts of Interest: ABX, AFFX, AMCC, CDE, FIO, FLEX, GFI, TEVA, WEN This commentary and charts-of-interest are designed to stimulate thinking. This analysis is not a recommendation to buy, sell, hold or sell short any security (stock ETF or otherwise)... Read More
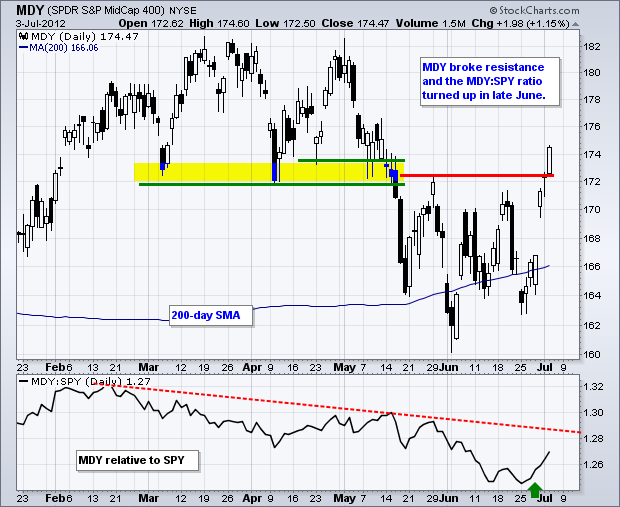
Art's Charts July 03, 2012 at 05:41 AM
The economic news was mixed on Monday. May construction spending hit its highest level in over 2 years. A decrease in public sector construction spending was offset by an increase in private sector spending. The ISM Manufacturing Index slipped below 50 (49... Read More
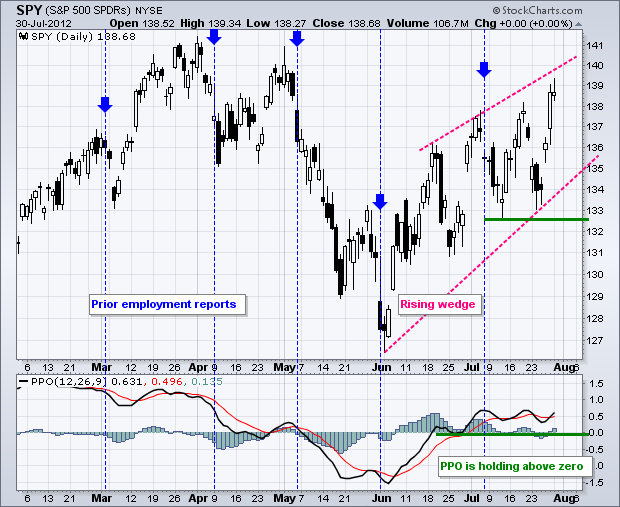
Art's Charts July 02, 2012 at 06:36 AM
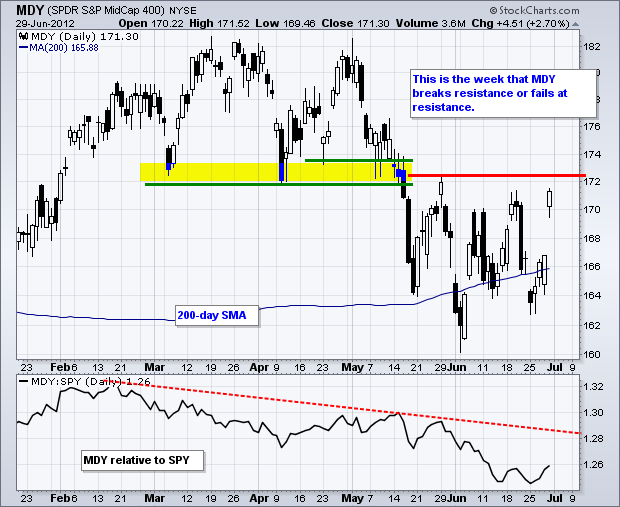
This broken week could be pivotal for the markets. The week is short with a July 4th break on Wednesday. Despite the shortened week, there are several key economic reports and the big employment report is Friday... Read More