Art's Charts May 30, 2017 at 07:09 AM
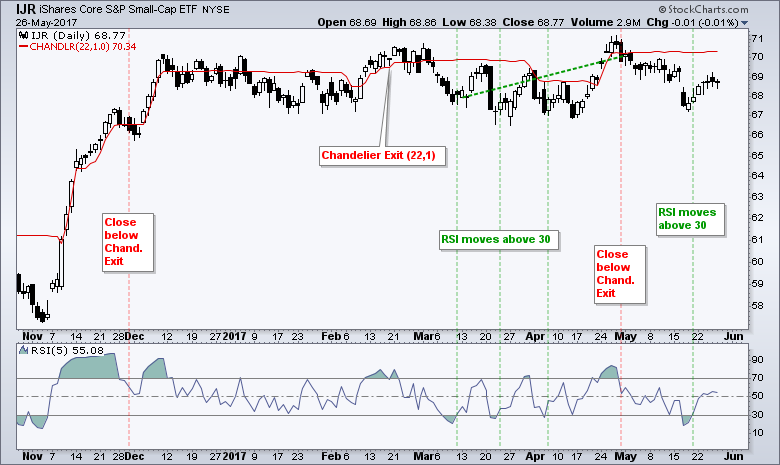
.... IJR Mean-Reversion Trade in Play .... Marking Upswing Support for MDY .... Chinese Stocks Spring to Life .... Asian Index ETFs Show Broad Strength .... Finding Stocks within an Industry Group .... Aluminum Stocks Look Poised for Upturn ...... Read More
Art's Charts May 26, 2017 at 09:37 AM

.... Stocks Bounce without Biotechs .... Breadth Remains Bullish, but Weakening .... Nasdaq Stocks Support S&P 500 .... QQQ Hits Yet Another New High .... Small-caps Not Feeling the Love .... Sector Balance Clearly Bullish .... %Above 200-day Ranking for Sectors ...... Read More
Art's Charts May 25, 2017 at 10:41 AM

.... Do stops really help? .... Setting the Benchmark .... System Ground Rules .... Consulting, Software and Data .... Testing Some Basic EMA Crossovers .... Base System and Sample Charts .... Trailing Stops, Profit Targets and Both .... Backtest Results ...... Read More
Art's Charts May 23, 2017 at 07:33 AM
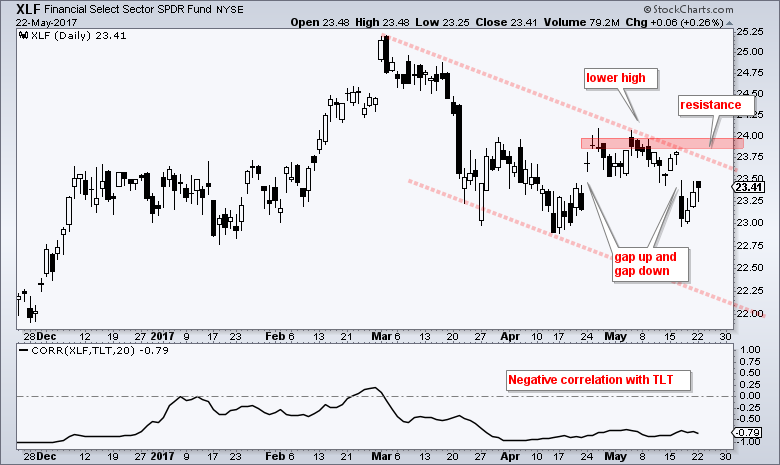
.... XLF Lags as TLT Surges .... A Classic Corrective Sequence for KRE .... TLT Holds Breakout and Nears 200-day .... T-bond Correlations in Play .... Large-caps Continue to Lead New High List .... Utilities and Staples Lead Sector New High List ...... Read More
Art's Charts May 20, 2017 at 05:36 AM
The stock market has been in correction mode since early March when looking at the EW S&P 500 ETF (RSP) and S&P MidCap SPDR (MDY). Together, these two ETFs represent 900 stocks and cover the majority of the market, and they have been flat since March 1st... Read More
Art's Charts May 19, 2017 at 11:19 AM
.... The Stealthy Looking Correction .... AD Volume Lines Reflect Corrective Period .... High-Low Lines Have Yet to Turn Down .... Percent Above 200-day EMA Deteriorates Further .... SPY Gaps Down like its September 2016 .... Setting a Correction Zone for QQQ ...... Read More
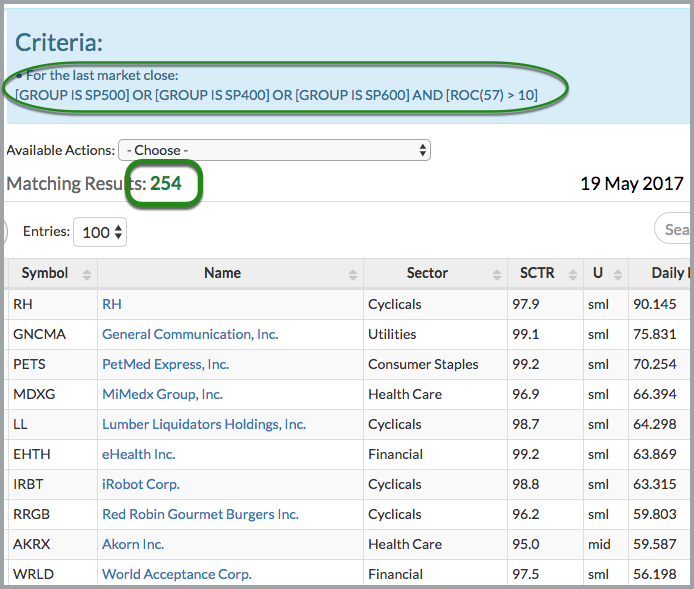
Art's Charts May 18, 2017 at 08:52 AM
.... Passive versus Too Active .... Using the Inspect Feature on SharpCharts .... The Good, the Bad and the Neutral .... Scan Code to Measure Performance .... Building a Correction ChartList .... S&P 500 Breadth, Momentum and Correction Target ...... Read More
Art's Charts May 16, 2017 at 07:21 AM
.... Will Bonds or Small-caps Turn Up First? (IJR, MDY, TLT, IEF) .... Citigroup is Leading the Big Banks (XLF, JPM, BAC, MS, GS) .... A Big ETF Provider and Two Brokers (BLK, SCHW, ETFC) .... Three Railroads with Long-term Uptrends (UNP, NSC, KSU) ...... Read More
Art's Charts May 13, 2017 at 04:42 AM
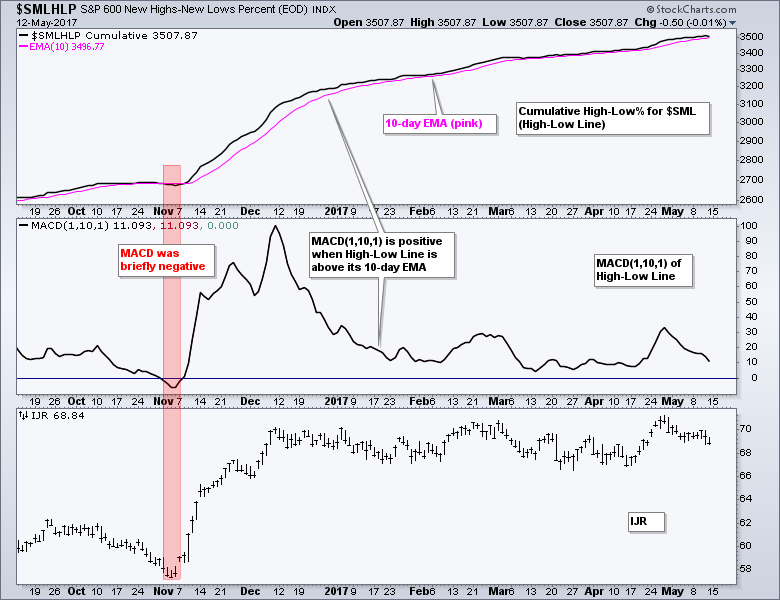
Small-Cap High-Low Line is Still Rising The bulk of the evidence remains bullish for stocks, but small-caps and mid-caps continue to drag their feet. The chart below shows the cumulative High-Low Line for S&P SmallCap High-Low Percent ($SMLHLP) with the 10-day EMA (pink)... Read More
Art's Charts May 12, 2017 at 09:40 AM
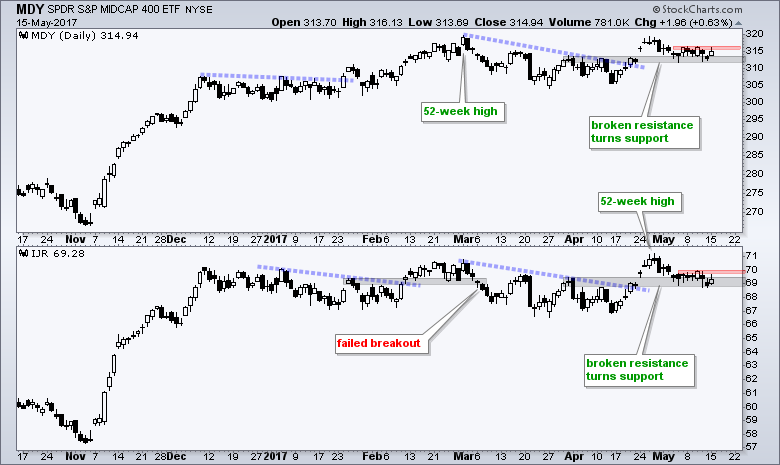
Weekly Market Review & Outlook .... On a Road to Nowhere ($VIX and $SPX) .... High-Low Lines Continue to Rise .... Deterioration in %Above 200-day Indicators .... SPY Holds the Breakout and the Gaps .... IJR and MDY Tests their Breakout Zones ...... Read More
Art's Charts May 11, 2017 at 08:34 AM
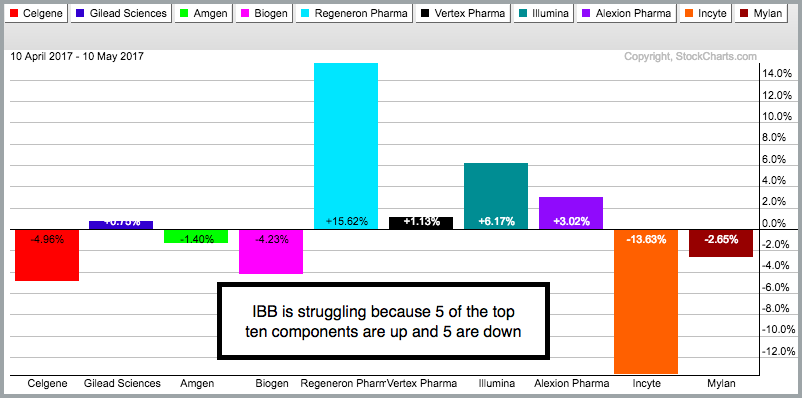
.... Split Performance Hinders Biotech ETF .... Amgen Lagging Biotechs and Market .... HealthCare SPDR Holds Breakout .... Pfizer Slows to a Crawl .... Delivery and Trucking Weigh on Dow Transports .... Use Sector Summary to Drill Down .... Refiner Stocks Catch a Bid ...... Read More
Art's Charts May 09, 2017 at 08:54 AM
.... IJR and MDY Tests their Breakouts .... Stocks and Junk Outperforming Treasuries .... Watch BAC, C, GS and JPM for Big Banks .... Watch USB, FITB, HBAN and ZION for Regionals .... Aroons Signal Consolidaiton for Arconic .... A Small Correction for Natty? ...... Read More
Art's Charts May 06, 2017 at 05:48 AM
----- Video Link ----- Art's Charts ChartList (updated 6-May) ----- Stocks were mixed this past week as the S&P 500 SPDR (SPY) and Nasdaq 100 ETF (QQQ) moved higher, while the Russell 2000 iShares (IWM) and S&P SmallCap iShares (IJR) edged lower... Read More
Art's Charts May 05, 2017 at 09:41 AM
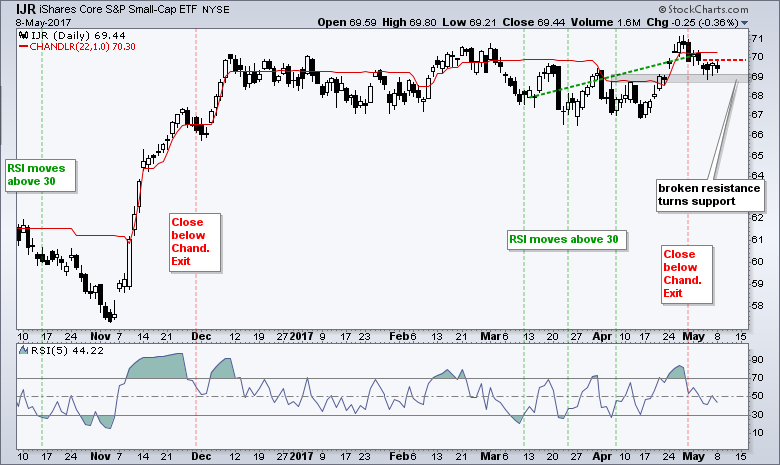
... Weight of the Evidence for Stocks .... New Lows are Ticking Up in Large-caps and Mid-caps .... %Above 200-day Holds Strong for SPX and NDX .... Stocks and Bonds Rise Together .... Flags Take Shape in IEF and TLT .... S&P 500 SPDR Holds Breakout .... IJR Tests its Breakout ..... Read More
Art's Charts May 04, 2017 at 09:11 AM

.... Sell in June to Avoid a Swoon .... Testing the Best Six Months Strategy .... A Twenty Year Testing Period .... Best versus Worst Six Months .... Four Months Stand out on Seasonality Chart .... Testing the Strongest Eight Months .... Seasonality Plus Timing Improves Returns ... Read More
Art's Charts May 02, 2017 at 07:43 AM
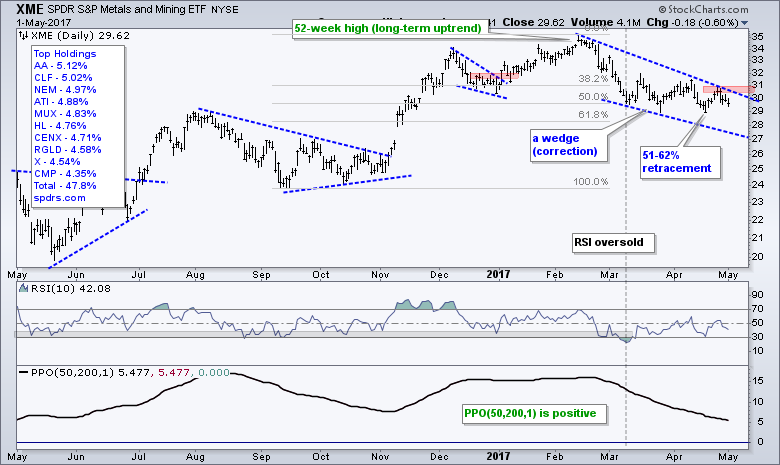
.... XME - A Mere Correction or More? (plus COPX) .... Steel Stocks Dominate XME .... HACK and IGN Perk Up within Technology .... Vanguard Finance ETF Stalls after Gap .... Respect for Bank Analyst Dick Bové (plus GS) .... Think you Really Know what Drives a Stock?...... Read More