Art's Charts March 31, 2015 at 04:33 AM
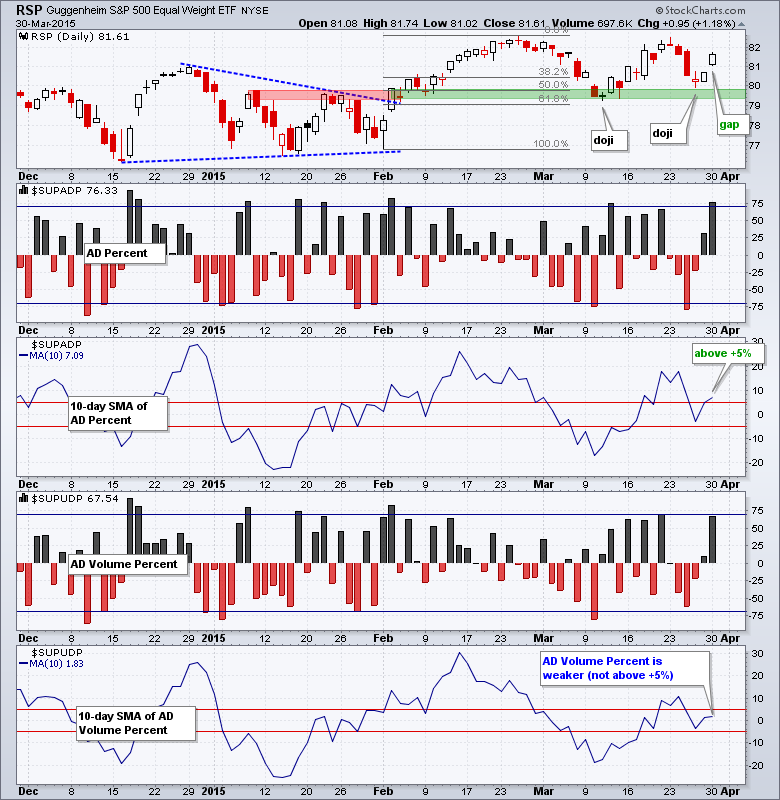
Stocks surged with a broad-based rally that lifted most boats. The major index ETFs were up over 1% with the Dow Diamonds (+1.46%) leading. All sector SPDRs were up over 1% with the Energy SPDR (+2.15%) leading... Read More
Art's Charts March 30, 2015 at 06:38 AM
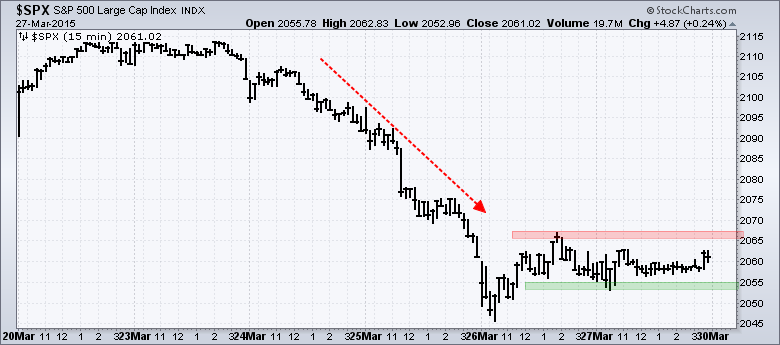
Stocks got slammed on Tuesday-Wednesday and firmed on Thursday-Friday. The S&P 500 fell from the 2110 area to the 2050 area and then moved into a rather tight trading range in the 2060 area. The resolution of this trading range could provide the next short-term signal... Read More
Art's Charts March 27, 2015 at 12:36 AM
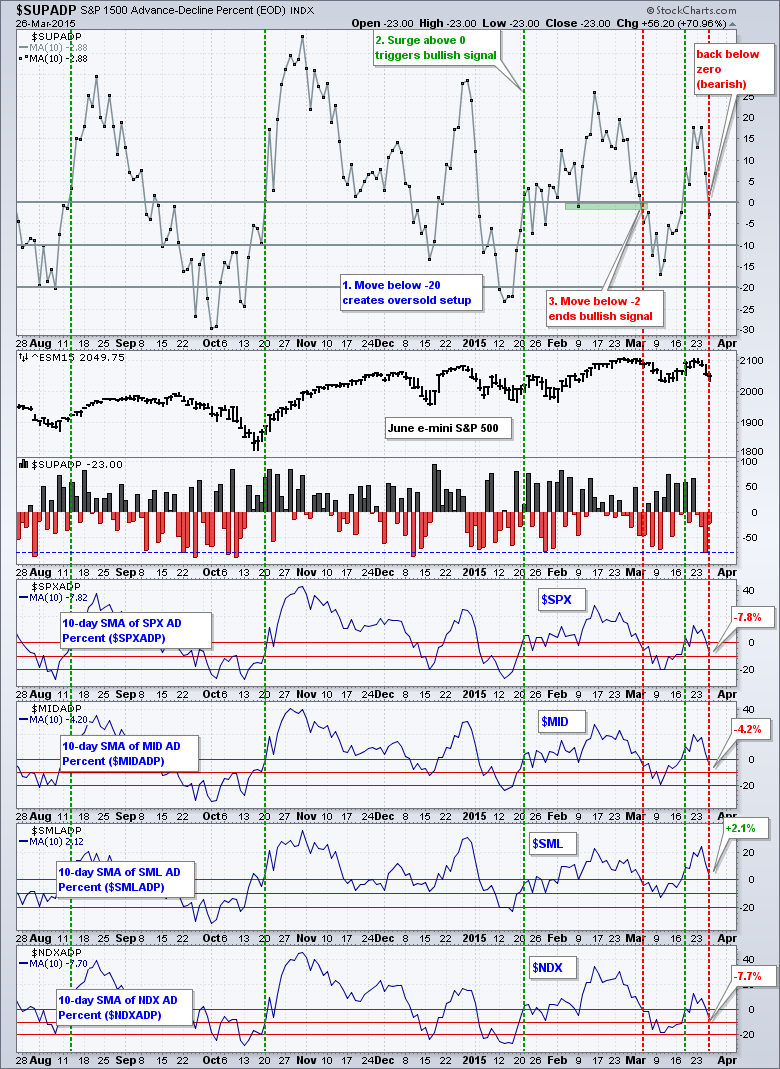
I am on the road Thursday-Friday so this update will be brief. All the charts have been updated. For what it is worth, I am attending the MTA symposium in New York. The bulk of the short-term evidence turned bearish with Wednesday's decline and remains bearish... Read More
Art's Charts March 26, 2015 at 12:09 AM
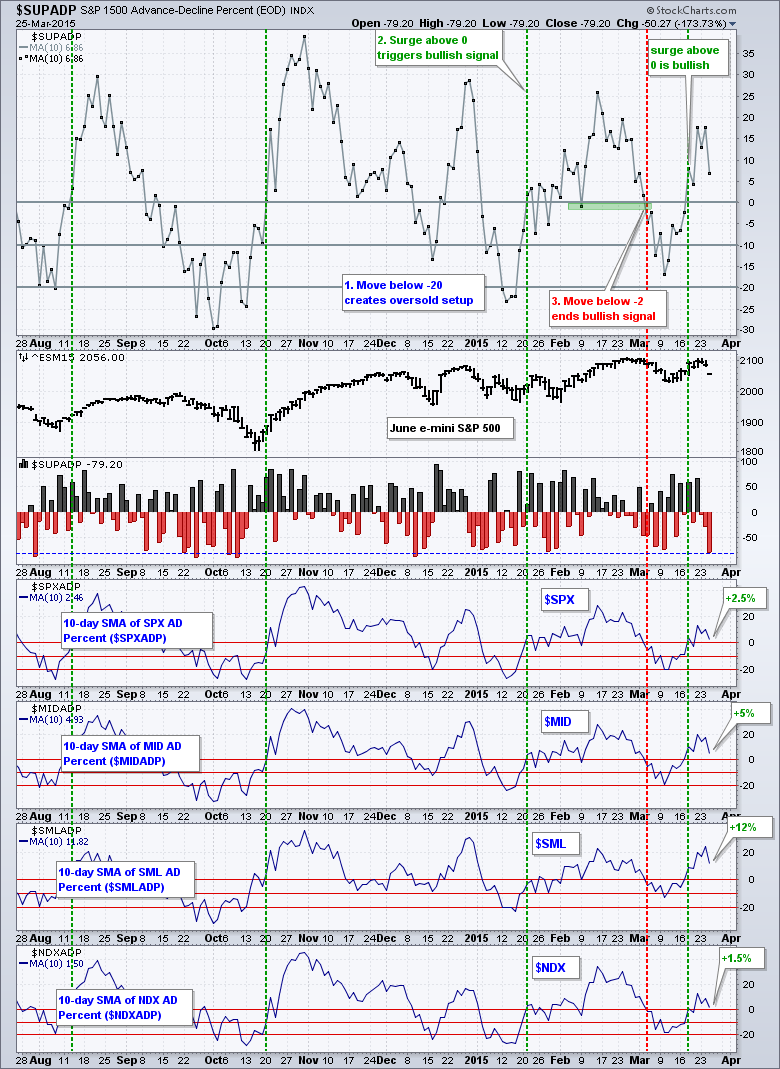
Stocks were hit with broad selling pressure and fell sharply on Wednesday. QQQ and IWM led the way lower with 2+ percent declines. Eight of the nine sectors were down with techs leading the way. Energy stocks bucked the selling pressure as crude bounced... Read More
Art's Charts March 25, 2015 at 12:02 AM
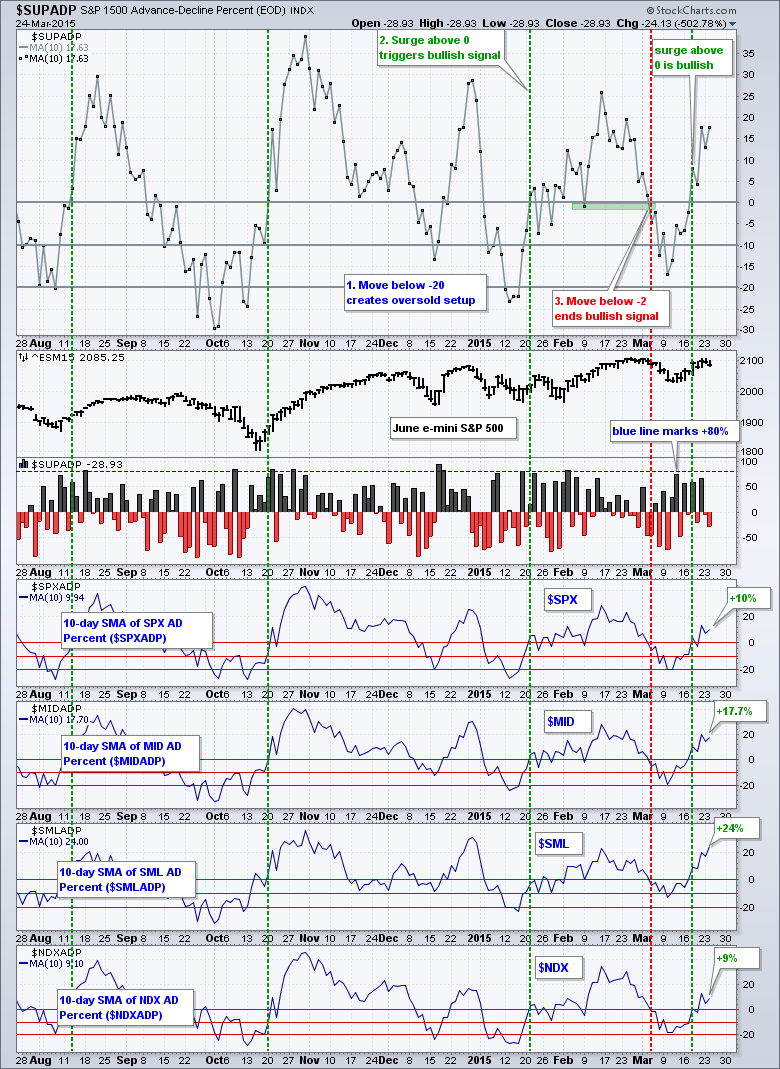
Trading was mixed again on Tuesday. Selling pressure hit SPY, QQQ and MDY, but IJR and IWM finished slightly positive. The finance and utilities sectors led the way lower... Read More
Art's Charts March 24, 2015 at 12:48 AM
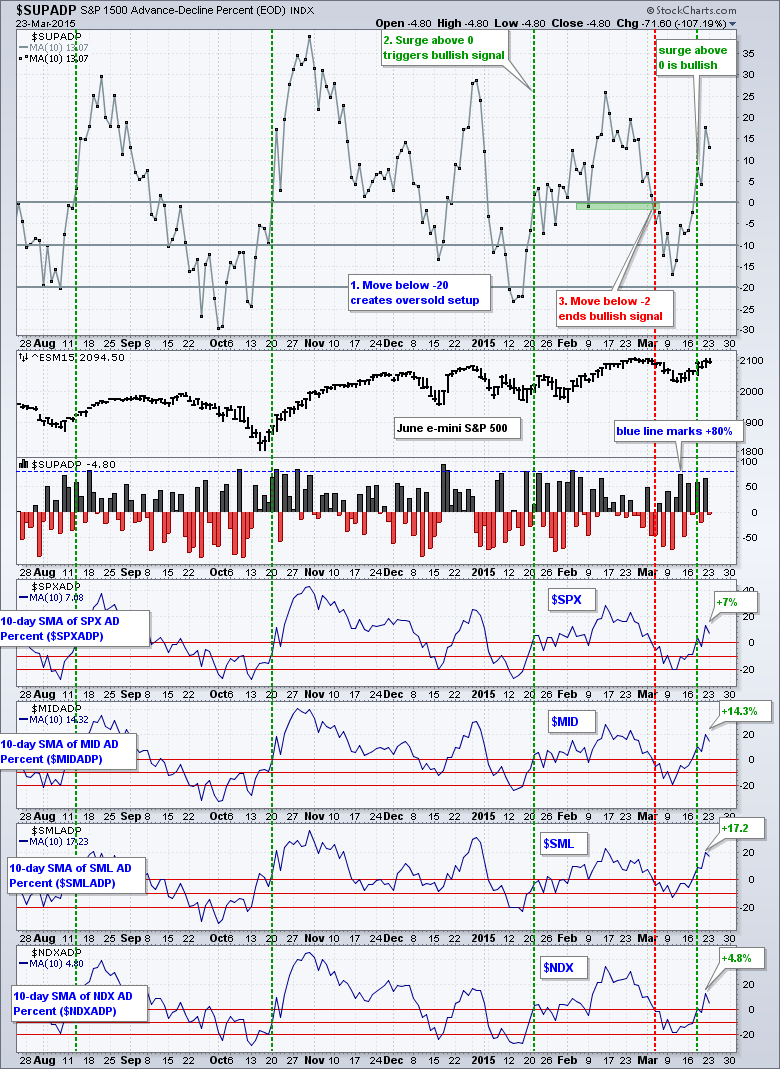
Stocks traded flat most of the day on Monday and then got hit with some selling pressure in the final ten minutes and the major index ETFs closed slightly lower... Read More
Art's Charts March 22, 2015 at 09:17 PM
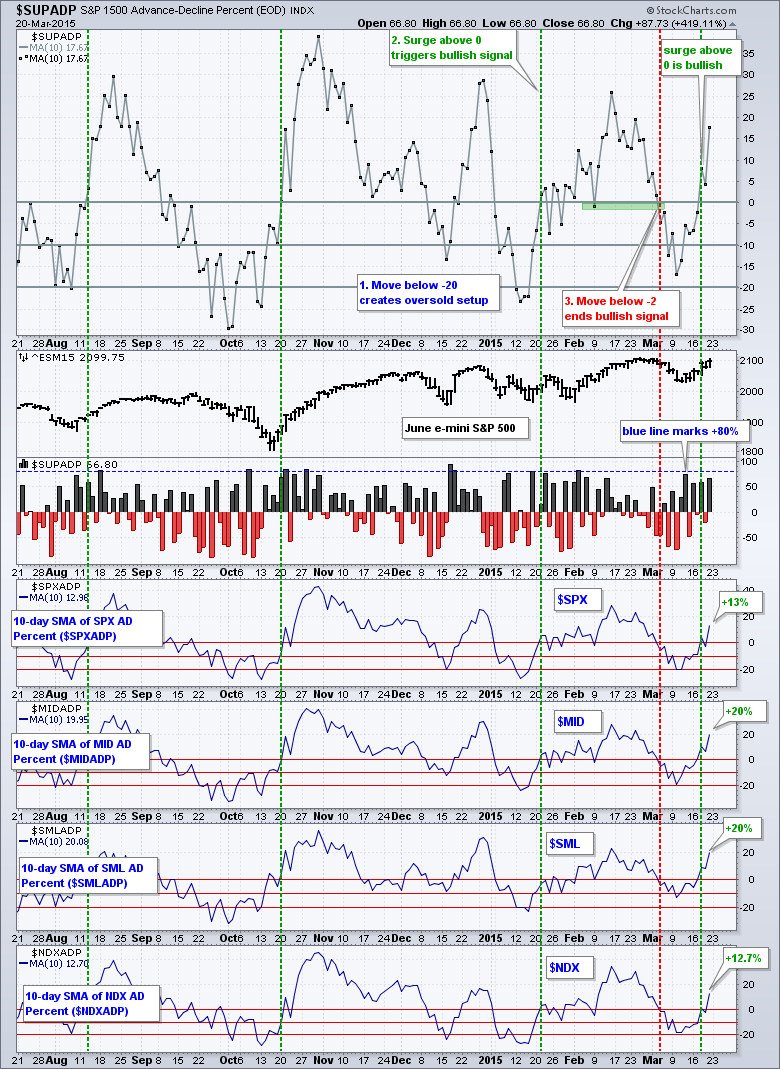
Stocks finished the week strong with QQQ, MDY and IWM leading the way. Large-caps also finished strong as the Dollar fell. Eight of the nine sectors finished higher. The Materials SPDR (XLB) was the only sector to finish lower on the week and show relative weakness... Read More
Art's Charts March 20, 2015 at 04:46 AM
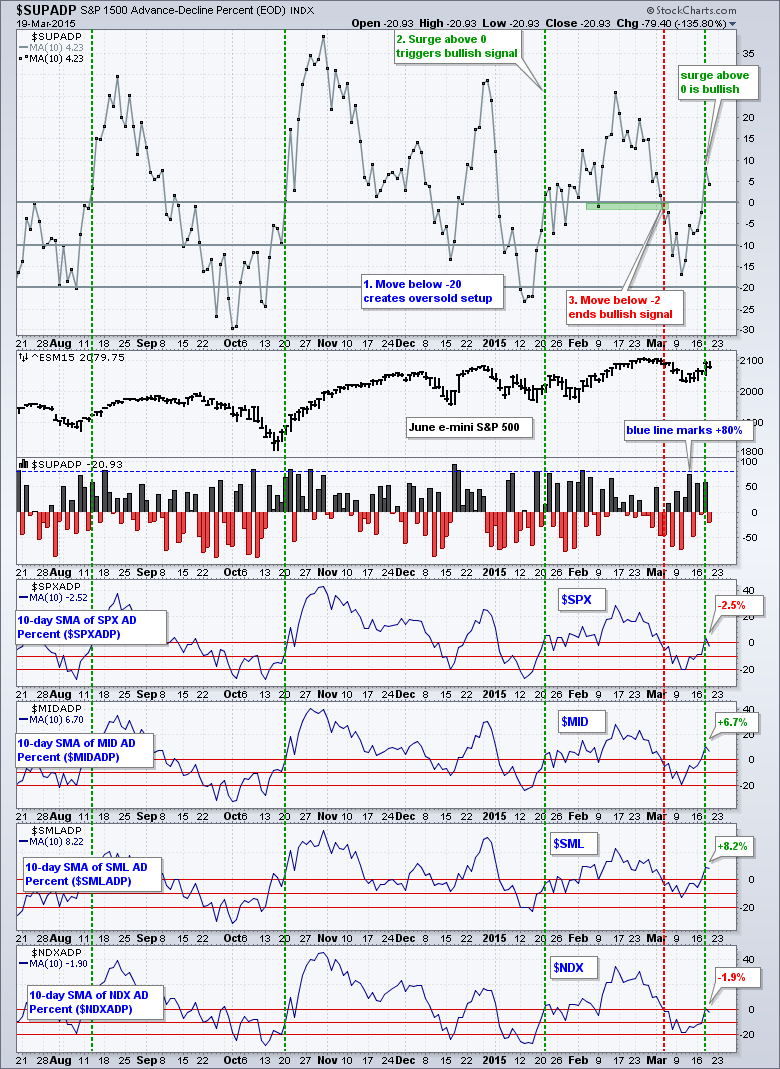
Stocks were mixed on Thursday. QQQ and IWM closed fractionally higher, but SPY and DIA edged lower. Finance weighed on the market as the Finance SPDR (XLF) lost .93%. The Materials SPDR (XLB) and Energy SPDR (XLE) were also weak with declines greater than 1.5%... Read More
Art's Charts March 19, 2015 at 06:00 AM
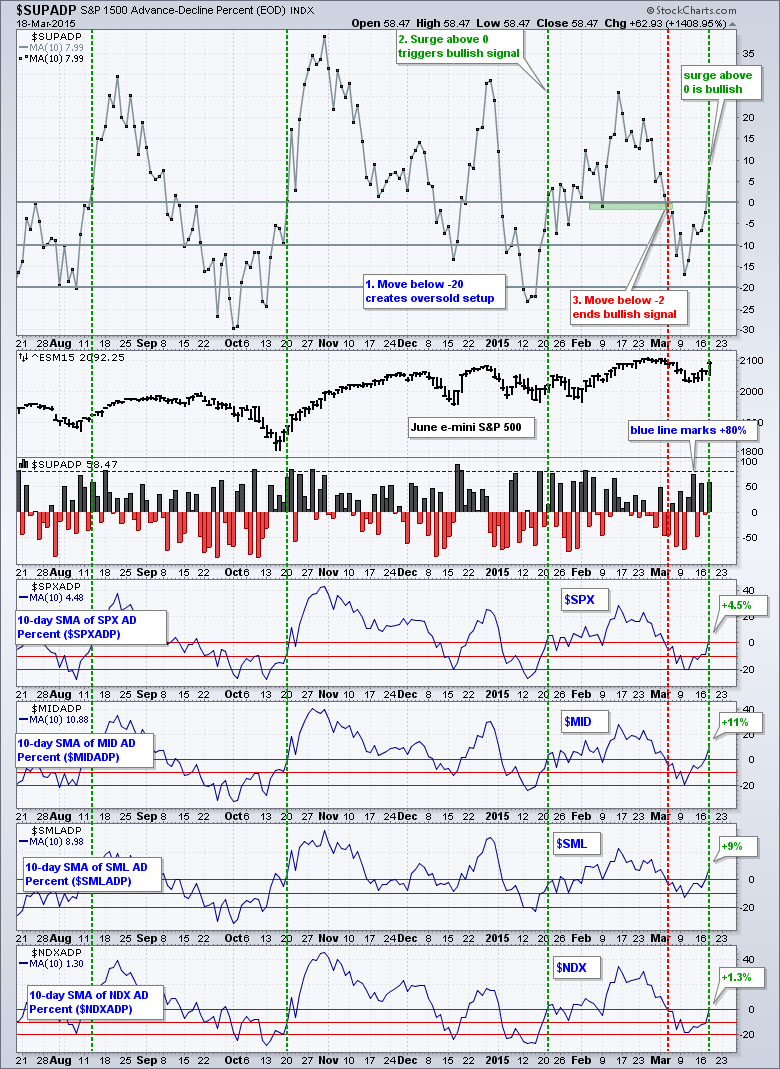
Is it volatile enough for ya? The S&P 500 fell to the 2062 area in the early afternoon (down around 14 points) and then shot higher with a move above 2105. The move from low to high was around 45 points and the index closed up 1.22% (25.22 points)... Read More
Art's Charts March 18, 2015 at 06:53 AM
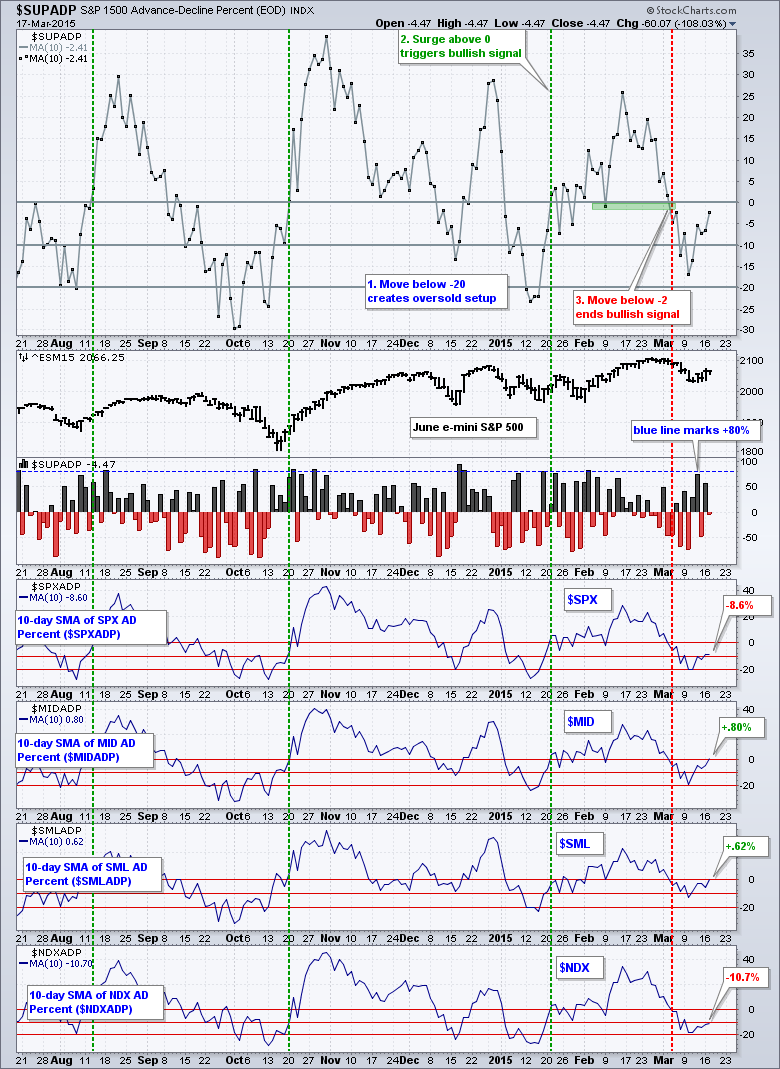
Stocks were mixed on Tuesday with large-caps closing lower and small-caps edging higher. Eight of the nine sector SPDRs were down with materials falling 1.11%. Energy shares were also weak... Read More
Art's Charts March 17, 2015 at 05:11 AM
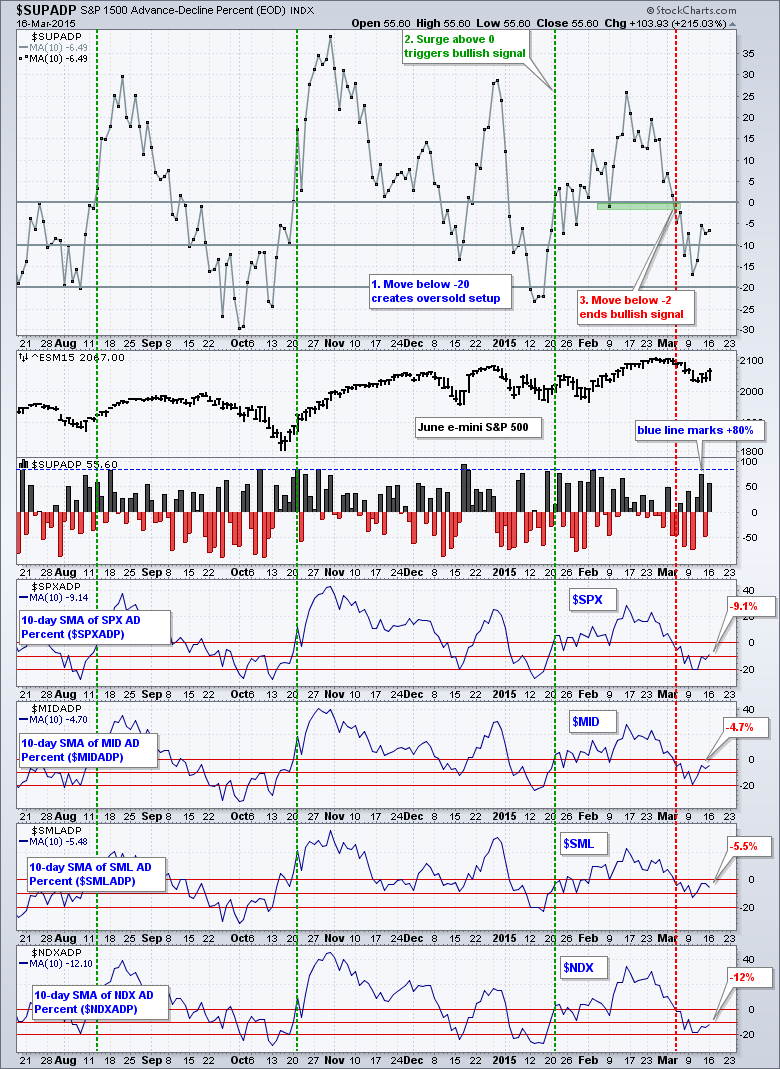
Stocks got their mojo back as the S&P 500 opened strong, stayed strong and finished at the high of the day. The large-cap indices led the move with 1+ percent gains. Small-caps lagged as IWM gained only .59%. Seven of the nine sectors were strong... Read More
Art's Charts March 16, 2015 at 07:22 AM
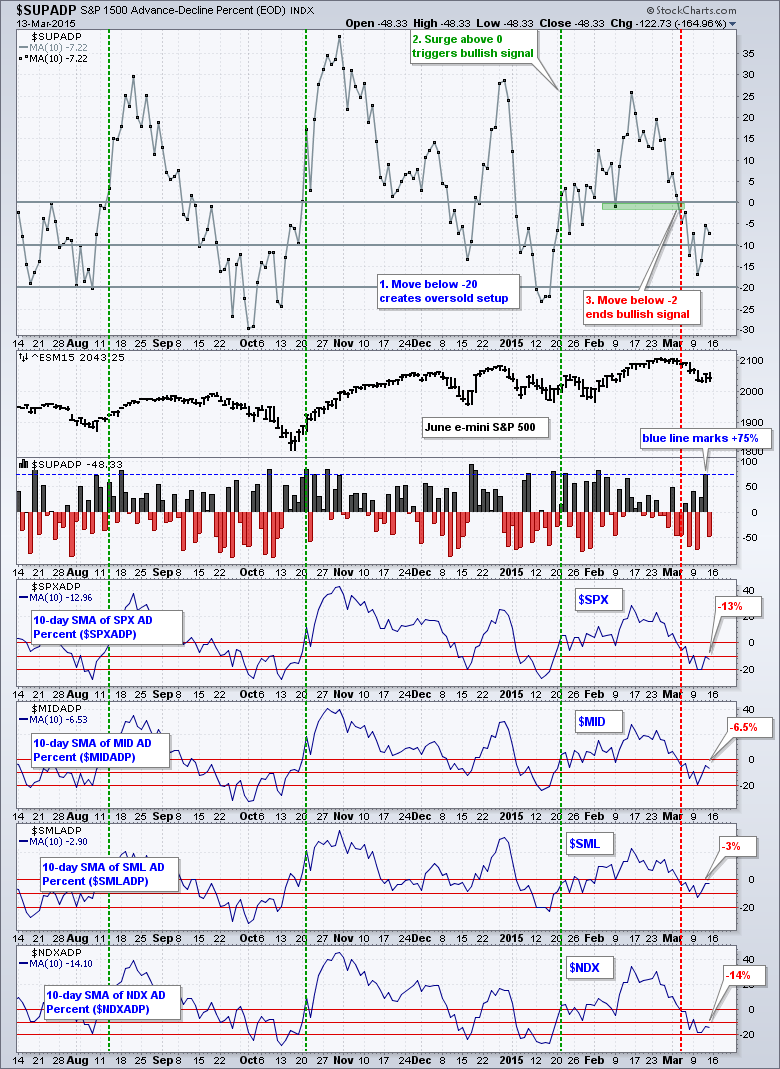
It was a very mixed week for stocks as QQQ lost around 2% and IWM gained 1.19%. Small-caps continue to lead in relative strength this year. A strong Dollar is helping the small-cap cause and hurting big multinationals... Read More
Art's Charts March 13, 2015 at 05:02 AM
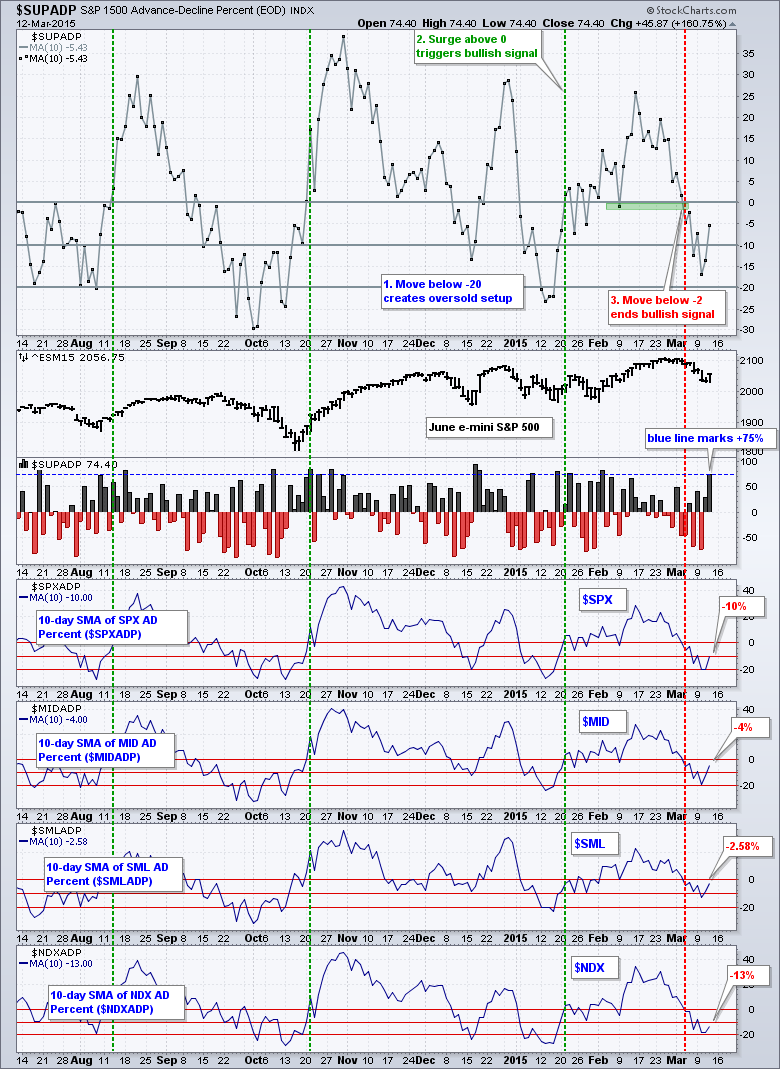
Stocks turned it around on Thursday with a strong open and strong close. The S&P 500 surged above 2055 on the open, held this surge and worked its way above 2065 by the close... Read More
Art's Charts March 12, 2015 at 05:47 AM
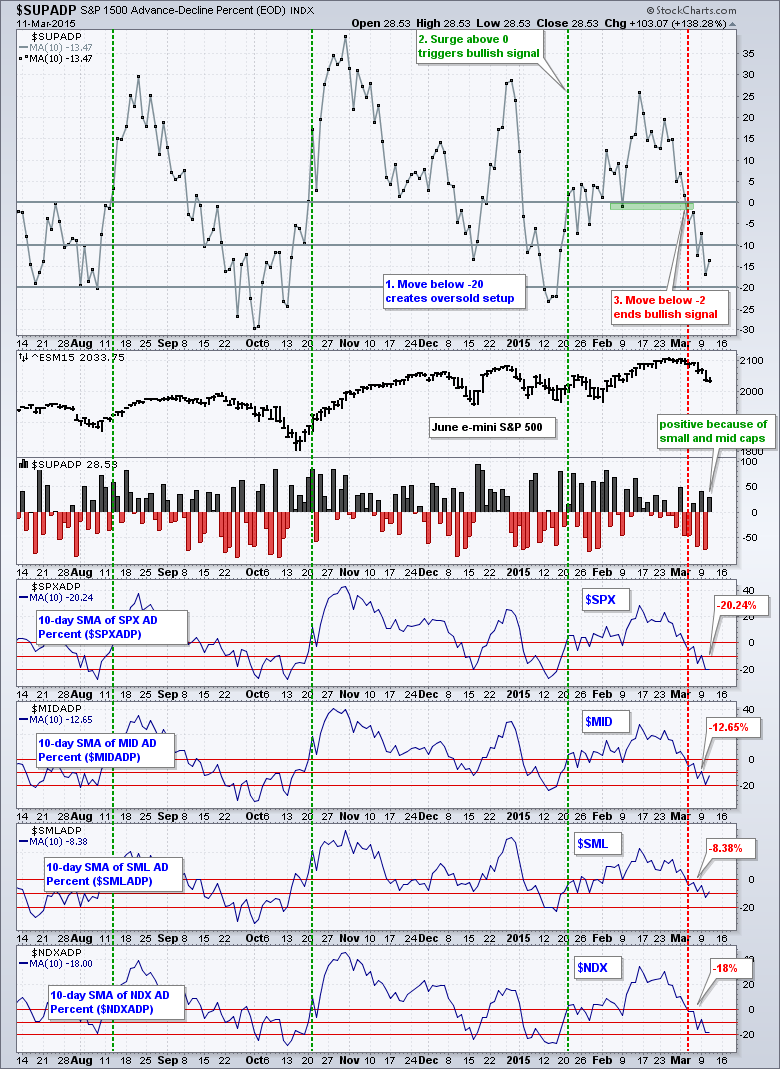
Trading was very mixed on Wall Street. Large-caps were under selling pressure as the Dollar surged to new highs yet again. SPY lost .23% on the day and the US Dollar ETF (UUP) surged 1.11%... Read More
Art's Charts March 11, 2015 at 05:16 AM
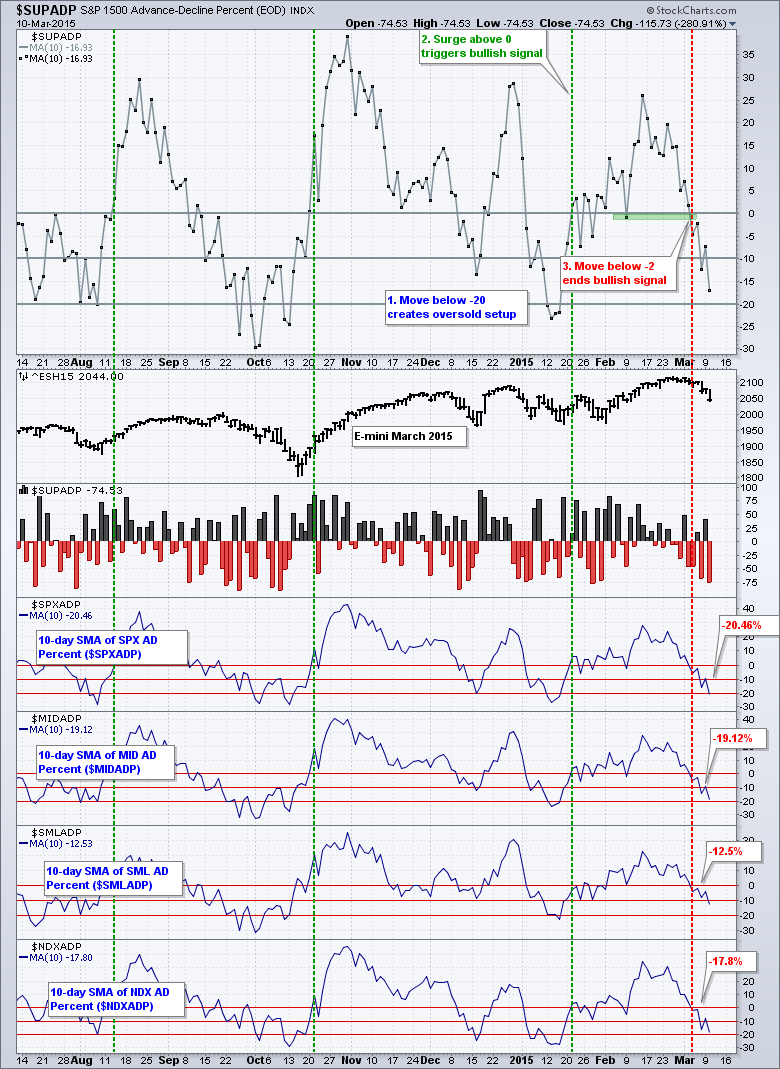
Stocks were pummeled again on Tuesday with large-caps leading the way. Large-caps have more overseas exposure and are more affected by a strong Dollar. Small-caps held up better, but were not immune to selling pressure... Read More
Art's Charts March 10, 2015 at 05:12 AM
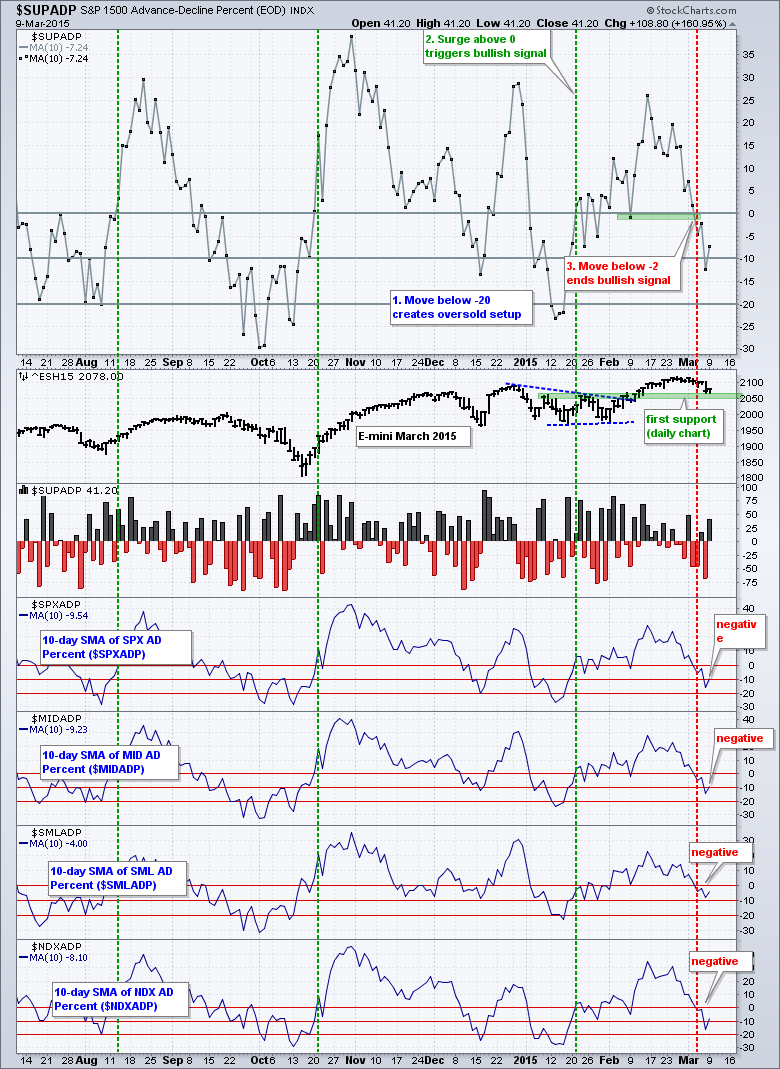
After a pummeling on Friday, stocks got an oversold bounce on Monday. But the bounce was not that impressive. QQQ gained .29%, SPY was up .41% and IWM gained .44%. Industrials led the sectors higher and energy lagged. Miners were hit hard as the Gold Miners ETF (GDX) plunged 3... Read More
Art's Charts March 09, 2015 at 06:36 AM
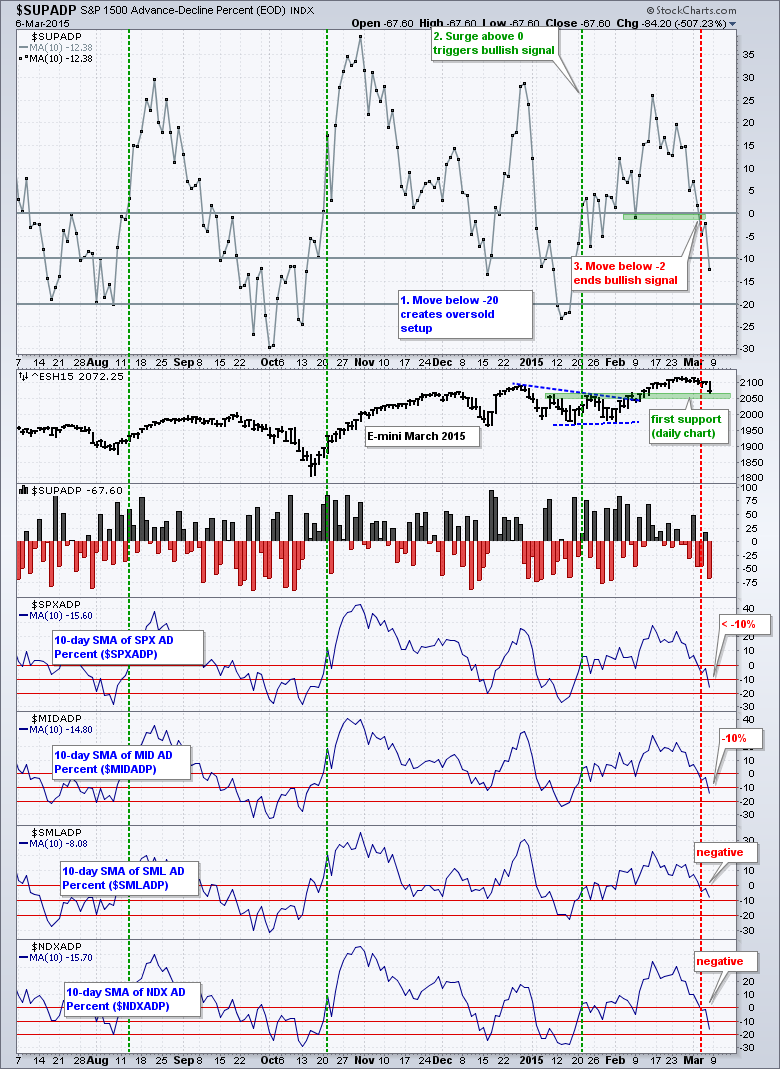
Selling pressure hit both stocks and bonds last week, but bonds more so than stocks. The S&P 500 fell around 1.5% for the week, which is not a drastic decline by any means. The 20+ YR T-Bond ETF (TLT) fell 4.5% last week and is down around 10% the last five weeks... Read More
Art's Charts March 06, 2015 at 04:19 AM
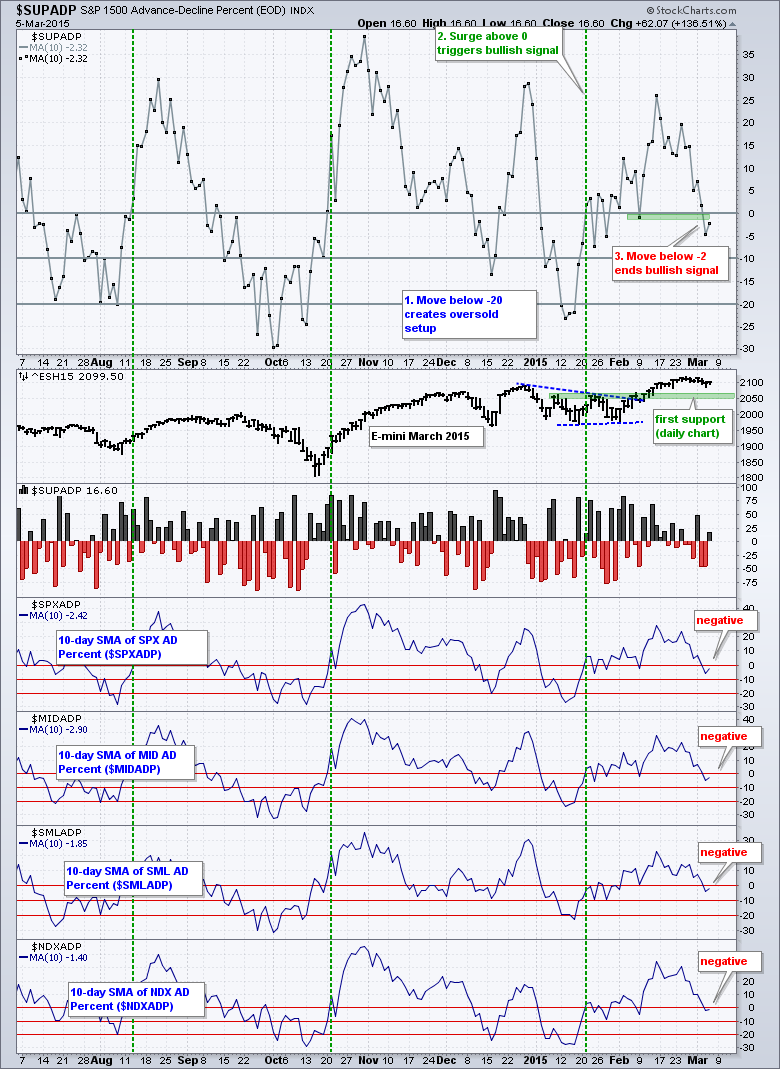
Stocks meandered as traders treaded water ahead of today's employment report. The S&P 500 popped on the open, dropped around lunchtime and recovered in the afternoon. SPY closed with a fractional gain - and a yawn... Read More
Art's Charts March 05, 2015 at 04:01 AM
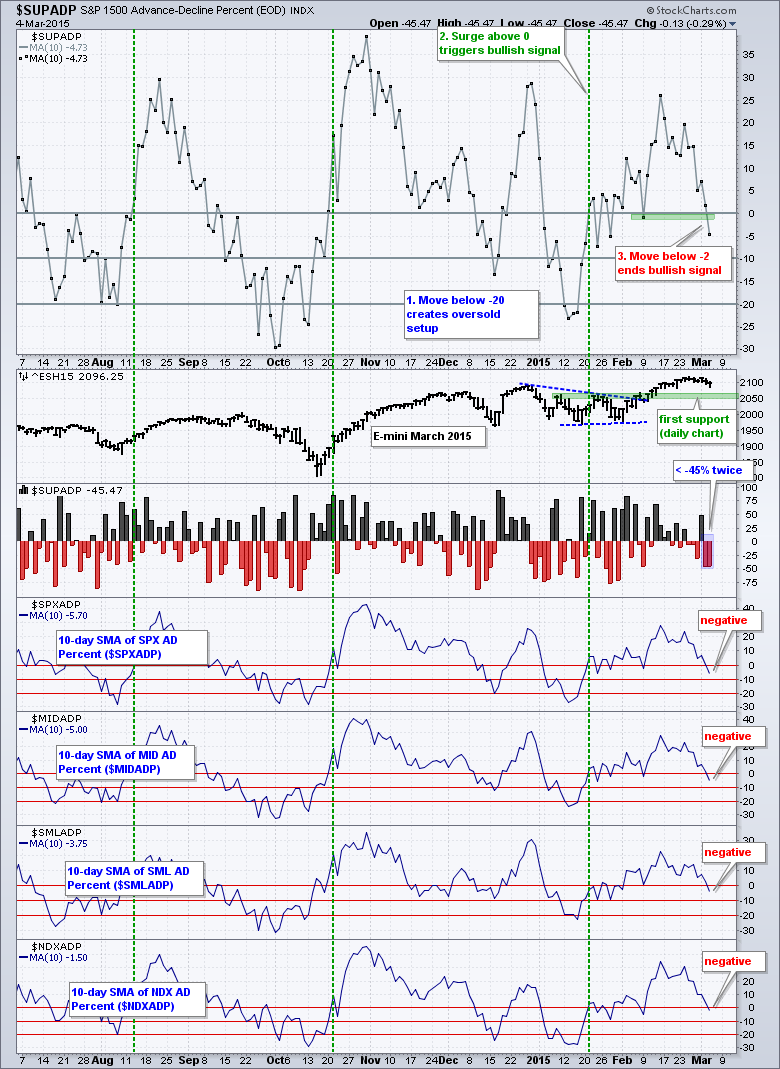
The S&P 500 did a repeat of Tuesday as the index opened weak with a plunge below 2090, quickly firmed and then recovered half the plunge with a bounce to the 2099 area. Selling pressure was pretty much across the board, but the declines were modest... Read More
Art's Charts March 04, 2015 at 04:14 AM
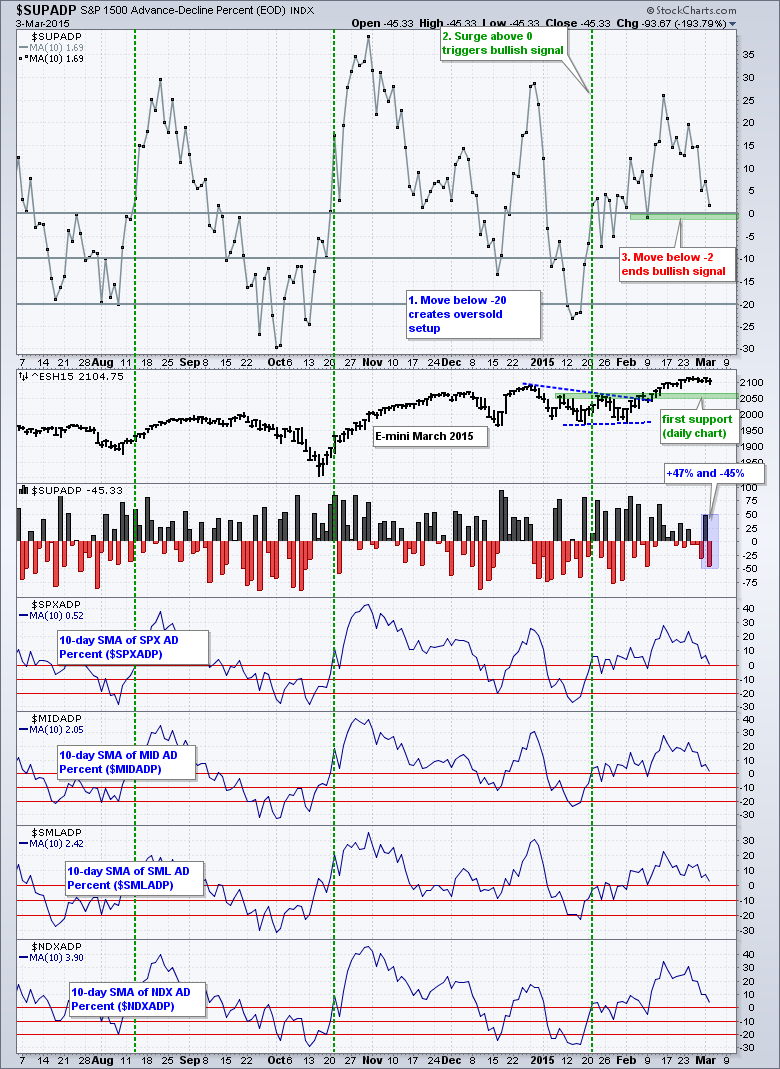
Stocks were hit hard on the open as the S&P 500 fell below 2100 for the first time since February 20th. The index rebounded in the afternoon, but only recovered half of its morning loss... Read More
Art's Charts March 03, 2015 at 04:20 AM
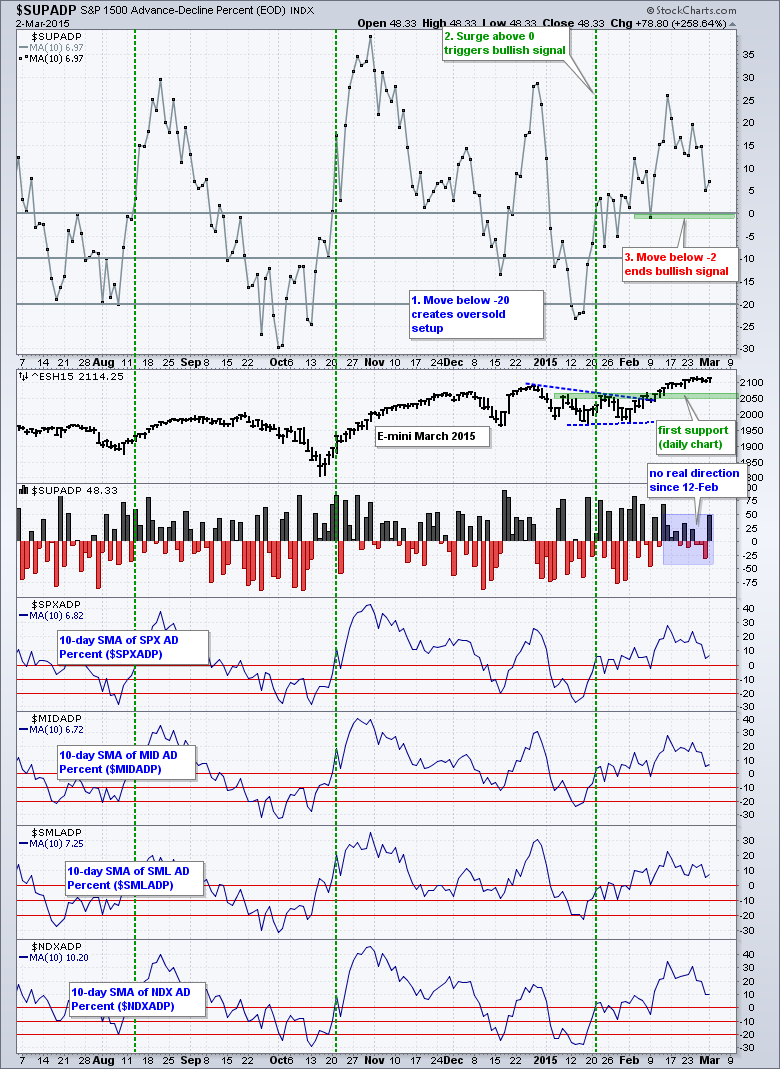
Stocks got right back to their bullish ways with the S&P 500 surging above 2117. The index started with a pop above 2113, dipped below 2100 and finished with a late surge to close near the high of the day. The major index ETFs finished higher with modest gains. QQQ led with a ... Read More
Art's Charts March 02, 2015 at 07:06 AM
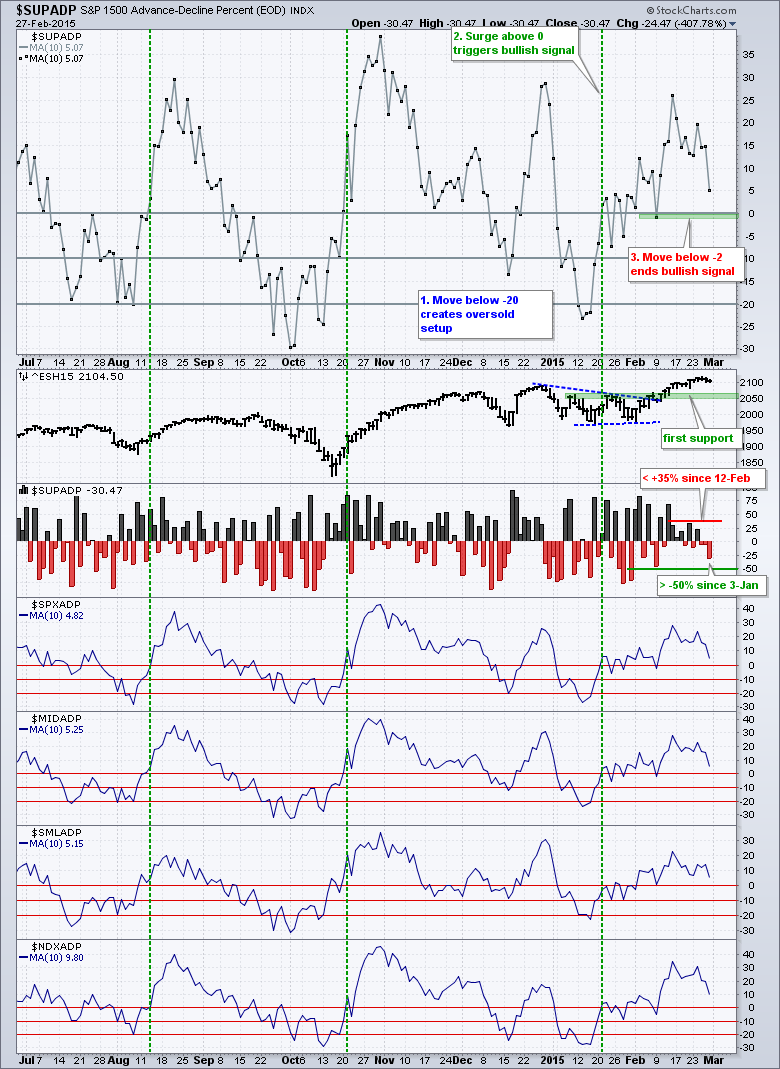
Stocks actually showed some selling pressure last week, but it was relatively mild and only for a few days. The S&P 500 moved above 2119 on Tuesday afternoon and then worked its way lower the rest of the week... Read More